THE IMPACT OF THE EARTHQUAKE
RISK PARAMETERS ON GIS-BASED
REAL ESTATE VALUATION
Ceren Erdin Gundogdu*
* Department of Business Administration, Yildiz Technical University, Istanbul, 34349, Turkey,
Email: ceren_erdin@yahoo.com
Abstract Real estates (house-land) as accommodation and investment tools preserve their importance and priority in human lives. Moreover, from an administrative point, objective (unbiased) valuation of real estates is of utmost importance for taxation, expropriation, and privatization operations. Location of the real estate and social, environmental, and individual data of its location as well as specific data of the real estate play an important role in the valuation process and directly affect the result. In this research, an analysis of real estate valuation was performed based on Istanbul’s district limits and by using the related modules in ArcGIS environment. In the second part of the research, by taking into consideration the earthquakes that are % 62 likely to take place up until 2030 and risk parameters concerning these earthquakes, an assessment has been made so as to determine how the risk parameters affect properties.
Paper type: Research Paper Published online: 14 October 2011 Vol. 1, No. 3, pp. 175-186
ISSN 2083-4942 (Print) ISSN 2083-4950 (Online)
© 2011 Poznan University of Technology. All rights reserved.
Keywords: GIS, Real Estate Valuation, Multi-Criteria Analysis, Eearthquake Risk Parame-ters
1. INTRODUCTION
Real estate valuation is defined as scientific and objective appraisal of a real es-tate considering physical, social and environmental effects in the region where the real estate is located. Management problems of any city of the country, for example complications related to participation in management and service offerings, could be overcome by integrating real estates in the residential areas that make up the city within a system structure and conducting analyses which would set basis for manage-rial decisions. The data to address this need are generally of geographical nature and the solution lies within geographical information systems. A geographical infor-mation system aimed at city management is defined as City Inforinfor-mation System. City Information System optimizes basic analysis and decision-making processes for solv-ing location-based complex organization, plannsolv-ing and management problems.
2. AIM AND SCOPE
The purpose of this study is to perform district-based real estate valuation in Turkey’s largest city, Istanbul and to determine the distribution of real estate unit values generated by the rent sources of the city. In the study, instead of object-based valuation, the distribution of district-object-based real estate unit values was deter-mined for Istanbul. Past studies in this area have not proposed a general and valid model for real estate valuation with independent, unbiased and objective measures. However, the problem can be solved on a regional basis instead of individual real estate appraisal with methods such as:
• Comparison • Revenue • Cost • Rating
In the research, a model based on updated data (environmental and social) of the region to be appraised was built with multi-criteria decision-making analysis. City Information System stores city data (data base) forming base for decisions of city administrations and provides opportunity for rational decisions by analyzing these data (database administration system).
In addition of this data doubtlessly, one of the most important parameters of the properties is the earthquake risk parameters. In this research which takes into ac-count the earthquake risk parameters has been made. The purpose is to show how these properties would change, should an expectation of a possible earthquake came into being. For this purpose, Istanbul was selected as the case study and an analysis on “the distribution of real estate unit values” in 39 districts was per-formed to satisfy the investment and accommodation needs of a person who is to decide his/her living environment.
3. MATERIAL AND METHOD
Istanbul, located around the Bosporus with 5 343.19 km2 area, is the largest city in Europe with a population of 13 million. Bosporus is named after Istanbul and connects the Black Sea and Marmara Sea. In terms of economic activities, 24% of household expenses in Turkey take place in Istanbul. In terms of city history, civil administration is “Governorate” and local administration is “Metropolitan
Munici-pality. The city is divided into 39 districts and the administrative organization of
the district is made of District Governorate and District Municipality as civil and local administrations respectively. Considering the districts as residential areas, environmental values are having littoral areas on the Bosporus or on the sea; if there is no shore then the distance to the shore; transportation facilities (life without private owned vehicles); road network (life for people with private owned vehi-cles); and natural (green) areas whereas social values are educational institutions; hospitals; cultural level; contribution to domestic income and earthquake risk. Both environmental and social values have been accepted as important criteria that are instrumental in the formulation of real estate unit values in a region (district).
In addition to environmental and social data (values), • Individual values and expectations
• Real estate specific values
are known to play an important role in estate valuation. It is difficult to compre-hend a huge city such as Istanbul and make decisions based on the obtained infor-mation because there are prosperities in all regions of Istanbul to fulfil individual preferences. Therefore, valuation of real estates with safe, readily available and analyzable data on the basis of regions (districts) will be an important step in city management. This could be realized by Geographic Information System (GIS) technology that is an important area of expertise because the data to be used in real estate appraisal are rather geographical data and Geographic Information System is used for storing, processing, managing, modelling and analysis of geographical data that is designed to solve complex planning, organization and management problems. For this reason, in the research, query and display of geographical data is performed by different analyses.
3.1. Real estate valuation methods
Real estate valuation process starts inevitably with construction of real estate database. The most appropriate method for district-based valuation is rating. The main purpose of individual real estate valuation is to determine the current value that is defined as the normal buying-selling value. However, it should be kept in mind that even experts cannot determine the precise value of a real estate be-cause each real estate has countless properties in terms of its location and use. It is unavoidable that these properties differ qualitatively and quantitatively from person
to person. Therefore, assessing real estates in clusters related to environmental and social data (social geography) of a region may reveal some numerical and rational relations. Hence, individual preference becomes easier by addressing expectations.
3.2. The impact of the earthquake risk parameters
In Turkey, the Gölcük-Sakarya-Bolu section of the North Anatolian fault line fractured in 1999 causing a 7.4 earthquake. The part of the West Wing of the North Anatolian fault line which is in the Marmora Sea is 11-12 kilometres away from the Southern coasts. The research conducted after the 1999 Earthquake conclude that with a 62 % probability there will be another earthquake in this region in the following 30 years. (Barka, 2000) In this reason, this research which takes into account the earth-quake risk parameters has been made. The purpose is to show how these properties would change, should an expectation of a possible earthquake came into being.
Individual preferences have priority in case of earthquake forecast, will change how real estate values, is determined by taking into account the parameters of the earthquake. While determining the earthquake risk parameters; earthquake risk regions, soil structure, frequency of buildings in a particular region, the style adopted in building construction and Tsunami are taken into account as earthquake components. While evaluating earthquake risk parameters, the previous research done on this issue, earthquake risk region maps, soil structure maps, frequency of buildings in a particular region and the style adopted as well as Tsunami scenarios have been taken into consideration.
4. CASE STUDY
Until recently, questionnaire surveys were conducted at household level during census data collection in our country. These questionnaires contained very im-portant cultural and economic data and instead of individual real estate valuation, they were primarily used for determining regional real estate value distributions.
In order to be able to assess societal sections on the basis of boroughs, the study utilized 1990 and 2000 census data, which were spatial projections of societal data (Güvenç & Işık, 1996).
Istanbul can be defined with different societal sections that are made of inter-twined layers partly overlapping with its 15 million populations. The research in question generated status-income, status-house, and origin-income maps from cen-sus data of 79,000 household heads in 500 neighbourhoods for regional assessment of real estate valuation on the basis of boroughs (Güvenç et al., 2005).
Economic activity profiles and education level profiles on the basis of neigh-bourhoods of boroughs of Istanbul constitute the important criteria in those studies
for determining geographical distribution of real estate valuation on the basis of boroughs. Assessment of the data in question was performed in two stages as “Is-tanbul Metropolitan Planning Studies” for 1990 and 2000. The changes occurred between these two dates were discussed under “1990-2000 Results” heading (Güvenç, et al., 2005).
The results of Istanbul Metropolitan Planning Studies were used in scorings re-quired for real estate valuation studies. Societal topography and its projection as spatial data were assessed through geographical information system technology. Instead of individual real estate valuation, multidimensional assessment of the re-gion where the real estate is located helps the preferences to be incisive in rere-gional data based decision-making stage for real estate selection.
4.1. Real estate valuation solutions
A case study on real estate valuation by analyzing region- (district-) based envi-ronmental and social data was conducted on the districts of Istanbul. Initially, we tried to find a strong relation between real estate valuation and the criteria for se-lecting a person’s living environment. In the first stage, the steps required for mul-ti-criteria decision-making were as follows:
• Collection of up-to-date data on the regions where the real estates are lo-cated;
• Determination of the criteria for decision-making;
• Determination of the values, weights and units of the criteria of the alterna-tives to be used in the comparison.
• Construction of the decision matrix (Yoon & Hwang, 1995).
Some of the 20 different data, which were determined as criteria, such as popu-lation and popupopu-lation density of the districts were obtained as public data. Envi-ronmental data such as location of the districts, road network and transportation were determined from current plans, satellite images and aerial photographs. The remaining data were obtained from real estate taxation records of local admin-istrations, from companies constructing and trading real estates and from the results of previous studies.
Weighting of the criteria was performed by literature review on the subject (Metropolitan Area Studies, 2005) and also by considering the assessments of peo-ple and institutions that are experts in this area (Fig. 1/A-B-C).
Fig. 1 (A) Distribution of economic activity profiles (1990), (B) Distribution of educa-tion level profiles, (C) Distribueduca-tion of economic activity profiles (2000)
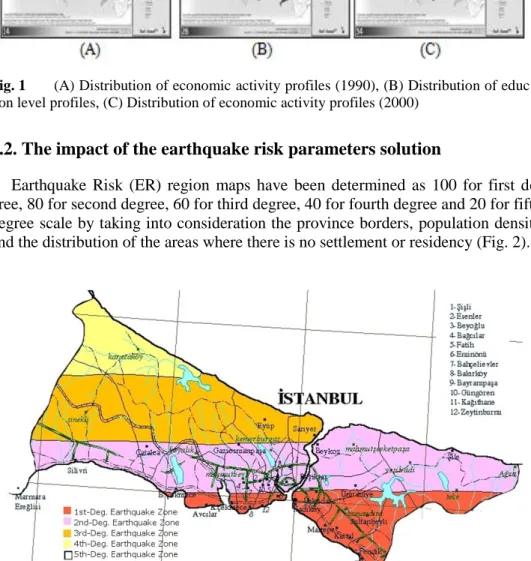
4.2. The impact of the earthquake risk parameters solution
Earthquake Risk (ER) region maps have been determined as 100 for first de-gree, 80 for second dede-gree, 60 for third dede-gree, 40 for fourth degree and 20 for fifth degree scale by taking into consideration the province borders, population density and the distribution of the areas where there is no settlement or residency (Fig. 2).
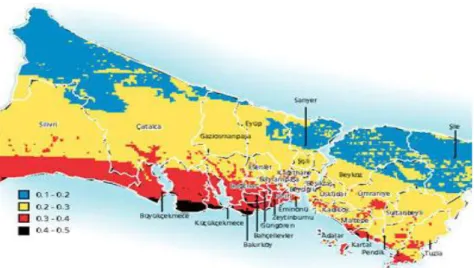
The soil types that are mentioned in the map of the soil structure of Istanbul (SS) have been rated as 100 for weak structure, 80 for loose soil structure and 10 for rocky soil structure (Fig. 3).
Fig. 3 Istanbul soil structure map (world bulletin)
The results of the research that take into consideration the frequency of
the buildings (FB), construction types and environmental factors (Kundak & Türkoğlu,
2007) (Fig. 4) concerning risk regions, provinces that carry a high risk factor are rated over 100, provinces where there are many risk regions are rated over 90, middle risk provinces are rated over 80, little risk rated over 50 and no risk rated over 00 points.
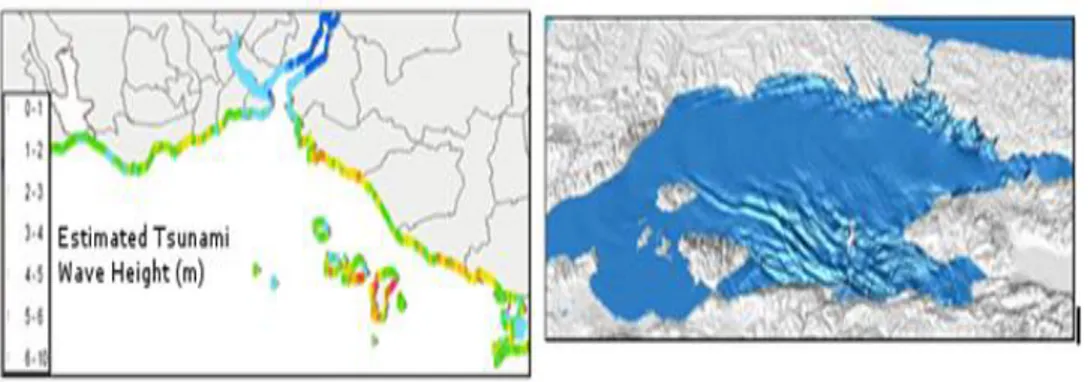
Fig. 5 The projected tsunami wave heights
Another component of the earthquake is the Tsunami risk (TR) “Tsunami Dan-ger Analysis Report” has been taken into consideration and the provinces that are within the influence area of a possible Tsunami have been rated according to the projected wave heights of the Tsunami (Yalçıner, 2007), (Fig. 5).
In this manner, for 6-10 meters the rate is 70, 5-6 meters 60, 4-5 meters 50, 3-4 meters 30 and 1-3 meters 10 points make up the basis of the evaluation.
5. REAL ESTATE UNIT VALUE DISTRIBUTION
Public data were used as suggested in their sources while the criteria affecting the value of real estates were scored over 100. In scoring, up-to-date data and expert data were considered along with the studies on this subject. In the same fashion, the weights in the formula to generate the distribution table of scores were determined in line with the results of previous studies and expert opinions and suggestions. In the assessment stage, the data of “Istanbul Metropolitan Area Studies” were meticulously analyzed. Real estate unit value is calculated by weighting the 20 criteria, which were determined by considering geographical location, environmental and social data of 39 districts (Tab. 1) (excluding the Princes’ Islands and Beyoglu) of Istanbul as follows:
{([Population] * 0.2) + ([Density of Population * 0.3) + ([Gross Domestic Product] * 0.8) + ([Purchasing Power ] * 0.9) + ([Land Value] * 0.9) + ([Road Network] * 0.85) + ([Rent] * 0.8) + ([Natural Value] * 0.9) + ([Number of Shopping Centers] * 0.8) + ([Coast Length] * 0.8) + ([Transportation] * 0.8) + ([Health] * 0.9) + ([Culture] * 0.8) + ([Education] * 0.9) + ([Seascape] * 0.7) + ([Distance to Coast] * 0.9) - ([Earthquake Risk] *1) - ([Soil Structure] * 0.9) - ([Frequency of the Buildings] * 0.8) - ([Tsunami Risk] * 0.5)}/20
(Density of Population (DOP): District Population/ Area of District (km2), Purchasing Power (PP):
[Gross Domestic Product (GDP)] * %20, Land Value: m2/Turkish Lira (TL), Road Network: Total Road Length (km)/ Area of District (km2), Natural Value: [Greenfield (km2)/ Area of District (km2)]
* 100, Transportation: Percentage of Use of Public Transport, Health: District Population/ Hospital Number, Culture: Number of Culture Centers, Education: [Number of University Graduates/ District Population] * 100, Seascape: Percentage of Area, which has a seascape, Earthquake Risk (ER): Degree, Soil Structure (SS):%, Frequency of the Buildings(FB):%, Tsunami Risk (TS): m.)
Spatial assessments and analyses were conducted in ArcGIS 9.3.1 (ArcInfo) software. Using the "Topo to raster" command in the "Spatial Analyst" module of the software, raster-based thematic data was generated. The equation used for as-sessment was applied to the thematic data that were generated by using the "Raster Calculator" command of the same module and the necessary analyses were per-formed. Analysis results were presented as raster maps of real estate unit value distribution.
Table 1 Population distribution, environmental and social criteria that affect the unit values of real estates in Istanbul’s districts
When real estate unit value distribution maps are analyzed, unit value distribu-tion boundaries of the data is given only over ten classes in Fig. 6A. In this figure, the number of classes is increased to 10 and it is possible to see unit value distribu-tions occurring in overlapping and intertwining areas that appear between borough limits.
By also taking into consideration the earthquake risk criteria, the new equation has been assessed following the former evaluation steps and the result has been classified into 10 categories. When this result is compared with the previous evalu-ation which did not take into considerevalu-ation the earthquake criteria in the first sec-tion (10 categories), it can be observed that in regions where the risk of a possible earthquake is high, soil structure bad, building frequency high and environmental conditions threatening and lastly the possibility of Tsunami, again, high, properties are losing value in contrast to the ones that are in low risk areas.
Fig. 6 (A) Real estate unit value distribution with respect to districts (10 classes), (B) Unit value distribution with respect to earthquake risk parameters (10 classes)
6. CONCLUSION
Scientific and objective real estate valuation has an important part in both peo-ple’s decision-making processes for investment and accommodation purposes and reflection of these values on taxation. However, despite the accretion of expertise in this area, it is considerably difficult, even impossible to determine the value (current value) of a real estate. Therefore, there is a need for a strong database and new approaches in this area.
As a result of the assessment, it has become possible to know where and to what extent the demands and expectations of a person to buy a real estate in Istanbul for
investment or accommodation purposes could be satisfied on the basis of regions (district). The results obtained provide rational decision-making opportunities for especially management plans and investment projects of local administrations.
Conducting the valuations based on Geographic Information Systems (GIS) has introduced new dimensions to the subject. Moreover, the needs for a countrywide database and a new structuring have been revealed.
The properties have an important role in Istanbul where the dominant view holds on to the high possibility of a future earthquake and the fact that the residents do not give priority to this in their preferences should be called to the attention of local governance and investment projects.
REFERENCES
Barka, A., (2000), The next expected Marmara Earthquake, International İstanbul Earthquake Meeting, TUYAP Fuarcılık, İstanbul, (in Turkish).
Dale, P.F. & McLaughlin, J.D., (1988), Land Information Management: An Introduction with Special Reference to Cadastral Problems in Third World Countries, Oxford University Press, Oxford.
Deveci, E. & Yılmaz, I., (2009), “The Evaluation of Real Estates by Geographical Information Systems: The Case of Central Afyonkarahisar”, Electronic Journal of Map Technologies, Issue: 1, Vol: 1 available at: http://www.teknolojikarastirmalar.com/frmDetayEN.aspx?IDDergi=6&IDIcerik=36 3 (accessed 20 June 2011), (in Turkish).
Earthquake Maps, available at: http://www.haritaburada.com/deprem-haritalari/istanbul-ili-deprem-haritasi/ (accessed 01 September 2011).
Flury, U., (1985), "Zur Boden- und Liegenschaftsbewertung in der Schweiz", Institut für Kulturtechnik, Zürich.
Güvenç, M. & Işık, O. (1996), "In Istanbul: An analysis of the Differentiation Status-Residential Property," [in:Turkish] Toplum ve Bilim, No. 71.
Güvenç, M., Eraydın, Z., Yoncacı, P. & Ozbay, S., (2005), Istanbul Metropolitan Area Studies, Istanbul, (in Turkish).
Hwang, C.L. & Yoon, K., (1995), Multiple Attribute Decision Making, Springer-Verlag, Heidelberg-Berlin.
Schmalgemeier, H., (1977), "Bodenpreisanalyse für den Innenstadtbereich einer Groβstadt", Vermessung und Raumordnung (VR) 39/8, Osnabrück.
Kundak S. & Türkoğlu H., (2007), “Seismic Risk Analysis for the city of Istanbul”, [in Turkish] a Mimarlık, Planlama, Tasarım, İTÜ Dergisi, Vol. 6, No. 2, pp.37–46. Yalçıner, A.C., (2007), “Microzonation Project at the European and Asian Sides of
Istanbul” available at: www.ibb.gov.tr/tr-TR/SubSites/IstanbulVeDeprem/Calis-malarimiz/Pages/AnadoluYakasiMikrobolgeleme.aspx (accessed 01 September 2011), (in Turkish)
World Bulletin, (2007), “Earthquake map of Istanbul” available at: http://www.dunyabulteni.net/index.php?aType=haberArchive&ArticleID=21359 (accessed 01 September 2011), (in Turkish).
BIOGRAPHICAL NOTES
Ceren Erdin Gundogdu was born in Istanbul-Turkey in 1973. In 1997 she was
graduated form Marmara University (Turkey) Faculty of Economic and Administrative Sciences and in 2001 she completed here master thesis about Economic Policy at Istanbul University (Turkey). She wrote her doctoral thesis about “Fuzzy Goal Programming” and gained a Ph.D. degree in 2007 from Istanbul University. Since 2002 she is an academic staff of Department of Business Administration of Yildiz Technical University (Turkey). She has a lot of articles and presentations both in Turkish and in English. She is also reviewer and editor of some international journals. Her academic fields are especially decision making,