3D
1.
ac em rel hu lev Th eff ch pl co me se of di en pr nu zo (L is Volume/TD Simulati
And Malgo Wojciech J Th. Introductio
Predictio ccidental leaka mergency resplease into the uman health (L vel or human he presence o ffects (Pontigg So far, hlorine cloud d anning of em omputational t erical descript nts one of the ften an iterativ fferent aspects nt approaches rocesses (Andr umerical mode ontal plain (Th Labovský & Je considered in Annual Ro Tom 20. Year/Rok
ion of Chlo
drzej Polancz orzata Majde Jarosz, Rafał e Main Schooon
on of dispersio age in environ onse (Dong et atmosphere, Li et al. 2015) breath level ( f hazardous g ia et al. 2010) different appr dispersion (Lo mergency respo echniques are tion of multip e most challen ve process that s of analyzed p such as 2D o reinia et al. 2 el includes cal homan et al. elemenský 201 n dispersion prSet The Environ ocznik Ochrona Ś k 2018
orine Disp
zyk, Zdzislaw er-Lopatka, A Matuszkiewi ol of Fire Ser on of hazardo nment is essen t al. 2017, Pie chlorine cloud . Dense gases (Scargiali et al gases in such . roaches are ap vreglio et al. 2 onse in case o applied (Han phase process nging applicat requires a mu problems (He or 3D numeri 016, Ganta et lculation of g 2006) but it 10). Moreover, rocess, differe nment Protectio Środowiska ISSN 1506-218Xersion in R
w Salamonowi Anna Dmocho cz, Radosław rvice in Wars ous substances ntial for analy ecuch & Piecu d may cause s tend to accum l. 2011, Siddiq areas multipl pplied to prev 2016). To assi of release of d nnaa et al. 200es, i.e. disper ions (Markiew ultiple modelin et al. 2017). T ical descriptio t al. 2014). Ho as transport n also includes , as different c ent turbulence n X 1035-1048
Rrural Are
icz, owska, w Makowski saw s resulting fro ysis of risk an uch 2013). Aft serious injury mulate at grou qui et al. 2012 ies the negati vent the effec ist decisions a dangerous gas 09). Reliable n rsion still repr wicz 2012). It ng to understa There are diffe on of dispersi owever, reliab not only in ho s 3D moveme character of flo e models are a 8ea
om nd fter to nd 2). ive cts nd ses nu- re-is nd er-on ble ori-ent owap-plied (Hongna et al. 2015, Ming-Liang et al. 2010, Tominaga & Stathopoulos 2009).
Various numerical tools are applied for description of dispersion process i.e. PHAST software (Wang et al. 2017), ALOHA software (Thoman et al. 2006), ANSYS software (Polanczyk et al. 2013, Salamonowicz et al. 2015). Development of numerical algorithms has enabled the computational fluid dynamics (CFD) models to be used ex-tensively in indoor dispersion studies (Dong et al. 2017). Numerical methods based on computational fluid dynamics (CFD) may facilitate the precise investigation of the hazardous substances dispersion (Meroney 2012). Therefore, the aim of the study was to prepare a transient CFD model describing the phenomena of chlorine dispersion in a dynamic setup including different environmental factors.
2. Materials and methods
Emergency chlorine ejection into atmosphere was prepared using the following boundary conditions: free ejection of chlorine into open space (T = 25°C and P = 101325 Pa); the total amount of ejected chlorine was equal to 1.8 kg. The properties of analyzed gases were as follow: air (ρ = 1.23 kg/m3, ƞ = 1.79 10-5 kg/(m s)), chlorine (ρ = 2.95 kg/m3, ƞ = 1.33 10-5 kg/(m s)) (Steven R. Hannaa et al. 2009).
Two approaches of chlorine concentration estimation were ana-lyzed: first – horizontal (2D) simulation (eq.1) (Aloha software) (Sun et al. 2013, Thoman et al. 2005, Tsenga et al. 2012) and the second – horizontal and vertical (3D) simultaneous simulation (ANSYS software) (Polanczyk et al. 2013, Wawrzyniak et al. 2012a, Wawrzyniak et al. 2012b).
2.1. 2D approach of dispersion
2D approach was analyzed with the use of Aloha software. Math-ematical domain was described with rectangle (length = 500 m, width = 200 m) (Fig. 1a). Chlorine ejection was described with the circular hole (diameter = 0.1 m) placed 100 m from wind inlet to the domain. Following boundary conditions were applied: velocity inlet (circular surface), outlet (remaining lines). Reconstruction of dispersion in real conditions required usage of Pasquill stability classes (Krügera & Emmanuel 2013). Each time constant humidity (φ = 50%) was considered.
𝐶 𝑀 2𝜋 / 𝜎 , 𝜎 , 𝜎 𝑒𝑥𝑝 𝑥 𝑢𝑡0 2𝜎 𝑦 2𝜎 𝑒𝑥𝑝 𝑧 𝐻 2𝜎 𝑒𝑥𝑝 𝑧 𝐻 2𝜎 𝑋 𝑥, 𝑦, 𝑧 𝑒𝑥𝑝 𝑒𝑥𝑝 (1) where:
X(x,y,z) – atmospheric concentration for chemical releases, [mg/m3],
Q – source term release rate for chemical releases, [mg/s], x – downwind distance (relative to source location), [m], y – crosswind distance (relative to plume centerline), [m], z – vertical axis distance (relative to ground), [m],
H – effective release height (relative to ground), [m], y – crosswind distance (relative to plume centerline), [m],
σy, – horizontal dispersion coefficient (function of x), representing the
standard deviation of the concentration distribution in the crosswind axis direction, [m],
σz – vertical dispersion coefficient (function of x), representing the
stand-ard deviation of the concentration distribution in the vertical axis direc-tion, [m],
u – average wind speed, [m/s].
2.2. 3D approach of dispersion
In the second step 3D dispersion of gas mixture (including height) was prepared with the use of Ansys-Fluent 18 software. For 3d simula-tion Reynolds Averaged Navier-Stokes equasimula-tions (eq. 2-4) were applied (Ganta et al. 2014, Zieminska-Stolarska et al. 2015).
𝜌 𝜕𝑣 𝜕𝑡 𝑣 𝜕𝑣 𝜕𝑥 𝑣 𝜕𝑣 𝜕𝑦 𝑣 𝜕𝑣 𝜕𝑧 𝜌𝑔 𝜕𝑝 𝜕𝑥 𝜇 𝜇 2 𝜇 𝜇 𝜇 𝜇 (2) 𝜌 𝜕𝑣 𝜕𝑡 𝑣 𝜕𝑣 𝜕𝑥 𝑣 𝜕𝑣 𝜕𝑦 𝑣 𝜕𝑣 𝜕𝑧 𝜌𝑔 𝜕𝑝 𝜕𝑦 𝜇 𝜇 𝜇 𝜇 2 𝜇 𝜇 (3) 𝜌 𝜕𝑣 𝜕𝑡 𝑣 𝜕𝑣 𝜕𝑥 𝑣 𝜕𝑣 𝜕𝑦 𝑣 𝜕𝑣 𝜕𝑧 𝜌𝑔 𝜕𝑝 𝜕𝑧
𝜇 𝜇 𝜇 𝜇 𝜇 𝜇 (4) where:
vx,vy,vz – velocity components for x, y, z directions, [m/s],
t – time [s],
g – acceleration in x, y, z direction, [m2/s],
µ – fluid viscosity, [Pa s], ρ – fluid density, [kg/m3],
µt – turbulent viscosity, [Pa s].
First, 3D geometry of prism was prepared with the use of a pre-processor (length = 500 m, width = 200 m, height = 50 m) (Fig. 1b). In the lower part of analyzed domain, cylindrical geometry representing chlorine ejection was located (0.3 m above the ground with diameter = 0.1 m). Next, digital grid composed of tetrahedrons with boundary layer was created. After mesh independent tests the number of numerical grid elements was established at approximately 900 000, with boundary layer composed of 10 layers. To simulate chlorine ejection into atmosphere a multiphase approach was considered. As previously described the vol-ume of Fluid model (VOF) in Ansys-Fluent was applied (He et al. 2017). Flow of two phases, air and chlorine, was assumed. The following boundary conditions were used: mass flow inlet (one surface), wall (one surface – as a ground), pressure outlet (three surfaces) and velocity inlet (one surface). At the inlet do the geometry, near the source of chlorine ejection, velocity inlet boundary representing flowing air was applied. Velocity profile was experimentally set (Table 1) and configured as a function of height u(h) (eq. 5).
Chlorine was applied with the use of mass flow inlet boundary equal to 1.8 kg/h. At the outlets pressure outlet boundary condition was applied. Finally ground was described with wall boundary with rough-ness, pretended appearance of buildings. Moreover, 1 hour of dispersion was assumed. According to the Reynolds number turbulent flow, de-scribed with the k-ε model, was established.
Fig. 1. Mathematical domain for: a) 2D dispersion, b) 3D dispersion.
Rys. 1. Matematyczna domena obliczeniowa dla: a) dwuwymiarowej dyspersji,
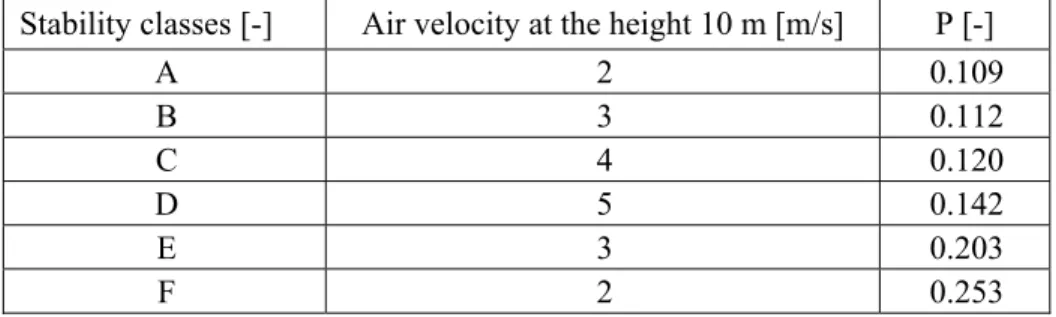
Table 1. Maximal air velocity for different stability class at the 10 m height. Tabela 1. Maksymalne wartości prędkości wiatru dla różnych klas stabilności
na wysokości 10 m.
Stability classes [-] Air velocity at the height 10 m [m/s] P [-]
A 2 0.109 B 3 0.112 C 4 0.120 D 5 0.142 E 3 0.203 F 2 0.253
3. Results
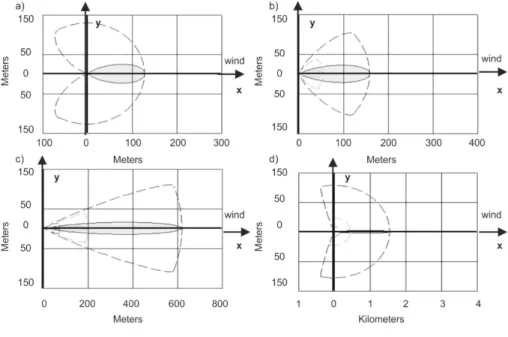
Two approaches for chlorine dispersion process were analyzed. It was observed that for horizontal chlorine distribution increasing wind velocity lead to longer and narrower chlorine cloud (Fig. 2). For the case when wind velocity was increased from 2-3 m/s (A-B stability classes) width of chlorine cloud was about 50 m and cloud length was increased from 120 m (2 m/s) to 150 m (3 m/s). Meanwhile, when velocity was decreasing from 3-2 m/s (E-F stability class), cloud became longer and narrower to about 25-20 m, and the length of chloride cloud was in-creased from 610 m (3 m/s) to 1300 m (2 m/s).
To include height parameter for chlorine distribution 3D model was analyzed. As the default values for turbulent model k-ε of flow was applied and two stability classes (A and B) (Fig. 3c and Fig. 3d) were simulated. Additionally, chlorine dispersion without wind was analyzed (Fig. 3a and Fig. 3b).
Analysis of chlorine distribution indicated that the highest con-centration was in the axis of chlorine ejection. Moreover, when wind was neglected circular profile of chlorine was observed (Fig. 3a and Fig. 3b). Quantitative analysis of chlorine distribution indicated a decrease in vol-ume fraction in function of height (from approximately 0.033 for 10.5 m to 0.0005 for 13.5 m). While with wind condition the model presented changes of chlorine profile shape which had the same direction as wind (Fig. 3c and Fig. 3d). Similarly to the case without wind a decrease in chlorine concentration in the function of height was observed. For the velocity 2 m/s (A stability class) the range of chlorine volume fraction
was 0.025-0.0001, while for the velocity 3 m/s (B stability class) the range of chlorine volume fraction was 0.019-0.0005.
Fig. 2. An example of horizontal distribution of chlorine for: a) wind velocity
2 m/s (A class), b) wind velocity 3 m/s (B class), c) wind velocity 3 m/s (E class), d) wind velocity 2 m/s (F class).
Fig. 2. Przykład poziomej dystrybucji chloru dla: a) prędkości wiatru 2 m/s
(klasa stabilności A), b) prędkości wiatru 3 m/s (klasa stabilności B), c) prędkości wiatru 3 m/s (klasa stabilności E), d) prędkości wiatru 2 m/s (klasa stabilności F).
Comparison of windless approach with velocity equal to 2 m/s in-dicated approximately 25% decrease of chlorine volume fraction for wind case. While, comparison of both cases at the level of 11 m indicated approximately 5% difference. Finally, for the height 13.5 m about 95% decrease of chlorine fraction (0.0001) compare to 10.5 m height was ob-served. Furthermore, for all analyzed cases maximal chlorine concentra-tion was noticed in a distance of about 20-50 m from the source of chlo-rine dispersion in direction of wind movement.
Fig. 3. An example of chlorine distribution for: a-b) chlorine dispersion without
wind (a – top view, b – zoomed top view); c-d) chlorine dispersion including wind (2 m/s) (c – top view, d – zoomed top view)
Rys. 3. Przykład dystrybucji chloru dla: a-b) rozprzestrzeniania chloru bez
uwzględnienia wiatru (a – widok z góry, b – powiększenie widoku z góry), c-d) rozprzestrzeniania chloru z uwzględnieniem wiatru (a – widok z góry, b – powiększenie widoku z góry)
4. Discussion
In this research, the effects of the environmental situations, like different wind intensity, with the release and spread of chlorine in the indoor space were presented. The numerical analysis of dispersion pro-duced both horizontal and vertical distribution of chlorine in analyzed mathematical domain. Similar to our study, Labovsky et al. investigated CFD model of chlorine dispersion however in urban environments. They found that the CFD approach determines the variation of properties, ve-locity, and concentration along the flow streamlines, which enhances the effectivity of this approach in the presence of obstructions, and in han-dling a complex terrain (Labovsky & Jelemensky 2013).
In our study we assumed turbulent character of flow, therefore, standard k-ε model was applied to describe its properties. It was in line with Xing et al. who observed that the results from the standard k-ε model were in acceptable agreement with the experimental data for the gas dis-persion process (Xing et al. 2013). Contrary to this Sklavounos et al. found that the standard k–ε model overestimate maximal concentration of heavy gas (Sklavounos & Rigas 2004). Nevertheless, our study indicated that this turbulent model may be used in simulation of chlorine dispersion.
To reconstruct a realistic conditions of wind appearance, a velocity profile at the inlet to the mathematical domain was applied. It was in line with Mack et al. who investigated CO2 dispersion where experimentally measured inlet profile of wind was applied (Mack & Spruijt 2014). More-over, it was observed that wind indicated chlorine cloud movement. Simi-larly, Safakar et al. who investigated chlorine dispersion, observed the ef-fect of various temperatures and wind on spreading the dense gases. More-over, they noticed that above the ground level the chlorine concentration increased slowly (Safakar et al. 2016). While, Hanna et al. reported that near the source, the obstacles tend to slow down the dense gas cloud and may constrain it causing an increase in concentration (Hanna et al. 2009).
5. Conclusions
2D model allowed prediction of polluted cloud in horizontal di-rection, while 3D model allowed description of horizontal and vertical distribution of chlorine. It was observed that with increase of Pasquill
stability class the area of chlorine dispersion had similar character for horizontal model as well as for 3D model.
Comparison of constant and dynamic setup indicated high impact of wind. For the windless case circular profile of chlorine concentration around dispersion source was observed. While, for the wind application the main chlorine concentration moved ahead the source of dispersion. Analysis of chlorine concentration in function of height resulted in de-crease of chlorine appearance in upper level of mathematical domain. While, analysis of chlorine concentration in function of wind intensity indicated extension of chlorine cloud with decrease of concentration.
References
Andreinia, A., Bianchinia, C., Puggelli, S., Demoulin, F.X. (2016). Develop-ment of a turbulent liquid flux model for Eulerian–Eulerian multiphase flow simulations. International Journal of Multiphase Flow, 81, 88-103. Dong, L., Zuo., H., Hu, L., Yang, B., Li, L., Wu, L. (2017). Simulation of heavy
gas dispersion in a large indoor space using CFD model. Journal of Loss Prevention in the Process Industries, 46, 1-12.
Ganta, S. E., Narasimhamurthyb, V. D., Skjoldb, T., Jamoisc, D.C.P. (2014). Evaluation of multi-phase atmospheric dispersion models for application to Carbon Capture and Storage. Journal of Loss Prevention in the Process In-dustries, 32, 286-298.
Hanna, S. R., Hansen, O. R., Ichard, M., Strimaitis, D. (2009). CFD model simulation of dispersion from chlorine railcar releases in industrial and ur-ban areas. Atmospheric Environment, 43(2), 262-270.
He, B., Jiang, X.-S., Yang, G.-R., Xu, J.-N. (2017). A numerical simulation study on the formation and dispersion of flammable vapor cloud in underground confined space. Process Safety and Environmental Protection, 107, 1-11. Hongna, Z., Takehiko Y., Kunugi, T. (2015). Turbulence modulation of the
upward turbulent bubbly flow in vertical ducts. Nuclear Engineering and Technology, 47(5), 513-522.
Krügera, E., Emmanuel, R. (2013). Accounting for atmospheric stability condi-tions in urban heat island studies: The case of Glasgow, UK. Landscape and Urban Planning, 117, 112-121.
Labovsky, J., Jelemensky, L. (2013). CFD-based atmospheric dispersion model-ing in real urban environments. Chemical Papers, 67(12).
Labovský, J., Jelemenský, Ľ. (2010). CFD simulations of ammonia dispersion using “dynamic” boundary conditions. Process Safety and Environmental Protection, 88(4), 243-252.
Li, Y., Chen, D., Cheng, S., Xu, T., Huang, Q., Guo, X., Ma, X., Yang, N., Liu, X. (2015). An improved model for heavy gas dispersion using time-varying wind data: mathematical basis, physical assumptions, and case studies. Journal of Loss Prevention in the Process Industries, 36, 20-29.
Lovreglio, R., Ronchi, E., Maragkos, G., Beji, T., Merci, B. (2016). A dynamic approach for the impact of a toxic gas dispersion hazard considering hu-man behaviour and dispersion modelling. Journal of hazardous materials, 318, 758-771.
Mack, M., Spruijt, M.P.N. (2014). CFD dispersion investigation of CO2 worst
case scenarios including terrain and release effects. Energy Procedia, 51, 363-372.
Markiewicz, M. (2012). A review of mathematical models for the atmospheric dispersion of heavy gases. A Classic. Models. Ecol. Chem. Eng., 19(3), 297-314.
Meroney, R.N. (2012). CFD modeling of dense gas cloud dispersion over ir-regular terrain. J. Wind Eng. Ind. Aerod. 104-106, 500-508.
Ming-Liang, Z., Lib, C.W., Shen, Y.-M. (2010). A 3D non-linear k–ε turbulent model for prediction of flow and mass transport in channel with vegetation. Applied Mathematical Modelling, 34(4), 1021-1031.
Piecuch, I., Piecuch, T. (2013). Environmental Education and Its Social Effects. Rocznik Ochrona Środowiska, 15(1), 192-212.
Polanczyk, A., Wawrzyniak, P., Zbicinski, I. (2013). CFD analysis of dust ex-plosion relief system in the counter-current industrial spray drying tower. Drying Technology, 31(8), 881-890.
Pontiggia, M., Derudi, M., Alba, M., Scaioni, M., Rota, R. (2010). Hazardous gas releases in urban areas: assessment of consequences through CFD modelling. Journal of hazardous materials, 176(1-3), 589-96.
Safakar, M., Syafiie, S., Yunus, R. (2016). CFD Analysis of Indoor Chlorine Gas Dispersion Storage: Temperatures, Wind Velocities and Ventilation Effects Studies. Asean Journal Of Chemical Engineering, 16(1).
Salamonowicz, Z., Kotowski, M., Polka, M., Barnat, W. (2015). Numerical simulation of dust explosion in the spherical 20l vessel. Bulletin of the Pol-ish Academy of Sciences. Technical Sciences, 63(1), 289-293.
Scargiali, F., Grisafi, F., Busciglio, A., Brucato, A. (2011). Modeling and simu-lation of dense cloud dispersion in urban areas by means of computational fluid dynamics. Journal of hazardous materials, 197, 285-293.
Siddiqui, M., Jayanti, S., Swaminathan, T. (2012). CFD analysis of dense gas dispersion in indoor environment for risk assessment and risk mitigation. Journal of hazardous materials, 209-210, 177-85.
Sklavounos, S., Rigas, F. (2004). Validation of turbulence models in heavy gas dispersion over obstacles. Journal of hazardous materials, 108(1-2), 9-20.
Sun, B., Utikara, R.P., Pareeka, V.K., Guob, K. (2013). Computational fluid dynamics analysis of liquefied natural gas dispersion for risk assessment strategies. Journal of Loss Prevention in the Process Industries, 26(1), 117-128.
Thoman, D.C., Davis, M.W., O'Kula, K.R. (2005). A Comparison of EPIcode and ALOHA Calculations for Pool Evaporation and Chemical Atmospheric Transport and Dispersion. Washington Safety Management Solutions LLC, 1-15.
Thoman, D.C., O’Kula, K.R., Laul, J.C., Davis, M.W., Knecht, K.D. (2006). Comparison of ALOHA and EPIcode for Safety Analysis Applications. Journal of Chemical Health and Safety, 13(6), 20-33.
Tominaga, Y., Stathopoulos, T. (2009). Numerical simulation of dispersion around an isolated cubic building: comparison of various types of k-ε mod-els. Atmospheric Environment, 43920, 3200-3210.
Tseng, J.M., Su, T.S., Kuo, C.Y. (2012). Consequence Evaluation of Toxic Chemical Releases by ALOHA. Procedia Engineering, 45, 384-389. Wang, K., Liu, Z., Qian, X., Huang, P. (2017). Long-term consequence and
vulnerability assessment of thermal radiation hazard from LNG explosive fireball in open space based on full-scale experiment and PHAST. Journal of Loss Prevention in the Process Industries, 46, 13-22.
Wawrzyniak, P., Podyma, M., Zbicinski, I., Bartczak, Z., Polanczyk, A., Rabaeva, J. (2012a). Model of Heat and Mass Transfer in an Industrial Counter-Current Spray-Drying Tower. Drying Technology, 30(11-12), 1274-1282. Wawrzyniak, P., Polanczyk, A., Zbicinski, I., Jaskulski, M., Podyma, M.,
Raba-eva, J. (2012b). Modeling of Dust Explosion in the Industrial Spray Dryer. Drying Technology, 30(15), 1720-1729.
Xing, J., Liu, Z., Huang, P., Feng, C., Zhou, Y., Zhang, D., Wang, F. (2013). Experimental and numerical study of the dispersion of carbon dioxide plume. Journal of hazardous materials, 256-257, 40-48.
Zieminska-Stolarska, A., Polanczyk, A., Zbicinski, I. (2015). 3-D CFD simula-tions of hydrodynamics in the Sulejow dam reservoir. Journal of Hydro-logy and Hydromechanics, 63(4), 334-341.
Symulacja 3D dyspersji chloru w terenie wiejskim
Abstract
Prediction of hazardous substances dispersion resulting from accidental leakage in environment is essential for risk analysis and emergency response. Different numerical tools are applied for description of dispersion process. De-velopment of numerical algorithms has enabled the computational fluid
dynam-ics (CFD) models to be used extensively in indoor dispersion studies. Numerical methods based on computational fluid dynamics (CFD) may facilitate the pre-cise investigation of the hazardous substances dispersion. Therefore, the aim of the study was to prepare a transient CFD model describing the phenomena of chlorine dispersion in a dynamic setup including different environmental fac-tors. Reliable computational description of dispersion process still represents one of the most challenging applications. Therefore, we aimed to prepare a tran-sient 2D and 3D numerical models of chlorine dispersion from a ground source in a dynamic setup. For 2D simulation a Degadis model was used, while for 3D approach a multiphase Volume of Fluid model (VOF) was applied. For both
analyzed cases area of investigation was equal to 0.1 km2. Furthermore, for 3D
simulations height was equal to 50 m. For the reconstruction of atmospheric conditions Pasquill stability classes and one-direction wind were applied. Analysis of chlorine concentration in function of wind intensity indicated exten-sion of chlorine cloud with decrease of concentration. Moreover, comparison of constant and dynamic setup indicated high impact of wind. In case of windless conditions circular profile of chlorine concentration around dispersion source was noticed. Wind directed the chloride cloud which dispersed accordingly to the wind direction. As expected chloride concentration decreased with altitude. 2D model allowed prediction of polluted cloud in horizontal direction, while 3D model allowed description of horizontal and vertical distribution of chlorine. It was observed that with increase of Pasquill stability class the area of chlorine dispersion had similar character for horizontal model as well as for horizontal and vertical model (3D). For the windless case circular profile of chlorine con-centration around dispersion source was observed. Additionally, for the wind application the main chlorine concentration moved ahead the source of disper-sion. Analysis of chlorine concentration in function of height resulted in de-crease of chlorine appearance in upper level of mathematical domain.
Streszczenie
Predykcja dyspersji substancji niebezpiecznych z przypadkowych wy-cieków jest niezbędna w analizie ryzyka. W tym celu do opisu procesu dyspersji stosowane są różne numeryczne narzędzia. Rozwój matematycznych algoryt-mów umożliwia stosowanie m.in. techniki CFD na szeroką skalę. Tym samym celem niniejszej pracy było opracowanie dwuwymiarowego i trójwymiarowego modelu opisującego zjawisko dyspersji chloru z naziemnego źródła. Dla dwu-wymiarowego podejścia zastosowano model Degadisa. Natomiast dla trójwy-miarowego podejścia wielofazowy model VOF. Dla obu przypadków
po-wierzchnia analizowanego obszaru wynosiła 0.1 km2. Co więcej, dla
50 m. W celu rekonstrukcji parametrów atmosferycznych uwzględniono klasy stabilności Pasquilla oraz wpływ wiatru. Dwuwymiarowy model umożliwiał analizę procesu dyspersji w płaszczyźnie poziomej, podczas gdy model trójwy-miarowy umożliwiał analizę zarówno w płaszczyźnie poziomej jak i pionowej. Analiza obu modeli wskazuje, iż wzrost intensywności wiatru wydłuża zasięg chmury chloru, z jednoczesnym spadkiem jego stężenia. Co więcej, w przypad-ku nieuwzględnienia przepływu wiatru obserwowano kołowy profil stężenia chloru dookoła źródła dyspersji. Natomiast przepływający wiatr powodował zmniejszenie koncentracji chloru wraz z wysokością. Również zaobserwowano, iż uwzględnienie klas stabilności Pasquilla miało porównywalny efekt w przy-padku podejścia dwuwymiarowego i trójwymiarowego. Uwzględnienie wiatru powodowało przemieszczenie maksymalnej wartości stężenia chloru znad źró-dła dyspersji. Co więcej, analiza stężenia chloru w funkcji wysokości wskazuje na zmniejszenie zawartości chloru w górnej części domeny matematycznej.
Słowa kluczowe:
dyspersja chloru, CFD, model dyspersji gazu ciężkiego, przepływ turbulentny, model awaryjnej odpowiedzi
Keywords:
chlorine dispersion, CFD, dense gas dispersion models, turbulent flow, emergency response model