THE ROLE OF RENEWABLE ENERGY SOURCES
IN THE USA ENERGY PRODUCTION – PART II
Andrzej J. Gapinski
Engineering, The Pennsylvania State University-Fayette, The Eberly Campus, Lemont Furnace, Pennsylvania, 15456, USA, Email: ajg2@psu.edu
Abstract: The article analyzes the renewable energy resources in the USA including Pennsylvania.
Contributions of the most important renewable technologies in energy production are described: solar power, wind energy, hydroelectric, nuclear, and geothermal. The contribution of other resources such as hydrogen and fuel cells, bio-energy resources due to their negligible level of impact is not addressed. Some aspects of political considerations affecting policies and regulations related to energy production in the USA and beyond are also addressed. Academia’s response to new demands for graduates in alternative and renewable energies with an example of academic engineering degree program is included.
Paper type: Research Paper Published online: 31 December 2016 Vol. 6, No. 6, pp. 523–535
DOI: 10.21008/j.2083-4950.2016.6.6.4 ISSN 2083-4942 (Print)
ISSN 2083-4950 (Online)
© 2016 Poznan University of Technology. All rights reserved.
1. RENEWABLE ENERGY RESOURCES
In this section the contributions of the most important renewable technologies in the USA energy production are described: solar power, wind energy, hydroelectric, nuclear, and geothermal. The contribution of other resources such as hydrogen and fuel cells, bio-energy resources due to their negligible level of impact is not addressed.
1.1. Solar Energy
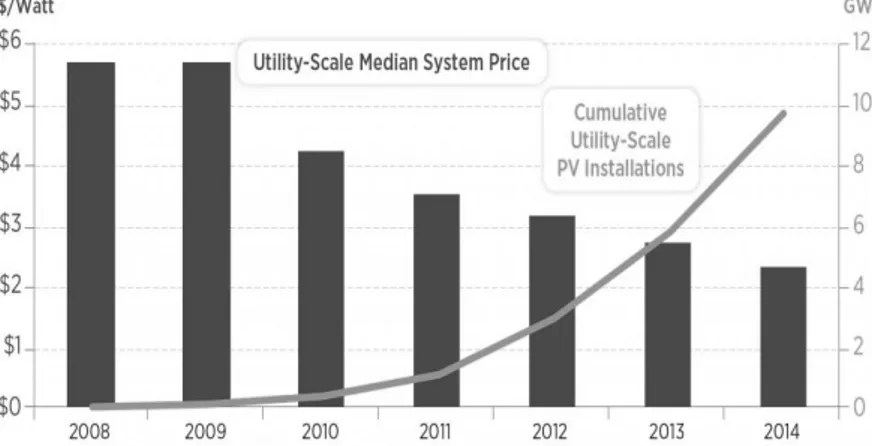
Solar renewable energy grew in importance in last decade as one of the solution to lower the carbon footprint of electric power generation. According to Solar Energy Industries Association (SEIA) the installation of photovoltaic (PV) power sources in the USA reached 6,200 MW in 2014, which is 30% increase from 2013 and 12 times the amount installed just five years earlier (SEIA, 2016). It was possible due to de-creasing costs of solar technology and an investment tax credit. The ultimate goal is to lower the cost of the solar technology so that it can compete with traditional sources without any subsidies. Figure 1 shows declining costs of solar photovoltaic technology and cumulative utility-scale PV installations in MW (Energy, 2016).
Fig. 1. Solar Photovoltaic - Utility Scale. Source: www.energy.gov (Energy, 2016)
U.S. Energy Information Administration (EIA, 2016) reported in March, 2016, that planned installation for 2016 includes 9.5 gigawatts (GW) of utility-scale solar more than 8 GW of natural gas and 6.8 GW of wind power generation. U.S. Solar Energy Industries Association, SEIA, differentiates between direct current (DC) and alternating current (AC) installations and claims that total installation in 2016 including 4GW of residential and commercial solar will amount to 15 GW (SEIA, 2016).
1.2. Wind Energy
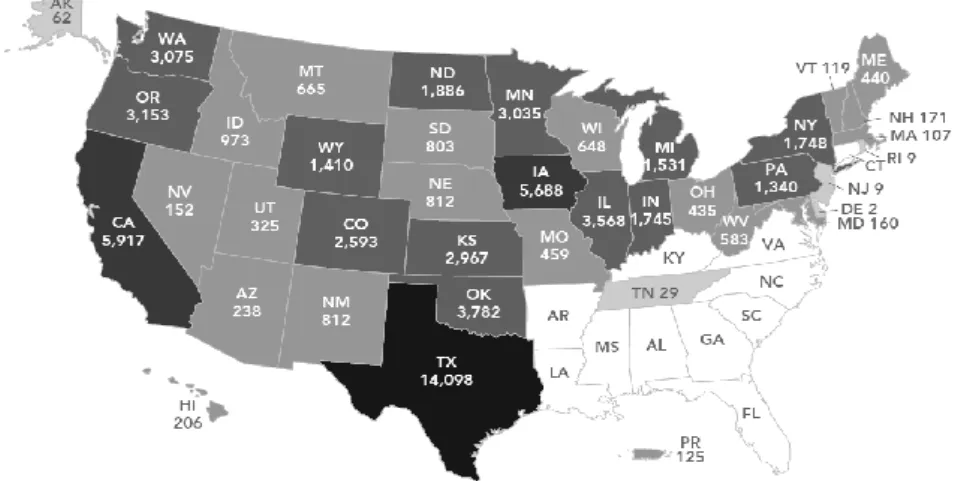
Although the first large wind farms were set up 35 years ago, wind energy ex-perienced dramatic growth only around year 2000. Figure 2 shows wind power capacity installations by U.S. states in megawatts (MW) (Energy, 2016). The cause for such a dramatic improvement were the declining prices of the wind technology, as wind energy costs dropped to the cost-competitive range of 5 to 10 cents per kilo-watt hour (¢/kWh) (Fig. 3). From that time on, as reported in (Energy, 2016), “wind installations have grown substantially, and now we have more than 65 gigawatts (GW) of installed capacity with another 13.6 GW of capacity in development.” The consequence of that rapid development is the fact that wind is in a position to exceed hydroelectric power and become number one in renewable energy. Wind power gen-erates 4.4 percent of U.S electric energy. It is important to note that wind reduces carbon footprint by an estimated 115 million metric tons annually (Energy, 2016). It is worth mentioning that wind technology provides around 50,000 jobs nationwide. U.S. Department of Energy estimates that an additional 700,000 square miles of land will be needed and used for wind farm occupancy (Energy, 2016).
Fig. 2. U.S. Wind Power Capacity installations by State. Source: www.energy.gov (Energy, 2016)
Middle of America, occupied by great plains from Canada to Texas that con-tains territory of Rocky Mouncon-tains and Mississippi River basin, is adopting wind power due to its abundance of windy weather. So it was not unexpected that the area experienced the largest growth in wind power generation installations in U.S. as shown in Figure 2. Although traditionally power generation was based on coal, increasingly states are switching to alternative sources of electric energy to reduce carbon emissions. Texas, for example, has increased tenfold wind generation
be-tween years of 2005–2015. Other states such as Nebraska, Iowa, Kansas, Minne-sota, Missouri, and Dakota have experienced similar adoption of wind technology. The process of rebalancing among fuels such as coal, natural gas, and renewables is an ongoing process with a significant contribution of shale gas in recent years.
According to American Wind Energy Association (AWEA), in 2015 the U.S. wind industry has installed 1 862 turbines totalling 3 596 megawatts (MW) (AWEA, 2016). This total wattage “more than doubles the 1,254 MW installed during the first three quarters of 2014.” The progress is clearly visible as in 2005 the United Stated generated about 9 000 MW of wind power, and today the number is around 70 000MW with ~13 000MW under construction (AWEA, 2016).
Fig. 3. Wind power cost per kWhr and Cumulative Wind Capacity Installed. Source: www.energy.gov (Energy, 2016)
1.3. Hydroelectric Energy
Hydropower is an older technology with first hydro-electric power plant built by Nikola Tesla and George Westinghouse in 1895 in Niagara Falls (Tesla, 2016). Hydropower is still a viable option and currently supplies around 6 percent of na-tional electric energy. The contribution has been more less steady for the last twenty years at a level between 9 and 6 percent, although is slightly declining due to an increased role of other renewables such as wind and solar. The prohibitively high initial costs and lack of availability of terrain with appropriate hydro-geographic characteristics are other causes of declining role of this type of energy source.
1.4. Nuclear Energy
Nuclear energy has maintained a steady contribution to national electric energy production at around 20 percent for last few decades. Despite its important role in
reduction of greenhouse gas emissions, due to political environment in the USA, already twenty years have passed since the last nuclear power plant, Watts Bar, was built in Tennessee and entered service in 1996, according to U.S. Energy Information Agency (EIA) (EIA, 2016). High costs, shale gas revolution, which introduced cheap natural gas and the society’s opposition to nuclear technology especially after Japa-nese Fukushima Daiichi nuclear disaster in March 11, 2011 (World-Nuclear, 2016), contributed to, de facto, an abandonment of extensive plans for nuclear plant con-struction. Currently, the USA has five nuclear power plants under construction with plans for additional five. It is expected that some of the new reactors will be on line by 2020 (World-Nuclear, 2016).
Worldwide, there are some 437 nuclear power reactors operating in some 31 coun-tries, with combined 380 GW capacity, supplying 11% of the world’s electricity. Over 60 nuclear power plants are being built mostly in Asia (World-Nuclear, 2016).
1.5. Geothermal Energy
Currently, three different technologies are used in the USA: dry steam, flash steam, and binary cycle systems. In dry steam system a steam from underground drives directly the power system. In flash steam system the steam from hot water of underground reservoir is used to drive turbines of power system and water is returned for sustainable operation. A binary system uses hot water from underground to heat up working fluid, which is vaporized to run turbines of power system (Renewable Energy World, 2016). The contribution of this type of technology in U.S. national energy balance is negligible although it offers viable opportunity especially in case of future oriented decentralized power systems with micro-hydroelectric power systems. With its huge potential the technology offers a sustainable energy alter-native and waits to be “discovered” and utilized much more widely. The situation can be totally different in other countries such as Iceland where the share of geothermal energy in energy supply of the island is about 68% and 29% of the total electricity generation (Ragnarsson, 2015). But this is a rather an exceptional situation as Iceland is endowed richly with abundant supply of geothermal resources due to its geological and geographical location.
1.6. Storing Alternative Energy
Until recently there were rather limited choices such as pumped hydropower and conventional batteries as viable methods for energy storage. The repertoire was expanded lately to include flywheels, thermal and flow batteries. Energy storage market grew by 243% in 2015 (ESA, 2016). According to Energy Storage Associa-tion (ESA), the energy storage market will expand to 40GW by 2022 from initial of 0.35GW of 2012–13 (ESA, 2016).
Three technologies are dominant: hydrogen, heat, battery technologies. In the case of hydrogen technology, hydrogen capacity is used for storing energy generat-ed by wind and solar sources. Today’s applications list industrial applications, fuel for fleets of commercial and private transportation systems.
1.7. DC or AC? Lost Battle Revisited
Since the late 19th century an alternating current (AC) became almost exclusive technology used by electric power utilities in distribution and supplying power to its customers when it won with direct current (DC) technology in the generation and transmission of electric power due to inventions by Tesla and Westinghouse. Thomas Edison lost his push for DC power back then, but renewable energy re-quirements and more importantly new developments in DC power technologies might bring back the lost dream. AC was the preferred choice for over the century for power distribution through transmission lines and systems due to its efficiencies and lower losses, but it may be changing with development of high-voltage direct current (HVDC) and DC micro-grids (Grose, 2016). The new DC technology al-lows for reduction of transmission costs and increased wattage capacity. It may address the vital shortcoming of current renewable energy technologies such as lack of developed power grid to transmit power from isolated locations, which is the case of solar power farms. Moreover, the renewable energy technologies crave for, it seems, DC power since they operate based on DC power such as solar power, and batteries as storage devices. Wind power can also gain due to costs reduction in power transmissions. Although, the needed DC-AC conversion stations would add complexity and costs but that will be mitigated by lower transmission costs. Few U.S. universities conduct research in the area of DC power: University of Pittsburgh – Cen-ter for Energy and Electric Power Systems, Florida InCen-ternational University, Virginia Tech among others (Grose, 2016).
The technology is already being applied on industrial scale: Switzerland’s ABB won a $300 million contract for 800-KVolt link to transmit 8GW power from wind and solar power units from Shanxi to Nanjing, China (ESA, 2016). Denmark uses HVDC to transmit electric power from its wind farms offshore. Last December, 2015, Canada just opened a 218-mile 500KV HVDC line connecting Edmonton to Calgary (ESA, 2016). In USA around 20 HVDC systems are being planned (Grose, 2016).
1.8. Impact of Renewable Energy
Technological breakthroughs, lowering the cost of installations, economic and po-litical expectations made renewable energies a viable offering in addressing green-house gasses emissions. But new technologies are not limited to only positive effects. The new technologies also create some issues which may affect the quality of electric power. It is reported that “stochastic, volatile and uncertain renewable energy
pow-er genpow-eration may disturb the safe and stable oppow-eration of the electric powpow-er grid,” including fluctuation and harmonic waves, which can cause power quality to de-crease (Singh, Khadkikar, Chandra & Varma, 2011). Mitigation technologies may include static and dynamic measures of power compensating and filtering devices. Consequently, power grid companies and consumers can experience some adverse effects, which might come as an inevitable cost to be accepted by society and ener-gy producers in order to address successfully the emission of harmful greenhouse gasses. On political front the initiatives, which aim at building transmission lines that transfer renewable energy (wind farms and hydroelectric plants) to the places where electricity is consumed, encounter an opposition from land owners, who point out possible interruption to farming operations, noise pollution, and other dangers (Cardwell, 2016). This is the nature of current stand-off with several plan-ned high-voltage transmission lines such as Rock Island through Iowa and Illinois, Grain Belt Express through Missouri. Public Service Commission in Missouri re-cently rejected the developer company request to grant permission for construction of such a transmission line putting process in a legal limbo (Cardwell, 2016). Issues such as eminent domain, public versus private rights come into forefront of a discourse among constituencies at various political and administrative levels.
Solution to delivering power where it’s needed will probably be found through combination of long-haul transmission lines of centralized power grid and devel-opment of decentralized systems based on much smaller and local renewable resources if meeting goals set up by Paris agreement (Paris, 2016) on climate con-trol are to be successful.
2. INTERNATIONAL LANDSCAPE: THE THIRD WORLD
IS FACING A DILEMMA
While developed industrial countries were burning fossil fuels since the begin-ning of industrial revolution which facilitated a significant qualitative improvement in the standard of living for their citizens, the third world countries only in last decades pursued more aggressive energy production as an essential part of overall development. To raise people out of poverty developing countries have to under-take a massive investment and construction of power plants, which in most cases are based on the cheapest fuel available, namely coal. Thus a dilemma: how to meet society’ needs for socio-economic development with electric power generation and at the same time to satisfy present day expectations if not demands for carbon emis-sion reduction? As Porter (2015) states “many third world countries feel that such a demand is unfair and hypocritical if not immoral to expect them to implement development with much smaller carbon footprint.” Conference on climate control in Paris in November, 2015 (Paris, 2016), provided guidelines for reducing carbon print to which majority of participating countries voluntarily agreed. Namely, the
participating 195 countries agreed to aim “to keep total temperature increase to 1.5 degree Celsius, since this would significantly reduce risks and the impacts of climate change,” using the best available techniques (Paris, 2016).
The third world countries feel that they are being unjustly pressured to under-take more dramatic measures to battle greenhouse gases emissions given their unde-veloped status. Alternative energy sources for electric energy production were after all, until recently, prohibitively more expensive than the traditional power plants based on fossil fuels of coal or gas.
In the case of India, Porter (Porter, 2015) states “the country is home of 30 per-cent of the world’s poorest – living on less than $1.90 a day. Out of 1.3 billion Indians, 304 million do not have access to electricity and 92 million have no access to safe drinking water.” So the country faces enormous challenges in trying to raise people out of poverty and at the same time to control the emissions of carbon diox-ide. There is already a vast amount of testimonies from citizens and observational evidence about poor quality of the air in major urban centers in Asia such a New Delhi in India or Beijing in China. According to the World Health Organization (WHO) 2014 report New Delhi was ranked the worst of urban centers where met-ropolitan area exposes 25 million people to air pollution on daily basis (Singh et al., 2016). Lack of air pollution measurement equipment did not allow to offi-cially confirm anecdotal evidence until recently. But steps are being taken to im-prove the dire situation. American Embassy in India started to monitor the air qual-ity and to publish data publically. Air filtration masks are being adopted but with prices of specialty filters priced around $35, well beyond reach for the majority of Indians, it is not a viable option (Geeta, 2016).
One cannot not notice that unlike India, China got a lucky break of proper time window of last two decades to undertake massive investments in infrastructure in-cluding electric power plants mostly based on coal, and to elevate millions of its citizens out poverty before reducing carbon footprint became so acute worldwide. India must provide growth of 5 to 8 percent annually for the foreseeable future, according to former India minister of the environment Jairam Ramesh, to meet its goals of socio-economic development (Porter, 2015). Even by taking into account nuclear and renewable energy resources, it is expected that more than half of the electricity will be based on burning of the coal. India, it is reported, in order to diver-sify its energy landscape, builds solar panel based electric power stations on its desert areas (Porter, 2015). But the role of renewable energy sources is still very low com-paring to traditional dependence on fossil fuels. It is suggested by World Bank to introduce carbon taxes, which would pay for an introduction of alternative renewable energy technologies (Porter, 2015). But expected an unrealistic time-frame of im-plementation and needed scale might make an endeavor not feasible in short term.
However, there are encouraging examples of introduction of carbon tax to tack-le the probtack-lem of carbon emissions, although this comes from British Columbia, Canada, where carbon tax was implemented in 2008 and is already giving measur-able results. Namely, the carbon tax, which rose from 10 Canadian dollars per ton
of carbon dioxide in 2008 to 30 dollars by 2012, reduced emissions by 5 to 15 per-cent according to study performed by economists at Duke University and the Uni-versity of Ottawa (Porter, 2016). One may claim that this solution would be very difficult to implement in third world countries on a meaningful scale since these countries face urgent needs for economic development often based on the cheapest energy resource which in many cases is coal. It is reported that in China, the largest carbon dioxide polluter, carbon dioxide emissions were reduced by 2.5 percent in 2015. China implemented in 2006 program of developing renewable energy re-sources with the goal of renewables contributing up to 15% of total energy con-sumption by 2020 (Huiro & Sen, 2015). There is already an installed wind power base comparable in size of generated wattage to that of the USA but wind power accounted for 2.5% and solar for .17% share of total China electric power generat-ed (Huiro & Sen, 2015).
The China’s National Bureau of Statistics reported that coal consumption dropped 3.7 percent in 2015 on top of 2.9 percent in 2014 (Wong, 2016). The drop, the observers note, has more to do with economic slow-down than government policies to curb the emissions. A slowdown in coal demand, as reported by China government, will result in expected lay-offs of 1.8 million workers employed by coal and steel industries. Due to already granted permits, China still plans to build around 200 new coal fired power plants. Consequently, if China’s government wants to reduce current carbon footprint, the development plans have to be modi-fied if not changed drastically. Given current industrialization plans, it is expected that carbon emission in China will only grow until 2025 if not 2030 before it will start to decline (Wong, 2016).
Huiro and Sen (Huiro & Sen, 2015) reported some negative sides of renewable energies affecting industry itself and power customers through degradation of pow-er quality due to voltage fluctuation and introduction of harmonic waves in China. Authors (Huiro & Sen, 2016) also looked at external impacts of renewable energies (wind power, solar PV power, biomass) such as economic (employment and social security), and environmental effects using linguistic ratings of decision making, entropy weighting method and fuzzy grey extended analysis methods. In their con-clusions to maximize positive outcomes based on eleven various indicators, which include costs, economic growth promotion, employment, pollution, water savings, vegetation damage, etc., policy makers should promote technologies based on solar PV, wind power, and biomass power in that specific order. Furthermore authors (Huiro & Sen, 2016) stressed that “rational, balanced development planning and support policies” have to be undertaken to provide for “healthy and sustainable development of the renewable energy sector.” This is an interesting study im-portance of which should be applicable elsewhere, well beyond China borders.
One may postulate that the only realistic solution to reduce greenhouse gas emissions in third world countries would be a transfer of technology and massive financial support from developed countries to assist India and other countries in
transition to energy landscape with much lower carbon print of renewable and sus-tainable energy resources.
3. ACADEMIA’S RESPONSE: NEW ENERGY ENGINEERING
PROGRAMS
Higher learning institutions responded to the technological advancements and increasing role of renewable and alternative energies in national power equation. New initiatives by federal government and local agencies in area of alternative and sustainable energies created the new opportunities and demand for graduates equipped with new skills. The Pennsylvania State University engineering program in Alternative Energy and Power Generation (AE&PG) program could be an ex-ample of such response. The program is “designed to help prepare graduates to enter the job market in the alternative and renewable energy sector, as well as the power generation industry,” and “the program’s goal is to create graduates who will have the background, knowledge and skills necessary to be successful in the contemporary power generation sector and have the ability to lead the industry toward a more environmentally friendly goal, using alternative and renewable en-ergy technologies” (PSU, 2016). This is a four year baccalaureate degree program, accredited by Accreditation Board for Engineering and Technology (ABET) (ABET, 2016), with total of 127 credits minimum, with intensive laboratory com-ponent focusing on alternative and renewable technologies. The author participated in development of the curriculum of the program in the past. For details, the reader is advised to visit academics programs web site of Pennsylvania State University – Hazleton campus (PSU, 2016; Academics, 2016). See the academic curriculum of AE&PG program in the Appendix for details.
ACKNOWLEDGEMENTS
Author would like to acknowledge the informative communications with Wes Grebski, Ph.D., chair of AE&PG program at Penn State University – Hazleton campus, regarding the academic curriculum of AE&PG program (Personal, 2015).
REFERENCES
ABET (2016), available at: www.abet.org (accessed April 2, 2016).
Academics (2016), available at: http://www.hn.psu.edu/Academics/Advising/32270.htm (accessed March 22, 2016).
AWEA (2016), available at: http://www.awea.org/3q2015. American Wind Energy Asso-ciation (accessed April 27, 2016).
EIA (2016), available at: www.eia.gov (accessed April 28, 2016). Energy (2016), available at: www.energy.gov (accessed March 28, 2016). ESA (2016), available at: www.esa.org (accessed March 24, 2016).
Geeta Anand (2016), As Air Worsens, New Delhi Turns to Masks. The Flashier the Better. The New York Times. Section A4. March 2.
Grose T.K. (2016), Power Play. Prism. ASEE Publication. February, pp. 26–31.
Huiro Z. & Sen G. (2015), External Benefit Evaluation of Renewable Energy Power in China for Sustainability, Sustainability, No. 7, pp. 4783–4805, DOI:10.3390/su7054783. McKay T. (2016), Denmark Sets Another World Record in Wind Energy Production,
available at: http://news.yahoo.com/denmark-sets-another-world-record-212330-823.hhtml.Jan. 17.
Paris (2016), available at: http://ec.europa.eu/clima/policies/international/negotiations/pa-ris/index_en.htm (accessed March 23, 2016).
Personal (2015), Personal Communication on AE&PG curriculum.
Porter E. (2015), India, Facing Climate Change, also Desperately Needs More Energy. The New York Times. Business Section. B1, B7. Nov. 11.
Porter E. (2016), British Columbia’s Carbon Tax Yields Real-World Lessons. The New York Times. Business Section. B1,B9. March 2.
PSU (2016), available at: www.hn.psu.edu (accessed March 25, 2016).
Ragnarsson A. (2015), Geothermal Development in Iceland 2010-2014. Proceedings World Geothermal Congress 2015. Melbourne, Australia. April, pp. 19–25.
Renewable Energy World (2016), available at: vwww.renewableenergyworld.com. (accessed March 15, 2016).
SEIA (2016), availabale at: www.seia.org (accessed April 5, 2016).
Singh M., V. Khadkikar, A. Chandra & R.K. Varma (2011), Grid interconnection of rene-wable energy sources at the distribution level with power-quality improvement features. IEEE Trans. Power Deliv. No. 26, pp. 307–315.
Tesla (2016), available at: www.teslasociety.com. (accessed April 27, 2016).
Wong E. (2016), In a Hopeful Sign on Climate Change, China May Have Reached Peak Coal Use. The New York Times. A5. March 3.
World-Nuclear (2016), available at: www.world-nuclear.org. (accessed March 22, 2016).
BIOGRAPHICAL NOTES
Andrzej J. Gapinski is the Associate Professor of Engineering at The Pennsyl-vania State University, PennsylPennsyl-vania, USA. Dr. A. Gapinski received his Ph.D. in Electrical Engineering from Texas Tech University, Lubbock, Texas, USA in 1988. He obtained his Master Degree in Electronics, Institute of Technical Cybernetics, Wroclaw University of Technology, Wroclaw, Poland in 1978. His research interests are in control & system theory, information science and technology, manufacturing processes and pedagogy. He has over 50 refereed publications in journals and various conference proceedings. He consults for industrial and manufacturing firms in the area of industrial control and manufacturing processes.
APPENDIX
Recommended Academic Plan for Bachelor of Science in General Engineering, Alternative Energy and Power Generation Track Penn State Hazleton / Effective Fall 2010 BS GE (127 credits)
SEMESTER 1
COURSE CREDITS
MATH 140 - Calculus I (GQ) 4.0
CHEM 110 - Chemical Principles (GN) 3.0
CHEM 111 - Experimental Principles 1.0
EDSGN 100 - Engineering Design 3.0
ENGL 015 - Rhetoric & Composition (GWS) 3.0
PSU 008 - First Year Seminar 1.0
TOTAL CREDITS 15.0 15.0
SEMESTER 2
COURSE CREDITS
MATH 141 - Calculus II (GQ) 4.0
PHYS 211 - Mechanics (GN) 4.0
CHEM 112 - Chemical Principles (GN) 3.0
CHEM 113 - Experimental Chemistry 1.0
CAS 100 A/B - Effective Speech (GWS) 3.0
ECON 102 or 104 - Micro or Macro Economics (GS) 3.0
TOTAL CREDITS 18.0 18.0
SEMESTER 3
COURSE CREDITS
MATH 231 - Calculus of Several Variables 2.0
PHYS 212 - Electricity & Magnetism 4.0
E MCH 211 - Statics 3.0
GTE General Tech Elective 2.0 - 4.0
CMPSC 201 - Programming in C++ 3.0
TOTAL CREDITS 14-16 14.0 - 16.0
SEMESTER 4
COURSE CREDITS
MATH 251 - Ordinary Diff. Equations 4.0
Arts, Humanities or Social Science (GA, GH, or GS) 3.0
E E 210 - Circuits & Devices 4.0
M E 300 or EME 301 Thermodynamics 3.0
E MCH 213 - Strength of Materials 3.0
SEMESTER 5
COURSE CREDITS
E E 314 - Signals & Circuits II 3.0
EME 303 - Fluid Mechanics in Energy 3.0
M E 345 - Instrumentation, Measurements & Statistics 4.0
GTE General Tech Elective 2.0
ENGL 202C - Technical Writing (GWS) 3.0
Health & Physical Activity (GHA) 1.5
TOTAL CREDITS 16.5 16.5
SEMESTER 6
COURSE CREDITS
EGEE 302 - Principles of Energy Engineering 3.0
ENGR 350 - Computational Modeling Methods 3.0
Arts, Humanities, or Social Science (GA, GH, or GS) 3.0
NUC E 401 - Introduction to Nuclear Engr. 3.0
PHYS 214 - Waves & Quantum Physics 2.0
Health & Physical Activity (GHA) 1.5
TOTAL CREDITS 15.5 15.5
SEMESTER 7
COURSE CREDITS
E E 485 - Energy Systems and Conversion 3.0
EGEE 437 - Fundamentals of Renewable Energy 3.0
EGEE 441 - Electrochemical Energy Conversion 3.0
ENGR 490W - Senior Design I 1.0
EGEE 438 - Sustainable Energy Options 3.0
Arts, Humanities, or Social Science (GA, GH, or GS) 3.0
TOTAL CREDITS 16.0 16.0
SEMESTER 8
COURSE CREDITS
E E 488 - Power System Analysis I 3.0
EGEE 420 - Hydrogen and Fuel Cells 3.0
ENGR 491W - Senior Design II 3.0
Arts, Humanities, or Social Science (GA, GH, GS) 3.0
Arts, Humanities, or Social Science (GA, GH, GS) 3.0
TOTAL CREDITS 15.0 15.0