TRENDS
in
Sport Sciences
2016; 2(23): 89-94 ISSN 2299-9590
What is already known on this topic?
The inner structure of numerous sports activities has been well described. On the contrary there is little data related to the bioelectrical activity of the muscles involved in the luge start. This limits the practical ability to train the most significant muscles that determine the success of the luge start.
The Jerzy Kukuczka Academy of Physical Education in Katowice, Department of Sports Theory and Practice, Katowice, Poland
Received: 12 January 2016 Accepted: 20 June 2016
Corresponding author: a.golas@awf.katowice.pl
ARTUR GOŁAŚ, MIŁOSZ DROZD, MICHAŁ KRZYSZTOFIK, KATARZYNA STROŃSKA, PAULINA BOJACZ, MARCIN ŻAK, KATARZYNA PAJERSKA
Changes in the internal movement structure during the push
and paddle phases in Olympic national team lugers
Abstract
Introduction. Luge is a winter Olympic sport. The level of performance in luge depends on the cumulative time of runs (typically two) performed on the track. The fastest times of the best male lugers on the Königssee luge track in Germany are around 49 seconds, with the speeds reaching 140 km per hour.
Aim of Study. The aim of the present study was to examine the pattern of internal movement structure of the push and paddle phases of the luge start in a group of Polish national elite lugers, with regard to the speed at which these motor tasks are performed. Material and Methods. The study examined the performance of six male members of the Polish National Luge Team. The study participants were randomized. The study was carried out on the Königssee luge track in Germany. The lugers’ motor activity was measured in six muscles: anterior deltoid (AD), biceps brachii (BB), triceps brachii (TB), latisimuss dorsi (LD), flexor carpi ulnaris (FCU), and trapezius (T). Results. The repeated measures ANOVA for peak muscle activity between two speeds of the push phase revealed statistically significant intragroup differences for the TB (F = 21.232; p = 0.001) and LD (F = 23.412; p = 0.001) muscles. The paddle phase revealed statistically significant intragroup differences for the LD (F = 34.121; p = 0.001), T (F = 22.111; p = 0.001) and TB (F = 19.211; p = 0.001). Conclusions. The results of the study show that a more effective use of the latisimuss dorsi, triceps brachii and trapezius muscles substantially improves the speed of the luge start. KEYWORDS: muscle activity, internal structure, activity index, luge.
Introduction
L
uge is a winter Olympic sport in which athletes compete on artificial or natural tracks in men’s and women’s categories, both singles and doubles. The performance of this sport depends on the cumulative time of runs performed on the track. Two runs are typically performed in a competition. Fastest times of the best lugers on the Königssee luge track are around 49 seconds for men, with lugers reaching speeds of 140 km per hour. One of the main determinants of success in luge is the start consisting of the push and paddle stages. The level of performance of this technical element depends on lugers’ muscular strength manifested by the activity of several muscle groups [1, 2]. A tool that may contribute to the understanding of the effects of exercise order on strength training is electromyography (EMG). This method allows for verification of whether the pattern of activation in different exercises is altered when a motortask is performed with a different engagement level and in different exercise order [3, 4, 5, 6].
There is no data in literature about the internal movement structure in luge. This is due to the very difficult conditions of measurements on the luge track and the low number of such facilities. Evaluation of bioelectrical muscle activity provides information about causes of movement, which contributes to the understanding of their effects. This helps collect information about muscle coordination patterns generated by the nervous system. Proper patterns of combined use of specific muscle groups represent the basis for appropriate movements. Training loads used by athletes have to be adjusted to the expected adaptations. A specific starting pattern in lugers affects the relationships between the strengths of individual muscle groups. Interesting data can be obtained from evaluations of muscle strength in terms of muscle force topography, i.e. contribution of individual muscle groups [7, 8, 9]. For example, a comparison of elite athletes practicing the same sport can help estimate the differences between the contributions of muscle force to the maximum force. If the results indicate that the contribution of a muscle group should be as high as possible and that an athlete shows significantly lower levels of strength in this muscle group compared to other athletes, such data can be used for planning training programs to improve the level of this ability. The increase in muscle load is followed by a greater recruitment of motor units and a higher excitation frequency to achieve the necessary contraction force [10]. Based on this theory, it seems justified to compare the activity of muscles engaged in the same motor task performed at a medium and maximal speed. The difference in the activities can reflect the level of engagement of muscles used to perform a particular motor task.
It is essential in both push and paddle phases to utilize the sensorimotor control by using the sequence of muscle work in the stretch-shortening cycle (SSC). Performing an exercise based on the SSC allows for the utilization of elastic energy accumulated in muscles and non-contracting tissues (such as tendons and fascia) following muscle stretching [10, 11]. Considering movement efficiency, its most important aspect includes a very short time (under 200 ms) between the eccentric and concentric phases of the SSC cycle [12]. The muscle activity pattern used in this cycle substantially determines the method of performing a motor task. Using the current knowledge, the main aim of the present study was to analyse the pattern of internal movement structure for the motions of push and paddle in a group
of national elite lugers, depending on the speed at which these motor tasks are performed (1/2 max PES and max PES).
Material and Methods
Participants
The study sample comprised six male athletes from the Polish National Luge Team. The participants were randomized (age 26 ± 1.7 years, body mass 61 ± 5.9 kg, body height 176 ± 0.07 cm), and they did not perform any extra resistance exercises for 72 hours prior to the test. All participants were informed verbally and in writing about the procedures and possible risks involved in the tests, and they provided their written consent to participate in the study. The study received the approval of the Bioethics Committee at the Academy of Physical Education in Katowice, Poland.
Procedures
The study was carried out on the Königssee luge track in Germany. It consisted of two parts: the warm-up and the main session. The warm-up session involved a standardized procedure of five minutes of easy jogging and dynamic stretching exercises for the upper and lower limbs. The main session comprised two runs on the luge track. During the main session, the participants performed two starts at a speed consistent with the scale of perceived exertion (0 = no effort; 10 = maximum effort; PES): the first start with the intensity perceived as 5 out of 10 points, and the second perceived as 10 out of 10 points (maximum intensity) chosen individually by each participant. A five-minute rest was taken between the trials. During the maximum effort trial, the participants were verbally motivated by the coach. Measurements
The eight-channel Noraxon TeleMyo 2400 system (Noraxon USA Inc., Scottsdale, AZ; 1500Hz) was used for recording and analysis of muscle biopotentials. Activity was measured for six muscles: anterior deltoid (AD), biceps brachii (BB), triceps brachii (TB), latisimuss dorsi (LD), flexor carpi ulnaris (FCU) and trapezius (T). The choice of muscles was made after a consultation with the coaches of the National Luge Team, based on the literature regarding muscle work of the shoulder girdle during the luge start [13, 14]. Before placing the gel-coated self-adhesive electrodes (Dri-Stick Silver circular sEMG Electrodes AE-131, NeuroDyne Medical, USA), the lugers’ skin was shaved, abraded and washed with alcohol. The electrodes (11 mm
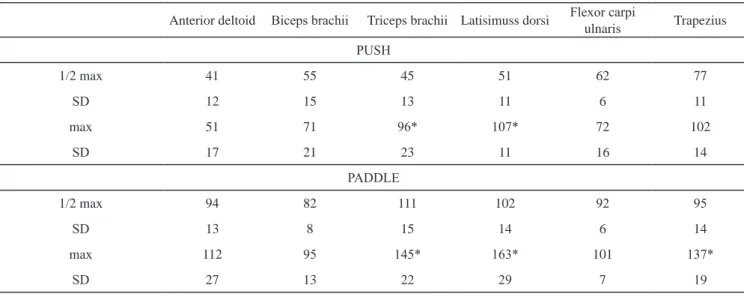
Table 1. Peak muscle activity during the pull and paddle phases in elite lugers of the Polish national Olympic team
Anterior deltoid Biceps brachii Triceps brachii Latisimuss dorsi Flexor carpi
ulnaris Trapezius PUSH 1/2 max 41 55 45 51 62 77 SD 12 15 13 11 6 11 max 51 71 96* 107* 72 102 SD 17 21 23 11 16 14 PADDLE 1/2 max 94 82 111 102 92 95 SD 13 8 15 14 6 14 max 112 95 145* 163* 101 137* SD 27 13 22 29 7 19 *significant at p < 0.05
contact diameter, 2 cm center-to-center distance) were placed along the presumed direction of the underlying muscle fiber, according to the recommendations by SENIAM [15]. The EMG signals were sampled at a rate of 1000 Hz, and they were band pass filtered with a cut off frequency of 8 Hz and 450 Hz, after which the root-mean-square (RMS) was calculated. All the electrodes were located on the right side of the participant’s body, regardless of whether this was the dominant side. The grounding electrode was placed on the connection with the triceps brachii muscle. Video recording was used for identification of the beginning and the end of the movement and distinction between the push and paddle phases. The push phase started from the motionless position while holding the start handles, followed by maximal stretching caused by moving the luge to the back until losing contact of the hands with the handles installed on the track. The paddle phase started from moving the arms forward and ended after the hands were lifted from the ice after the last paddle was completed. During a start, each participant was asked to perform four paddles.
After completion of the tests, two five-second tests of static exercise were performed in order to normalize electromyographic records, according to SENIAM procedure [15, 16].
Statistical analysis
Normality of distribution was verified using the Shapiro-Wilk test. Verification of the differences between the activity of studied muscles and speed was carried
out using the repeated measures ANOVA analysis of variance. Fixed-base indices were calculated to evaluate the dynamics of variability of muscle activity [17] during the push and paddle phases.
Results
The RMS values were expressed as peak ± SD percentage of MVC (Table 1). The mean 10 m start time for the 1/2 max speed was 3.1-3.5 s, with the best time of 2.85-2.97 s.
The repeated measures ANOVA for peak muscle activity between two speeds of the push phase (1/2 max PES and max PES) revealed statistically significant intragroup differences for the TB (F = 21.232; p = 0.001) and LD (F = 23.412; p = 0.001) muscles.
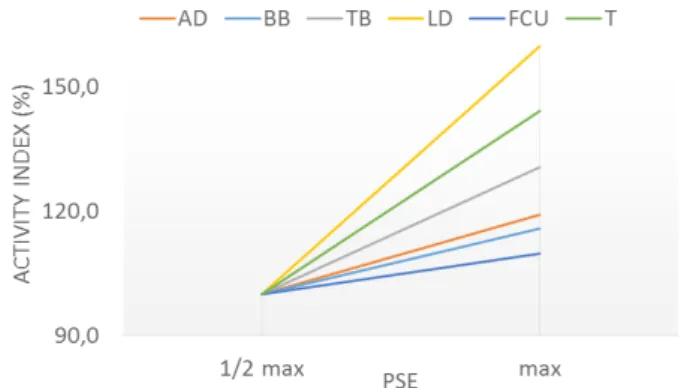
The repeated measures ANOVA for peak muscle activity between two speeds of the paddle phase (1/2 max PES and max PES) revealed statistically significant intragroup differences for the LD (F = 34.121; p = 0.001), T(F = 22.111; p = 0.001) and TB (F = 19.211; p = 0.001). Fixed-base indices for peak muscle activity for the speeds of the push and paddle phases are presented in Figures 1 and 2.
Discussion
Previous studies have found that the internal structure of movement activity changes depends on the external load [18, 19] and conditions in which a movement task is performed [20, 21].
None of the muscles reached a peak activity when the movement was performed at 50% of maximum intensity
(1/2max PES). This suggests that a specific pattern of muscle recruitment is maintained at a different intensity. However, the increase in speed (max PES) causes a significant increase in the activity of individual muscles, demonstrating their main propulsive function in performing the luge start.
During the pushing motion, both the latissimus dorsi and triceps brachii muscles increase their activity significantly (by 113% and 109.8%, respectively) through the increase in the speed of performing this phase (PES), which indicates the main propulsive abilities during this motion. The values for the trapezius muscle are at the boundary of significance; however, due to its substantial contribution to the activities with lower intensity, the increase was not that high at the maximal speed. For the paddling motion, the muscles which significantly increase their activity are latissimus dorsi, trapezius and triceps brachii (by 59.8%, 44% and 30%, respectively) through the increase in the speed of performing this phase (from 1/2 max. PES to max PES), which reflects its significant contribution to the increase in the starting speed. Changes in muscle activity with respect to various loads have been documented by a number of publications. However, no studies have provided insight into the muscle activity for different motion speeds. In literature, the increase in load (e.g. weight, speed, and rate) leads to modifications of muscle activity patterns during performing various motor tasks. Changes in muscle activity reflect how the muscle forces act, and it is the main cause (apart from gravitational forces) of movement of the lower limbs or sports equipment [19, 22]. For example, a study on the shoulder girdle demonstrated that different parts of muscles are activated in all shoulder movements, with one part that acts as a source (driving force) of
propulsion and the other engaged in stabilization of the humerus on the articular facet the acetabulum [23]. This was also demonstrated by Król et al. [24] who examined the pectoralis major muscle activity. The same approach should be used for the analysis of muscle work in athletic activities. According to McCaw and Friday [25], the difference in activity of the muscles of the shoulder girdle while comparing work with free weights and using exercise machines can be attributed to the increased stiffness in the shoulder joint, which eliminates the need for using the anterior and medial part of the deltoid muscle against the supination and adduction of the humerus [26, 27]. The change in the external load proposed by the authors of this study, resulting from the changes in application of the motion speed substantially affects the changes in the activity patterns and allows for the emphasis on the muscles driving the motor task. In this light, the EMG procedure used in the study represents a somehow innovative approach, but it is consistent with all the reasoning tendencies for this measurement methodology [28, 29]. The strong point of the present study is the participants’ high level of performance. The data obtained from these athletes comprise an appropriate material for examination of the contribution of individual muscle groups to the luge start. Furthermore, the location of the study (the Königssee luge track) is a venue where such examinations have not been conducted to date. Since no previous studies have analysed the internal movement structure in luge, the obtained data concerning the contribution of individual muscle groups to maximal force generation during the start constitutes novel and valuable research material.
Methodological limitations of the study include the lack of possibilities for evaluation of the external structure
Figure 1. Fixed-base indices for peak muscle activity (AD,
BB, TB, LD, FCU, T) during the push phase for 1/2 max PES and max PES
Figure 2. Fixed-base indices for peak muscle activity (AD,
BB, TB, LD, FCU, T) during the paddle phase for 1/2 max PES and max PES
of the movement (forces and torque) and the small size of the study group, which substantially reduces the opportunities for interpretation and generalization of results. The small size of the group was limited by the fact that the study covered the entire Polish National Luge Team, which in fact comprises only six competitors. A comparison of these results with other national teams (e.g. the German national team) and the correlation the internal structure (analysis of muscle activity) with the external structure (accelerations and velocity as well as movement structure) will substantially enhance the research potential in luge.
Practical implications
Determination of the dominant muscles which allow for the increase in speed during the start performed by elite lugers represents a valuable material that can be used in coaching practice. The results of this study show that the more effective use of the latisimuss dorsi, triceps brachii and trapezius muscles substantially improves the speed of the start in luge. With the methodology adopted in the study, individual measurements of activity will allow for determination of the most propulsive muscles in luge. The results obtained after consultations with coaches were used during the planning and development of muscle strength programs for the Polish National Luge team, whose outcome will be continuously verified.
The research project was approved by the Bioethics Committee of the Academy of Physical Education in Katowice.
Acknowledgements
The author’s research was funded by a Polish Ministry of Science and Higher Education grant (NRSA3 03953 and NRSA4 040 54).
References
1. McBride JM, Triplett-McBride T, Davie A, et al. A comparison of strength and power characteristics between power lifters, Olympic lifters and sprinters. J Strength Cond Res. 1999; 13: 58-66.
2. Mikolajec K, Maszczyk A, Zajac T. Game indicators determining sports performance in the NBA. J Hum Kinet. 2013; 37: 145-151.
3. Butler HL, Hubley-Kozey CL, Kozey JW. Changes in electromyographic activity of trunk muscles within the sub-acute phase for individuals deemed recovered from a low back injury. J Electromyogr Kines. 2013; 23: 369-377. 4. Van Damme BBL, Stevens VK, Van Tiggelen DE, et
al. Velocity of isokinetic trunk exercises influences back muscle recruitment patterns in healthy subjects. J Electromyogr Kines. 2013; 23: 378-386.
5. Stanula A, Roczniok R, Maszczyk A, et al. The role of aerobic capacity in high-intensity intermittent efforts on ice-hockey. Biol Sport. 2014; 31: 193-199.
6. Zajac A, Poprzecki S, Maszczyk A, et al. The effects of a ketogenic diet on exercise metabolism and physical performance in off-road cyclists. Nutrients. 2014; 6(7): 2493-2508.
7. Sotiropoulos K, Smilios I, Christou M, et al. Effects of warm-up on vertical jump performance and muscle electrical activity using half-squats at low and moderate intensity. J Sports Sci Med. 2010; 9: 326-331.
8. Mikolajec K, Waskiewicz Z, Maszczyk A, et al. Effects of stretching and strength exercises on speed and power abilities in male basketball players. Isokinetics Exer Sci. 2012; 20(1): 61-69.
9. Qi L, Wakeling J, Grange S, Ferguson-Pell M. Changes in surface electromyography signals and kinetics associated with progression of fatigue at two speeds during wheelchair propulsion. J Rehabil Res Dev. 2012; 49: 23-34.
10. Lagally KM, McCaw T, Young GT, et al. Ratings of perceived exertion and muscle activity during the bench press exercise in recreational and novice lifters. J Strength Cond Res. 2004; 18: 359-364.
11. Cronin JB, McNair PJ, Marshall RN. Magnitude and decay of stretch-induced enhancement of power output. Eur J Appl Physiol. 2001; 84: 575-581.
12. Knudson D. Fundamentals of biomechanics. Chico: Springer; 2007.
What this study adds?
The analysis of the inner structure of movement during the luge start at different speeds, allows to exclude 3 muscle groups that show the greatest activity during the start.
The results obtained in the study show that the more effective use of the latisimuss dorsi, triceps brachii and trapezius muscles substantially improves the speed of the start in the luge.
To optimize resistance training in most sport disciplines it is necessary to determine the internal pattern of muscular activity in a particular movement and to determine the inter muscle coordination involved in that activity (technique). The improvement of strength and power of the muscle groups most involved in the luge start or the application of complex training with the activation of these muscles may improve the speed of the luge start, and as a consequence the whole performance in this sport discipline.
13. Beach TAC, Howarth SJ, Callaghan JP. Muscular contribution to low-back loading and stiffness during standard and suspended push-ups. Hum Mov Sci. 2008; 27: 457-472.
14. Youdas JW, Budach BD, Ellerbusch JV, et al. Comparison of muscle-activation patterns during the conventional push-up and Perfect Pushup™ exercises. J Strength Cond Res. 2010; 24(12): 3352-3362.
15. Hermens H, Freriks B, Disselhorst-Klug C, et al. Development of recommendations for SEMG sensors and sensor placement procedures. J Electromyogr Kinesiol. 2000; 10(5): 361-374.
16. Saeterbakken AH, Fimland MS. Electromyographic activity and 6RM strength in bench press on stable and unstable surfaces. J Strength Cond Res. 2013; 27(4): 1101-1107.
17. Maszczyk A, Gołaś A, Czuba M, et al. Emg analysis and modelling of flat bench press using artificial neural networks. SAJR SPER. 2016; 38(1): 91-103.
18. Wahl MJ, Behm DG. Not all instability training devices enhance muscle activation in highly resistance-trained individuals. J Strength Cond Res. 2008; 22(4): 1360-1370. 19. Snarr RL, Esco MR, Witte EV, et al. Electromyographic
activity of rectus abdominis during a suspension push-up compared to traditional exercises. J Exer Phys. (online), 2013; 16(3): 1-8.
20. Marshall PWM, Murphy BA. Increased deltoid and abdominal muscle activity during Swiss ball bench press. J Strength Cond Res. 2006; 20(4): 745-750.
21. Anderson GS, Gaetz M, Holzmann M, et al. Comparison of EMG activity during stable and unstable push-up protocols. Euro J Sport Sci. 2011; 13(1): 42-48.
22. Magiera A, Roczniok R, Maszczyk A. The structure of performance of a sport rock climber. J Hum Kinet. 2013; 36: 107-117.
23. Baechle TR, Earle RW, Wathen D. Resistance training. In: Baechle TR, Earle RW, eds., Essentials of strength training and conditioning. Champaign, IL: Human Kinetics; 2008; 381-412.
24. Król H, Golas A, Sobota G. Complex analysis of movement in evaluation of flat bench press performance. Acta Bioeng Biom. 2010; 12: 93-98.
25. McCaw ST, Friday JJ. A comparison of muscle activity between a free weight and machine bench press. J Strength Cond Res. 1994; 8(4): 259-264.
26. Requena B, Zabala M, Ribas J, Ereline J, Paasuke M, Gonzalez-Badillo JJ. Effect of post-tetanic potentiation of pectoralis and triceps muscles on bench press performance. J Strength Cond Res. 2005; 19: 622-627. 27. Welsch EA, Bird M, Mayhew JL. Electromyographic
activity of the pectoralis major and anterior deltoid muscles during three upper-body lifts. J Strength Cond Res. 2005; 19: 449-452.
28. Glass SC, Armstrong T. Electromyographical activity of the pectoralis muscle during incline and decline bench press. J Strength Cond Res. 1997; 11: 163-167.
29. Santana JC, Vera-Garcia FJ, McGill SM. A kinetic and electromyographic comparison of the standing cable press and bench press. J Strength Cond Res. 2007; 21: 1271-1279.