Received: 12 August 2017 Accepted: 23 May 2018
Corresponding author: msbokos@edu.med.uoc.gr manosmpok@yahoo.gr
1 University of Crete, Faculty of Medicine, Department of Social Medicine, Heraklion, Greece
2 Specialist in Soccer Science, Soccer Fitness Coach, Soccer Performance Analyst, Olympiacos Football Club, Piraeus, Greece
EMMANOUIL SMPOKOS1, CHRISTOS MOURIKIS2, MANOLIS LINARDAKIS1
Seasonal changes of physical (motor) activities in professional
Greek football players
TRENDS
in
Sport Sciences
2018; 2(25): 99-107 ISSN 2299-9590 DOI: 10.23829/TSS.2018.25.2-6 IntroductionM
odern football is characterized by highly dynamic and acyclical game movements, interspersed with frequent bouts of high-speed movements and a number of high variability of actions, players’ motor and mental preparation as well as technical-tactical skills [2, 3]. Motion analysis of the match performance of elite football players is important in order to determine the necessary motor potential for players and define standards in modern football and the need for maintaining a high quality performance due to increased volume of matches (National & International matches) [20]. The practical value of such analyses is that well AbstractIntroduction. Football is an activity demanding of each of the energy systems. There have been many studies that have described the match activity profiles of top-level soccer players during an annual season, but few have try to evaluate seasonal- -variations month-by-month. Aim of Study. Τhis study aimed to investigate the seasonal variations in physical (motor) activities of elite professional Greek football players in official-matches of a national League and in European matches by separated a season (2016-2017) in eight-month-period. Material and Methods. Twenty- -seven players were recruited using Global-Positioning-System Technology (GPS). Total-distance (TD; km), high-speed-running (HSR; >19.8 km/h), very-high-intensity-speed-running (VHS; 19.8-25.2 km/h), maximal-sprinting (MS; >25.2 km/h), relative- -distance/time (D/T), high-metabolic-load-distance (HMLD; meters), dynamic-stress-load (DSL), and number of accelerations- -decelerations were measured. Multivariate analysis was performed. Results. Performance variations showed significant changes in all measurements (p < 0.05) noted from preparation phase (June- -August) to end-season with the exception of DSL and HMLD. The greater TD was recorded in January and the lowest during preparation phase (10.4 vs. 9.0 km, p < 0.001) while higher average levels in HSR were found in February’s matches in relation to November’s (654.6 vs. 389.9 meters, p < 0.001) or in MS (147.4 vs. 68.9 meters, p = 0.004). Increase from the preparation phase over the seven-time-periods was found in VHS (+15.6%; p-trend < 0.001) or in TD (+11.8%; p-trend = 0.012). However decreases were observed in D/T (–8.8%; p-trend < 0.001) or in number of sprint-runs (–3.4%; p-trend = 0.028). Significant interactions (p < 0.001) were also revealed between playing position and the time periods, in accelerations and decelerations measurements (η2 ≥ 0.20). Conclusions. Significant changes to most of the motor activities variations were observed between the preparation- -phase and mid-season (February-March). The analyses of physical loads on soccer players during official matches are highly useful for training individualization, as providing a tool
for effective planning in matches’ management, recording the loads on players and can therefore aid to avoid the risk for severe injuries.
chosen performance indicators can help coaches to identify good and bad performances of individuals of teams [12].
The capacity of elite soccer players to acquire and maintain a good level of physiological fitness through- -out the season is paramount [8]. Previous research has shown that in elite football players, aerobic fitness increases from preseason to midseason and then decreases while anaerobic power remains unchanged during the season whereas sprint performance deteriorate in the off-season and then improve as a result of preseason training [8, 9, 13].
Distance covered by players and teams in a game is one of the objective methods in assessing performance. Elite football players can cover from 10 to 13.5 km during a game, which depends on playing position and approximately 0.7 km of high-intensity activity, and can carry out more than 1200 acyclic or unforeseen changes in direction in various movement intensities. It has been found that midfielders covered the highest TD when compared with other playing positions, where forwards elicited the highest values for sprinting activity [2, 5, 12, 13].
Players’ speed skills are crucial for top football performance. Football players from top-level national leagues can cover sprinting distances from 152 to 446 m, depending on their position on the field, while players from the UEFA European League teams, from 167 to 345 m [1, 6, 12].
Mohr and colleagues (2003) reported that the match performance measures of Total Distance (TD) covered and distance covered through high-intensity running of the top-level players varied throughout the season and peaked at the end of the season [23]. Furthermore, studies have revealed the variation in physical performance during a single season and concluded that the high-intensity activity varied significantly throughout the course of that season [26]. Radziminski and colleagues (2010) revealed that the running speed at the anaerobic threshold was significantly greater at the end of the spring round of the season than at the beginning of the preparatory training period, but it hardly differs in comparison with the beginning of the autumn round [25].
It is very difficult for football players to maintain their motor skills at a relatively high level across an annual season including both the pre-season (preparation phase) and in-season phases using GPS monitoring methods [1]. Monitoring of performance metrics (e.g. TD, HSR, VHS, DSL) during official matches is an important part of the training process because sports coaches and
scientists can analyze the factors that affect individual athletic performance and provide useful information about the strengths and weakness of each player and try to improve or rebuild those fitness indicators.
Aim of Study
Τhe aim of the present study was to investigate the seasonal variations in physical (motor) activities of elite professional Greek football players in official matches of a national League and in European matches by separated a season in eight month period.
Material and Methods
Participants
The study covered all domestic national league games, national Cup and European league (qualification of Champions League or UEFA Europa league groups) of 45 matches in 2016-2017 season. Data were collected for one entire annual season spanning 49 weeks, from June 27th, 2016 to April 30th, 2017 (6 weeks of the preparation
phase and 43 weeks in-season). The team used for data collection competed in 3 official competitions across the season, included European competition, which often means that the team played 2 or 3 matches per week (included national Cup matches).
Twenty-seven elite outfield professional football players (6 central and 5 external defenders; 7 central and 6 external midfielders; 3 forwards; goalkeepers were excluded due to the different nature of their activity) belonging to a Greek team in a European Championship League (mean age: 26.6 years, body weight 74.1 kg, body height 180.9 cm, body mass index 22.6 kg∙m–2), participated in the present study with
302 total measurements were taken into account. Their weight was measured on calibrated digital scales (Seca 861; Seca, Hamburg, Germany) to the nearest 0.1 kg and height was measured to the nearest 0.5 cm with a wall mounted stadiometer (Seca 225; Seca), without shoes. Body mass index (BMI) was calculated as weight divided by height, squared (kg·m–2). Only those
players were selected who played the entire duration of a match during the season. The seasonal variations (Δ-changes) were investigated comparing the levels of physical (motor) activities of the players during eight periods (months) of the competitive season: start from preparation phase period of June-August (4 matches) and October (4 matches), November (3 matches), December (6 matches), January (7 matches), February (8 matches), March (6 matches) and April (7 matches). It is noted that in September there were no
measurements as official matches of the national league games were started in October. The study was approved by the institutional ethics board and written informed consent was obtained for each participant [29].
Match analysis data
Each match was monitored using a computerized semi- -automatic video match analysis image recognition system (data were supplied by Viper pod 2, STATSport, Belfast, UK). The data systematically analyzed using proprietary software to provide an interactive coaching and analysis tool that provided a comprehensive data on each individual [18]. Match data collection for this study was carried out at the football club’s official stadium and both home and away stadiums, respectively.
Each player’s physical activity, during each match, was monitored using portable global positioning system (GPS) units (Viper pod 2, STATSports, Belfast, UK). This device provides position velocity and distance data at 10 Hz. Each player wore a special adjustable neoprene harness which enables this device to be fitted to the upper part of his back (i.e. between the left and right scapula). All devices were activated 30 minutes before data collection to allow acquisition of satellite signals, and synchronize the GPS clock with the satellite’s atomic clock [21]. GPS data were downloaded after every match and analyzed using the respective software package (Viper PSA software, STATSport, Belfast, UK). In order to avoid inter-unit error, players wore the same GPS device for each game [7, 19].
Physical (motor) activity measurements
The players’ external load that were selected for analysis included total distance covered (TD; km), relative total distance: distance/time (meters/minutes) (D/T), and high speed categories were used: Very High Speed running (VHS; from 19.8 to 25.2 km/h) and Maximal Speed-Sprint (MS; >25.2 km/h) or High Speed Running (zone 5 + zone 6) (HSR; >19.8 km/h, in meters) [12, 19]. A sprint was defined as a running exercise lasting at least 1 sec at the speed of at least 25.2 km/h (>7 m/s). Acceleration activity was measured on the basis of the change in GPS speed data and was defined as a change in speed for a minimum period of 0.5 s with a maximum acceleration in the period at least 0.5 m × s–2. The acceleration was considered finished
when the player stopped accelerating. The classification of accelerations by zone is based on the maximum acceleration reached in the acceleration period. The same approach was used with regard to deceleration. The load and intensity measures were identified as total
number of accelerations or decelerations (>2 m·s–2) and
accelerations/min or decelerations/min, respectively. In addition, the “dynamic stress load” was calculated as the total of the weighted impacts. Impacts were weighted using convex-shaped function (approximately a cubic function), an approach similar to the one used in the speed intensity calculation, with the key concept being that an impact of 4 g is more than twice as hard on the body as an impact of 2 g. The weighted impacts were totaled and finally scaled to give more workable values expressed in arbitrary units (AU). The load and intensity measures were identified as Dynamic Stress Load (DSL) [3]. Both speed intensity and dynamic stress load were calculated automatically using a custom algorithm included in the proprietary software provided by the manufacturers (Viper Version 1.2, STATSports, Belfast, UK). High Metabolic Load Distance (HML; distance covered >25.5 W·kg–1) was used as measure of
movement intensity [16]. The HML distance measure combines the energy cost of all constant velocity running above 5.5 m·s–1 and acceleration and deceleration
activity over 2 m·s–2 during intermittent running [11,
24]. Players who didn’t get into HSR zones because of covering short, sharp distances were given credit in their HML score because the intensity of the work could be just great.
Statistical analysis
Data were analyzed using the SPSS software (IBM SPSS Statistics for Windows, Version 24.0. Armonk, NY: IBM Corp). Distributions of descriptive characteristics of the 27 professional football players were estimated. Age and body mass index were assessed according to players’ position with non-parametric Kruskal–Wallis test. Multivariate analysis of covariance (mancova) was performed to assess motor activity measurements by the eight periods of the season 2016-2017. Levene’s test was used for testing the equality of error variances). Age, BMI and players’ position were used as covariates. Furthermore, using two-way analysis of variance, motor activity measurements were also assessed according to interaction of players’ position with the eight periods, and their mean levels as well as the effect sizes (eta squared; η2) were also illustrated.
Results
A comprehensive overview of the studied population and its characteristics is given in Table 1. Participants were 27 elite Greek professional football players [mean age 26.6 years (±4.6), and BMI 22.6 kg × m–2 (±1.2)].
external defenders that covered all 45 matches of the 2016-2017 season and involved 159 measurements, 13 central and external midfielders involved with 115 measurements and 3 forwards with 28 measurements. The seasonal motor activities that were investigated were divided into eight periods (months) through the annual season including pre-season phase. Based upon the eight month periods, 21 measurements were undertaken during June-August preparation phase, 29 measurements in October, 23 in November, 42 in December, 51 in January, 54 in February, 39 in March and 43 in April. It is worth noticing to mention that in the age and body mass index that they were obtained at the beginning of the season 2016-2017, were not found any difference by the players’ position (p > 0.10). Table 2 outlines the mean levels of motor activities measurements across the seasonal period, as was divided in eight months period. Significant differences (Δ-changes) (p < 0.05) were observed in all measurements between time periods with the exception of DSL (p > 0.05). Moreover, the greater TD was recorded in January and the lowest during preparation phase (June-August) (10.4 vs. 9.0 km, respectively, p < 0.001)
while significantly higher average levels in HSR were found in February’s matches in relation to November’s (654.6 vs. 389.9 meters, respectively, p < 0.001) and in MS (147.4 vs. 68.9 meters, respectively, p = 0.004). Similarly, significantly higher mean levels in VHS were found in March’s matches in relation to November’s (509.7 vs. 320.9 meters, respectively, p < 0.001), in sprints (10.6 vs. 5.4, respectively, p = 0.003), and in accelerations (65.5 vs. 43.9, respectively, p < 0.001). Conversely, in November was recorded significantly higher average number of decelerations (p < 0.001). From the linear changes during the period, a significant positive difference from the preparation phase over the seven time periods was found in VHS close to +15.6% (p-trend < 0.001) or in TD by +11.8% (p-trend = 0.012). However a significant negative difference was observed during the period (eight months) in D/T by –8.8% (p-trend < 0.001) or in number of sprints by –3.4% (p-trend = 0.028). In the HML distance covered was recorded a significant positive difference during the period by + 9.8% (p-trend = 0.008).
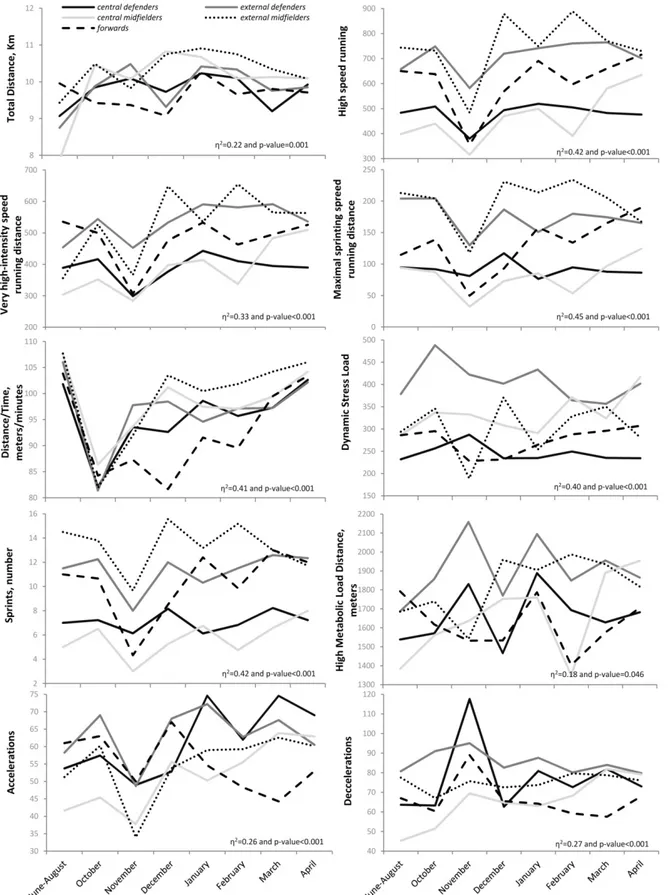
Figure 1 presents the interactions that may occur between the five different playing positions on the field with the Table 1. Characteristics of 27 Greek football players in the season of 2016-2017, participating in the current study
Mean SD Min Max
Age, years 26.6 4.6 17.9 35.9
Body Mass Index, kg∙m–2 22.6 1.2 20.9 25.9
Player position, n (measurements) central defenders 6 (90*)
external defenders 5 (69)
central midfielders 7 (62)
external midfielders 6 (53)
forwards 3 (28)
Seasonal period, n (measurements) June-August 12 (21)
October 17 (29) November 13 (23) December 20 (42) January 16 (51) February 20 (54) March 15 (39) April 17 (43)
Age and body mass index (measurements of body weight and height) were obtained at the beginning of the season 2016-2017 and were not different by the players’ position (Kruskal–Wallis tests, p > 0.10).
T
able 2.
Seasonal motor activities measurements of Greek football players in the season of 2016-2017
Seasonal period 2016-2017 (months)
June-A ugust October November December January February March April Δ-changes* measur ements
mean (stand. error)
% p-value p-trends T otal Distance, TD ( km ) 9.0 (0.2) 10.1 (0.2) 10.0 (0.2) 10.2 (0.2) 10.4 (0.1) 10.2 (0.1) 9.8 (0.2) 10.0 (0.2) +1 1.8 <0.001 0.012
High Speed Running, HSR (running speed >19.8 km/h, in meters
) 574.8 (46.4) 573.1 (39.5) 389.9 (44.4) 614.1 (33.0) 61 1.5 (30.0) 654.6 (29.0) 654.5 (34.1) 636.7 (32.6) +2.8 <0.001 0.001 V
ery high-intensity speed
running
distance,
VHS
(sprinting or speed 19.8- -25.2 km/h, in met
ers ) 400.7 (35.0) 443.7 (29.8) 320.9 (33.5) 473.3 (24.9) 490.1 (22.6) 506.9 (21.9) 509.7 (25.7) 498.0 (24.6) +15.6 <0.001 <0.001
Maximal sprinting speed running distance, MS (sprinting or speed >25.2 km/h, in meters
) 140.3 (16.6) 129.6 (14.1) 68.9 (15.9) 141.3 (1 1.8) 121.0 (10.7) 147.4 (10.3) 145.1 (12.2) 138.6 (1 1.6) –9.2 0.004 0.1 18 Distance/T ime, D/T (meters/minutes ) 105.0 (1.7) 83.5 (1.4) 93.3 (1.6) 98.0 (1.2) 96.4 (1.1) 96.6 (1.0) 99.0 (1.2) 103.8 (1.2) –8.8 <0.001 <0.001
Dynamic Stress Load, DSL (Arbitrary Units
) 288.0 (22.4) 329.4 (19.1) 300.2 (21.5) 310.3 (15.9) 303.7 (14.5) 310.9 (14.0) 312.6 (16.5) 331.5 (15.7) +9.0 0.764 0.31 1 Sprints (number) 9.4 (1.0) 9.2 (0.9) 5.4 (1.0) 9.7 (0.7) 8.7 (0.7) 10.0 (0.6) 10.6 (0.8) 10.0 (0.7) –3.4 0.003 0.028
High Metabolic Load Distance, HMLD
(meters ) 1610 (87) 1650 (74) 1744 (83) 1715 (62) 1880 (56) 1728 (54) 1821 (64) 1829 (61) +9.8 0.077 0.008 Accelerations > 2m/s 2 ( n ) 53.0 (3.5) 57.4 (3.0) 43.9 (3.4) 57.8 (2.5) 63.2 (2.3) 59.0 (2.2) 65.5 (2.6) 63.5 (2.5) +10.5 <0.001 <0.001 Decelerations > 2m/s 2 ( n ) 67.1 (4.6) 64.8 (3.9) 90.8 (4.4) 69.7 (3.2) 74.6 (3.0) 73.7 (2.9) 79.7 (3.4) 76.9 (3.2) +12.8 <0.001 0.053 * The Δ
-changes are referred to mean changes (in percent) of all measur
ements from the preparation phase of June-August.
Multivariate analysis of variance (Levene’
s test was used for testing the equality of error variances).
Age, body mass index (kg∙m
–2) and players’
Figure 1. Interaction effects of seasonal periods and player position on motor activities measurements of Greek football players in the season of 2016-2017
eight periods. Among others, a significant interaction (p < 0.001) was revealed from the combination of the playing position with the time periods, in MS (η2 = 0.45),
sprints (η2 = 0.42), HSR (η2 = 0.42) or in accelerations
(η2 = 0.26) and decelerations or TD (η2 = 0.27).
Discussion
The results of this study showed that top-class football players performed significantly lower mean level changes in most of the motor activities during the second quarter of the annual season (November) but higher average levels were observed during the fourth quarter of the season (February-March).
There are certain difficulties in making comparisons between studies on match analysis because in football, different analysis systems have been used (position of cameras or technology applied), different intensities have been measured (threshold velocities and criteria time 0.5-1.0 s, for activity classification), different magnitudes have been used to analyze the activity (time or distance), and the criteria to classify the positions of the players have differed across studies [4, 15, 23, 28]. Limited data are available on the between official matches motor activities variability’s by separating or splitting the whole season. This study provides unique data for the literature as it examines variability changes almost monthly compared to the preparation phase. Considering the available literature, the only comparable study that analyzed motor activities in seven consecutive rounds of matches was that of the 2014 world Cup in Brazil [10]. The emphasis during preparation phase or pre-season is on rebuilding of fitness parameters following the detraining that occurs during off-season [27]. In contrast to previous studies [22] the TD response observed in the present study was lower in preparation phase compared with the other periods and reflects the periodization of a football training programme. Indeed, lower training loads during the competitive season are deliberately administered to allow optimal recovery and for players to peak around official games, whereas higher training loads are used in the pre-season when physiological adaptation is key and competition not a priority. The higher TD covered at the beginning of the in-season (October) and after the Christmas’ break (January) may be due to the coaches’ still having some emphasis on physical conditioning as a continuation at the preseason phase. From the physiological and practical points of view, a greater aerobic capacity allows players not only to cover longer distance during a game but to perform more sprints, but also to develop better playing demands and maintain it for much longer time during the game
[3, 17]. This is clear confirmed by the results of the present study regarding the significant changes in TD covered and accelerations and decelerations between the periods. It is interesting that despite incremental fatigue observed in players in consecutive rounds of the 2014 World Cup tournament, a significant increase in TD was noted between the quarter-finals and the semi- -finals. As in our study this can maybe explained by the fact that this tournament stage is reached by players who are physically best prepared, resistant to fatigue and equipped with top-level football-specific skills [10]. Additionally, it appears that the physical demands during elite level games (e.g. UEFA Champions League or Europa League games) may be an indicator to the physical level of a team, as indicated by Rampinini and colleagues [26] who revealed that teams ranked within the bottom 5 Italian Serie A presented significantly greater TD covered than the top 5 teams. This implies that more successful teams exert less physical effort in competitive match play because of a higher tactical awareness and technical ability allowing higher ball possession [31].
From our analysis, it was clear that all high speed activities variables analyzed (HSR, VHS, and MS) demonstrated fall in November compared to that of Februarys’-March’s. However significant positive percentages changes from the preparation phase over the seven periods were found in HSR and VHS while negative significant change was observed for the MS variable, respectively. These differences in HSR and VHS variables may indicate the effect of a pre-season training period that the component of running speed (linear running speed, single and multiple direction changes) may not particularly stimulated during pre-season training sessions [31]. It can also be a result of the official matches played during in-season period that may enhance speed and acceleration as a result of the high-intensity nature of the match play [26]. Another possible explanation is the fact that in November the team was challenging consecutive matches for domestic league and cup as well as for European matches. Matches played at this frequency over a short period of time potentially results in residual fatigue and underperformance due to insufficient time of physical recovery [14]. This is clearly confirmed by the results of the 2014 World Cup in Brazil study that the high frequency of World Cup matches together with players’ load after their league season did not permitted complete recovery [10]. The total number of performed sprints is another parameter of maximal intensity activity performed by players during a football match [30, 32]. The kinematic analysis
of ten UEFA cup matches showed that the mean number of sprint runs performed by examined players amounted to 11.2 ± 5.3 sprint runs per match [1]. This is not similar to the findings of the present study who recorded a range between 9.4 to 10.7 sprints run per match and a significant negative difference (–3.2%) over the seven time periods. In the present study, sprint runs analyzed with regard to the entry in zone 5 >5.5 m/s (long duration sprint).
Updated seasonal information in physical (motor) activities on football players in official-matches is highly significant for sport practice. The collected data may have significant implications for conditioning of elite soccer players. Given that the authors observed distinct differences between the preparation-phase and mid-season (February-March) our data have obvious practical implications for specific training program design. The study may help sports practice for coaches and conditioning coaches by comparing these results with similar research conducted by peers.
When interpreting the current findings, a number of limitations should be considered. This study is reflective of one team only (albeit reflective of the top League team) and hence may not be representative of the customary official game demands of other domestic teams that may be influenced by different coaching or training philosophies. For example, as players of a lower standard of the league standing generally undergo higher load during match play, there is likely to be a greater total fatigue which determine the effectiveness of match performance. Furthermore it is prudent to note that these data do distinguish between specific playing positions. Future work may focus to address the possible variations of a single squat over multiple seasons. Finally it should be noted that the possibility of some injuries during the season could influence negatively some of the motor activities of the players.
Conclusions
In conclusion, this study investigated the changes in all types of tested motor skills by the top League team across during an annual season. Significant lower mean level changes were found in most of the motor activities during the second quarter of the annual season (November) while significantly higher average levels were observed during the fourth quarter of the season (February-March). The greater positive changes in motor activities that were observed between players during mid-season in association to match loads and their fatigue levels during matches could increase the risk of fatigue or injury. A primary goal of match-
-load monitoring should be to assist and inform coach/ manager decision making on player availability for training and next match readiness. Therefore, official match-analyses are helpful to develop a specific training program which mimics the physiological conditions imposed by the match.
References
1. Andrzejewski M, Chmura J, Pluta B, Strzelczyk R, Kasprzak A. Analysis of sprinting activities of professional soccer players. J Strength Cond Res. 2013 Aug; 27(8): 2134-2140. DOI: 10.1519/JSC.0b013e318279423e. 2. Bangsbo J. The physiology of soccer – with special
reference to intense intermittent exercise. Acta Physiol Scand Suppl. 1994; 619: 1-155.
3. Bangsbo J, Krustrup P. Physical demands and training of top-class soccer players. In: Reilly T, Korkusuz F, editors. Science and football VI. New York: Routledge; 2009. pp. 318-330.
4. Bangsbo J, Norregaard L, Thorso F. Activity profile of competition soccer. Can J Sport Sci. 1991 Jun; 16(2): 110-116.
5. Barros RM, Misuta MS, Menezes RP, Figueroa PJ, Moura FA, Cunha SA, et al. Analysis of the distances covered by first division brazilian soccer players obtained with an automatic tracking method. J Sports Sci Med. 2007; 6(2): 233-242.
6. Bradley PS, Sheldon W, Wooster B, Olsen P, Boanas P, Krustrup P. High-intensity running in English FA Premier League soccer matches. J Sports Sci. 2009 Jan 15; 27(2): 159-168. DOI: 10.1080/02640410802512775.
7. Buchheit M, Al Haddad H, Simpson BM, Palazzi D, Bourdon PC, Di Salvo V, et al. Monitoring accelerations with GPS in football: time to slow down? Int J Sports Physiol Perform. 2014 May; 9(3): 442-445. DOI: 10.1123/ijspp.2013-0187.
8. Caldwell BP, Peters DM. Seasonal variation in physiological fitness of a semiprofessional soccer team. J Strength Cond Res. 2009 Aug; 23(5): 1370-1377. DOI: 10.1519/JSC.0b013e3181a4e82f.
9. Casajus JA. Seasonal variation in fitness variables in professional soccer players. J Sports Med Phys Fitness. 2001 Dec; 41(4): 463-469.
10. Chmura P, Andrzejewski M, Konefal M, Mroczek D, Rokita A, Chmura J. Analysis of Motor Activities of Professional Soccer Players during the 2014 World Cup in Brazil. J Hum Kinet. 2017 Feb; 56: 187-195. DOI: 10.1515/hukin-2017-0036.
11. Coutts AJ, Kempton T, Sullivan C, Bilsborough J, Cordy J, Rampinini E. Metabolic power and energetic costs of professional Australian Football match-play. J Sci
Med Sport. 2015 Mar; 18(2): 219-224. DOI: 10.1016/j. jsams.2014.02.003.
12. Di Salvo V, Baron R, Tschan H, Calderon Montero FJ, Bachl N, Pigozzi F. Performance characteristics according to playing position in elite soccer. Int J Sports Med. 2007 Mar; 28(3): 222-227. DOI: 10.1055/s-2006-924294. 13. Dragijsky M, Maly T, Zahalka F, Kunzmann E, Hank M.
Seasonal Variation of Agility, Speed and Endurance Performance in Young Elite Soccer Players. Sports. 2017; 5(1): 12.
14. Dupont G, Nedelec M, McCall A, McCormack D, Berthoin S, Wisloff U. Effect of 2 soccer matches in a week on physical performance and injury rate. Am J Sports Med. 2010 Sep; 38(9): 1752-1758. DOI: 10.1177/0363546510361236.
15. Ekblom B. Applied physiology of soccer. Sports Med. 1986 Jan-Feb; 3(1): 50-60.
16. Gaudino P, Iaia FM, Strudwick AJ, Hawkins RD, Alberti G, Atkinson G, et al. Factors influencing perception of effort (session rating of perceived exertion) during elite soccer training. Int J Sports Physiol Perform. 2015 Oct; 10(7): 860-864. DOI: 10.1123/ijspp.2014-0518. 17. Gharbi Z, Dardouri W, Haj-Sassi R, Chamari K, Souissi N.
Aerobic and anaerobic determinants of repeated sprint ability in team sports athletes. Biol Sport. 2015 Sep; 32(3): 207-212. DOI: 10.5604/20831862.1150302. 18. Impellizzeri F, Sassi A, Rampinin E. Accuracy and
reliability of a commercial video-computerized, semi- -automatic, soccer match analysis system: preliminary results. In: Hoppeler H, Reilly T, Tsolakidis E, Gfeller L, Cologne K, editors. 11th Annual Conference of the European College of Sport Science. Lausanne, Switzerland: Sportverlag Strauss; 2006. pp. 319-320.
19. Jennings D, Cormack S, Coutts AJ, Boyd LJ, Aughey RJ. Variability of GPS units for measuring distance in team sport movements. Int J Sports Physiol Perform. 2010 Dec; 5(4): 565-569.
20. Konefal M, Chumura P, Kowalczuk E, Andrzejewski M, Chumura J. The impact of players’ motor skills on performance in top German Bundesliga teams. Trends in Sport Sci. 2015; 4(22): 185-190.
21. Maddison R, Ni Mhurchu C. Global positioning system: a new opportunity in physical activity measurement. Int J Behav Nutr Phys Act. 2009 Nov 4; 6: 73. DOI: 10.1186/1479-5868-6-73.
22. Malone JJ, Michele RD, Morgans R, Burgess D, Morton JP, Drust B. Seasonal Training-Load Quantification in Elite English Premier League Soccer Players. Int J Sports Physiol Perform. 2015; 10(4): 489-497. DOI: 10.1123/ ijspp.2014-0352.
23. Mohr M, Krustrup P, Bangsbo J. Match performance of high-standard soccer players with special reference to development of fatigue. J Sports Sci. 2003 Jul; 21(7): 519-528. DOI: 10.1080/0264041031000071182.
24. Osgnach C, Poser S, Bernardini R, Rinaldo R, di Prampero PE. Energy cost and metabolic power in elite soccer: a new match analysis approach. Med Sci Sports Exerc. 2010 Jan; 42(1): 170-178. DOI: 10.1249/MSS.0b013e3181ae5cfd. 25. Radziminski L, Rompa P, Dargiewicz R, Ignatiuk W,
Jastrzebski Z. An application of incremental running test results to train professional soccer players. Balt J Health Phys Act. 2010; 2(1): 67-74.
26. Rampinini E, Coutts AJ, Castagna C, Sassi R, Impellizzeri FM. Variation in top level soccer match performance. Int J Sports Med. 2007 Dec; 28(12): 1018-1024. DOI: 10.1055/s-2007-965158.
27. Reilly T. The training process. In: Reilly T, editor. The Science of Training – Soccer: A 537 Scientific Approach to Developing Strength, Speed and Endurance. London: Routledge; 2007. pp. 1-19.
28. Rienzi E, Drust B, Reilly T, Carter JE, Martin A. Investigation of anthropometric and work-rate profiles of elite South American international soccer players. J Sports Med Phys Fitness. 2000 Jun; 40(2): 162-169. 29. Smpokos E, Mourikis C, Theodorou A, Linardakis M.
Lower extremity strength ratios in professional Greek soccer players. A follow-up study during in-season. Arch Hell Med. 2017; 34(5): 682-689.
30. Tumilty D. Physiological characteristics of elite soccer players. Sports Med. 1993 Aug; 16(2): 80-96.
31. Vigne G, Dellal A, Gaudino C, Chamari K, Rogowski I, Alloatti G, et al. Physical outcome in a successful Italian Serie A soccer team over three consecutive seasons. J Strength Cond Res. 2013 May; 27(5): 1400-1406. DOI: 10.1519/JSC.0b013e3182679382.
32. Withers R, Maricic Z, Wasilewski S, Kelly L. Match analysis of Australian professional soccer players. J Hum Mov Stud. 1982; 8: 159-176.