TRENDS
in
Sport Sciences
2020; 27(4): 219-224 ISSN 2299-9590 DOI: 10.23829/TSS.2020.27.4-5 Received: 17 August 2020 Accepted: 26 November 2020Corresponding author: m_krawczyk@pwsztar.edu.pl
1 University of Applied Sciences, Faculty of Health Sciences, Tarnów, Poland
2 University of Physical Education, Institute of Sport, Department of Track and Field’s Sports, Kraków, Poland 3 Kletterverband Österreich, Austria
MARCIN KRAWCZYK1, MARIUSZ POCIECHA1, MARIUSZ OZIMEK2, PAWEŁ DRAGA3
The force, velocity, and power of the lower limbs
as determinants of speed climbing efficiency
Introduction
S
peed climbing is one of three sub-disciplines of sportsclimbing (speed or lead climbing, bouldering). It consists of the fastest possible climbing on a 15-meter-long standard route with a slight slope. The research so far has shown that in terms of motor preparation, the leading speed climbers are characterized by a higher level of strength and speed abilities in comparison to other climbers [4, 9, 16]. Sprinting specialization compared to other climbing specializations is different because high efficiency is primarily determined by the high efficiency of the lower limbs [9, 16]. Accordingly, lower limb tests were mostly carried out in studies focused on strength and speed abilities in speed climbing. The jumping tests were usually standing broad jump [9] and/or countermovement jump (CMJ) using the Optojump system (Microgate, Italy) [10, 11]. The maximal anaerobic power of the lower limbs was estimated based on jumping tests results, and Sayers et al.’s formula [19]. The results of these studies clearly show the correlation between explosive strength and the maximal anaerobic power of the lower limbs with the running time in the speed climbing [10]. However, the above mentioned tests are significantly different from the specificity of movement in speed climbing.
Ozimek et al. [14] have attempted to develop a measurement method that allows the evaluation of
Abstract
Introduction. Speed climbing is different from the other climbing specializations because high efficiency in this competition is primarily determined by the high efficiency of lower limbs. The assessment of the magnitude of the relations between the level of force, velocity, and power of a single jump with the level of the specific-climbing power and time of a climbing run may have a high informative value. Material and Methods.
Participants in the research were men (n = 8), taking part in the Czech Republic’s Open formula speed climbing championships. Motor performance was measured using the countermovement jump (CMJ). The measurements were made with the use of My Jump application. The analyses assessed power, force, and velocity during a CMJ jump. The Margaria–Kalamen formula was used to estimate the special climbing power. Results. The data indicate that velocity, power, the height of the CMJ jump, and the special climbing power closely correlate with climbing time. Statistically significant correlations were noted between the special climbing power and velocity, power, and height of the CMJ. Conclusions.
In speed climbing running time and climbing power is probably more strongly correlated with velocity, than the force component. My Jump app can become a worthy diagnostic tool, being able to provide information about kinetic parameters, which is highly valuable for speed climbing coaches.
KEYWORDS: explosive capacities, lower limbs, Samozino et al. method, mechanical characteristics.
climbing movements in a unit of measurement other than the second. They proposed the Margaria–Kalamen formula (body mass × Earth’s acceleration × distance/ time) and video analysis as a useful tool to calculate the mean power of the climbing race [14]. Video analysis was also used to assess the power of the Chinese national team members’ during the climbing race (body mass × Earth’s acceleration × race speed). Based on these reports, one can talk about specific power in speed climbing. These studies show the possibility of evaluating explosive strength and anaerobic power in speed climbing based on jumping tests or video analysis. It should be emphasized that none of these methods provides information on force-velocity characteristics among speed climbers.
In light of those considerations, it seems that My Jump app could be used by speed climbing coaches to get information that is useful in practical terms [1]. This application provides easy low-cost measurements. Moreover, the My Jump app is used as a research tool in different athlete populations [3, 5, 7]. This device provides an accurate and reliable assessment of the level of muscles’ mechanical parameters tested during the jump, i.e.: force (F), velocity (V), power (P), and height [6, 8]. The My Jump application delivers more data compared to devices previously used during tests in speed climbers.
It should be emphasized that so far researches conducted on the force-velocity profile of climbers were rare. Most frequently, the force and velocity capabilities of the upper limbs of climbers of various specialties were compared. These studies found that boulderers were characterized by a higher level of explosive force when compared to other climbers [12, 13].
Planning this research, it was assumed that mobile measuring tools like My Jump app [1] could be used to diagnose performance at a general level (non-specific for climbing), e.g. by the CMJ jump, and determining its force and velocity parameters. So far no attempts have been made to determine which mechanical parameter, force (F) or velocity (V), determines more the result of special power and climbing time in speed climbing. The assessment of the level of force, velocity, and power of a single jump by the My Jump app and evaluation of the magnitude of the relations between these variables with the level of the special power and climbing time may have value for speed climbing coaches, in two aspects: 1) the informative aspect, because it allows for collecting data about the level of the mechanical parameters during CMJ test, and 2) the practical aspect because the application can be used as a replacement
for more expensive devices and allows for conducting measurements in conditions prevailing in climbing centers. Therefore, the study aimed to verify practical and informative aspects of the My Jump application in the assessment of force, velocity, and power during the CMJ test among speed climbers, as well as the evaluation of correlations between mechanical parameters of the CMJ jump and specific climbing power and climbing time.
Material and Methods
Male participants of the Czech Championships Open in sports speed climbing in December 2017 were subjected to the research (n = 8, the mean calendar age was 20.9 years). The subjects came from the Czech Republic (n = 4), Poland (n = 3), and Kazakhstan (n = 1). They displayed a varied sports level (some regularly qualified for the final rounds of international competitions, some of them came in the third ten, and others took part at least in the national competitions). All those who agreed to take part in the measurements were informed about the course and purpose of the research. The measurements were carried out immediately after the competition, in compliance with the Helsinki Declaration.
The climbing sprint time measurement (without the start signal, only the time of a run was measured) used a system that enabled the calculation of the climbing run power according to the Margaria–Kalamen formula. This method had successfully been used earlier in the analysis of climbing sprints [14]. In our research, it was assumed that by using statistical tools rationally it would be possible to find an answer to the question of how variables characterizing general efficiency (force, velocity, power) explain and determine the specific skill (specific-climbing power).
During the research, the climbers had their body height – BH, body weight – BW, and fat mass percentage – FM% measured. During anthropometric measurements, an anthropometer ALUMET and the BC-730 Tanita (Tanita corp., Japan) scale were used. Overall efficiency was measured using the height of CMJ (cm).
The measurements, in compliance with the instructions of the test authors, were performed with iPhone 6s (Apple, USA) and My Jump software [1]. Measurements were taken from the same position and with the same distance from a participant (1.5 m). The app determined jump
height using the equation: h = t2 × 1.22625 described by
Bosco et al. [2]. The length of the lower limbs (distance from the great trochanter to tiptoe with maximal foot plantar flexion) and the distance between the greater trochanter and the ground level (at approximately 90º
knee angle squat position) were also measured and entered into My Jump [8, 18]. CMJ power – P (W), muscle-generated force – F (N), and muscle shortening velocity – V (m/s) were used for the analyses. The study also used the climbing sprint results achieved by the competitors in the competitions (the shortest time in all races). The sprint results were used to calculate the run power RP (W/kg) according to the procedure described by the Ozimek team [14].
In the statistical analysis, the following values were used: arithmetic mean (x̃), standard deviation (SD), mean confidence intervals (95% CI), and coefficient of variation (CV). The relationships between the dependent variable (run time) and independent variables (force, velocity, and power indices) were evaluated with the use of Pearson’s correlation (with 90% CI). A p-value < 0.05 was adopted as a statistically significant correlation. To check the normal distribution of variables the Shapiro– Wilk test was performed.
Results
Table 1 demonstrates descriptive statistics and correlation coefficients of the measured somatic features and indicators
Table 1. Descriptive statistics and correlation coefficients (with CI) of the measured somatic features and indicators of motor
skills with climbing sprint time and specific-climbing power
x̃ SD 95% CI CV r(x.y) rt [s] r(x.y) RP [W/kg] rt [s] 8.19 1.95 6.56 9.81 23.79 1.00 –0.97* (p = 0.00) CI (0.97 ± 0.06) BH [cm] 178.55 8.83 171.17 185.93 4.95 (p = 0.26)–0.44 0.47 (p = 0.23) BW [kg] 70.23 12.19 60.03 80.42 17.36 (p = 0.26)–0.44 (p = 0.22)0.48 FM [%] 8.39 2.54 6.27 10.51 30.27 (p = 0.86)–0.07 (p = 0.88)0.06 RP [W/kg] 18.78 3.98 15.46 22.11 21.17 –0.97* (p = 0.00) CI (–0.97 ± 0.06) 1.00 CMJ [cm] 49.56 6.35 44.25 54.86 12.81 –0.89* (p = 0.00) CI (–0.90 ± 0.18) 0.90* (p = 0.00) CI (0.90 ± 0.17) CMJ F [N] 1603.98 210.43 1428.05 1779.9 13.12 (p = 0.165)–0.54 (p = 0.15)0.55 CMJ V [m/s] 1.56 0.10 1.47 1.64 6.67 –0.90* (p = 0.00) CI (–0.90 ± 0.17) 0.90* (p = 0.00) CI (0.90 ± 0.17) CMJ P [W] 2501.85 407.34 2161.31 2842.39 16.28 –0.78* (p = 0.02) CI (–0.78 ± 0.32) 0.80* (p = 0.01) CI (0.80 ± 0.30) Note: rt – climbing sprint time, BH – body height, BW – body weight, FM – fat mass percentage, RP – specific-climbing power, CMJ – countermovement jump height, CMJ F – muscle-generated force, CMJ V – muscle shortening velocity, CMJ P – CMJ power
* significant correlations
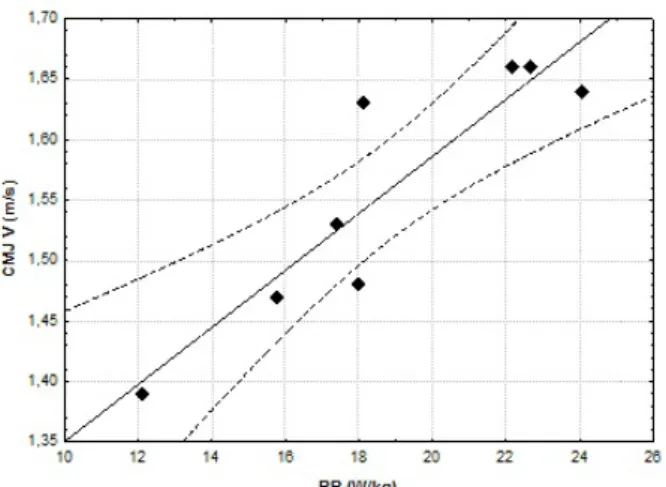
Figure 1. The scatterplot for the RP (W/kg) and CMJ V (m/s)
of the motor skills of the climbers. The data shows that special climbing power – RP, CMJ height (cm), P (W), and V (m/s) closely correlate with the running time. Statistically significant correlations between parameters and RP were recorded for: V (m/s) (0.9; p < 0.05), P (W) (0.80; p < 0.05) and the CMJ absolute score (cm) (0.9; p < 0.05). Figure 1 shows a diagram of the spread between RP (W/kg) and V (m/s) together with 95% CI.
Discussion
The My Jump application allows for an efficient assessment of the level of force, power, and velocity of the muscles working during a jump (CMJ) [5, 8, 15]. It needs to be highlighted that our research was the first attempt to use the My Jump application to evaluate force, velocity, and power in the CMJ test in speed climbers. Therefore, the question was whether the results collected by this application would have a reliable diagnostic value. For example, the Jiménez-Reyes et al. conducted similar measurements among sprinters and jumpers, with F, V, P on 1769 ± 129 (N), 1.61 ± 0.07 (m/s), and 2847 ± 317 (W), respectively [8]. Rago et al. study showed that among students, the mean value of velocity (V) obtained during the CMJ test was 1.42 ± 0.23 (m/s), with the mean height of the CMJ at 41 ± 0.4 cm [15]. Compared to these results the level of force, velocity, and power obtained in this research in speed climbers are similar and seem to be reliable. Some differences in mean values should be accepted as an effect of the sports specialization of the compared groups.
Previous research [10] in which the Optojump system (Microgate, Italy) was used demonstrated correlations between CMJ test, maximal anaerobic power, and best climbing time achieved during a national championship competition. The value of the correlations between the best climbing time and results for the CMJ test and relative power indicators were rx,y = –0.79 and rx,y = –0.75, respectively [10]. In our research, an attempt was made to analyze correlations of the force (F), power (P), and velocity (V) of the CMJ with the time of climbing and the climbing power (specific power; RP) indicator. A comparison of the correlation values from Krawczyk et al. study [10], with correlations from this study, shows that the strength of the correlations was similar. The correlation values between power obtained during CMJ and best climbing time were similar in both studies (rx,y = –0.75 vs rx,y = –0.78). Yet, correlation values between CMJ results and best climbing time were different
(rx,y = –0.79 vs rx,y = –0,89), and higher in the present
study. The high and significant values of the correlation
coefficients observed in the present study show that the My Jump application and the CMJ test conducted with this application have a potentially high informative value in assessing the level of motor potential, training results, and possible results of competitions in speed climbing. The results of the present study (and other studies), low financial costs of buying the My Jump application, a lot of variables describing the motor potential of the climber, and the possibility of carrying out measurements in non-laboratory conditions (e.g. climbing training centers) emphasize a high practical value of the My Jump application for speed climbing coaches.
Moreover, data from our research indicate that fast climbing in this competition is more dependent on the speed component of the lower limb muscles. The amount of resistance (the body of the competitor, Earth’s gravity) during a run is the load that makes the climbing run to qualify in the zone of maximum power and speed power. This means that the force and velocity profile of a speed climber can be oriented towards the velocity component. The F-v profiles of individual climbers were not determined in our research. Therefore, it is difficult to clearly state where exactly in the F-v curve the climbers under observation were located. Our results suggest that the velocity component may have more significance. Our unpublished measurements, made according to the procedure of Samozino et al. [17], concerning the F-v profile of a former world champion in speed climbing, being in the starting period, and qualifying for the final rounds, confirm the thesis about the profile characteristics. The profile of this competitor was velocity-oriented.
These results should be interpreted with caution. First, measurements were taken when the climber finished the competition. For this reason, the obtained results could be interrupted by fatigue or other psychosomatic factors connected with fatigue. Despite this, the participants were asked to perform maximum effort during jumping tests. Second, because of the small sample size (n = 8). Third, because of the high values of the standard deviation and coefficient of variance recorded for climbing time (rt) and specific-climbing power (RP), which indicate high dispersion in the studied group of climbers. Therefore, the correlation coefficients among rt, RP and CMJ, V (m/s), F (N) and P (W) could have been overestimated, and an actual influence on climbing time and climbing power competition values could be determined by technical skills, mental characteristics, and other factors not measured in this study. In the group of the tested speed climbers, a high level of homogeneity was observed for CMJ, V (m/s), F (N), and P (W)
variables. This homogeneity also indicates that rt and RP variables could be determined by other abilities than strength and speed (for example: climbing technical skills, mental characteristics, etc.). Ozimek et al. [14] suggested that RP (W/kg) variable should be interpreted as a multivariate indicator, determined by strength and speed abilities, specific climbing movement skills, and mental predispositions. Therefore, correlating results of the CMJ test and its kinetic parameters, can answer the question: to what extent, in the studied group of climbers, RP was determined by explosive strength (the result of CMJ) and mechanical parameters of CMJ (force, velocity, and power)? This would make it possible to differentiate strength and speed factors from other, not measured factors, which together determine rt (s) and RP (W/kg) in speed climbing competition. In
this study, the R2 values for the correlations between rt
(s) and RP (W/kg) and CMJ and V (m/s) were 81% in
both cases. For P (W) and F (N), the values of R2 were
64% and 31% respectively. Even with the potentially high impact of other factors, these results suggest that climbing time as well as specific-climbing power may be strongly correlated with speed abilities.
The results of this study may have a practical value for the training process in speed climbing because: 1) it enables trainers to obtain information on the velocity component of movement, which is important in speed climbing (and it is more difficult to train than the force or power); 2) it could be used in the speed climbing training, as it should contain non-specific and specific exercises at high velocity of movements (e.g. specific exercises on the climbing wall); 3) it suggest, that velocity oriented exercises should occupy 4/5 of all
training time in speed climbing (based on R2 values).
However, these indications, along with the current state of research in this discipline, should be regarded as suggestions. Further research in speed climbing should include an attempt to determine the full F-v characteristics of a climber.
Conclusions
In conclusion, our research reviled that My Jump app could become a worthy diagnostic tool, providing information about speed abilities, which is highly valuable for speed climbing coaches. Moreover, the motor effect, expressed by climbing time and climbing power in speed climbing, is probably more strongly correlated with velocity, than the force component.
Conflicts of Interest
The authors declare no conflict of interest.
References
1. Balsalobre-Fernández C, Glaister M, Lockey RA. The validity and reliability of an iPhone app for measuring vertical jump performance. J Sports Sci. 2015 Sep 14;33(15):1574-1579.
2. Bosco C, Luhtanen P, Komi PV. A simple method for measurement of mechanical power in jumping. Eur J Appl Physiol Occup Physiol. 1983 Jan;50(2):273-282. 3. Escobar Álvarez JA, Jiménez Reyes P, Da Conceição FA,
Fuentes García JP. Does the initial level of horizontal force determine the magnitude of improvement in acceleration performance in rugby? Eur J Sport Sci. 2020 Aug 21;1-9.
4. Fuss FK, Niegl G. Dynamics of Speed Climbing. In: Moritz EF, Haake S, editors. The Engineering of Sport 6. New York: Springer; 2006. p. 51-56.
5. Gallardo-Fuentes F, Gallardo-Fuentes J, Ramírez-Campillo R, Balsalobre-Fernández C, Martínez C, Caniuqueo A, et al. Intersession and intrasession reliability and validity of the My Jump app for measuring different jump actions in trained male and female athletes. J Strength Cond Res. 2016 Jul;30(7):2049-2056.
6. Gallego-Izquierdo T, Vidal-Aragón G, Calderón-Corrales P, Acuña Á, Achalandabaso-Ochoa A, Aibar-Almazán A, et al. Effects of a gluteal muscles specific exercise program on the vertical jump. Int J Environ Res Public Health. 2020 Jul 27;17(15):5383.
7. González-García J, Morencos E, Balsalobre-Fernández C, Cuéllar-Rayo Á, Romero-Moraleda B. Effects of 7-week hip thrust versus back squat resistance training on performance in adolescent female soccer players. Sports. 2019 Apr 3;7(4):80.
8. Jiménez-Reyes P, Samozino P, Pareja-Blanco F, Conceição F, Cuadrado-Peñafiel V, González-Badillo JJ, et al. Validity of a simple method for measuring force-velocity-power profile in countermovement jump. Int J Sports Physiol Perform. 2017 Jan;12(1):36-43.
9. Krawczyk M, Ozimek M. Somatic traits and motor skill abilities in top-class professional speed climbers compared to recreational climbers. Antropomotoryka – J Kinesiol Exerc Sci. 2014;25(66):25-32.
10. Krawczyk M, Ozimek M, Pociecha M, Draga P, Zadarko E, Barabasz Z. Selected morphofunctional characteristics and their correlations with performance of female and male speed climbers. Sci Sports. 2020 Sep;35(4):243-245.
11. Krawczyk M, Ozimek M, Rokowski R, Pociecha M, Draga P. Anthropometric characteristics and anaerobic power of lower limbs and their raltionships with race time in female climbers. Soc Integr Educ Proc Int Sci Conf. 2018;IV:118-126.
12. Laffaye G, Collin J-M, Levernier G, Padulo J. Upper-limb power test in rock-cUpper-limbing. Int J Sports Med. 2014 Feb 19;35(08):670-675.
13. Levernier G, Samozino P, Laffaye G. Force–velocity– power profile in high-elite boulder, lead, and speed climber competitors. Int J Sports Physiol Perform. 2020 Aug 1;15(7):1012-1018.
14. Ozimek M, Krawczyk M, Rokowski R, Draga P, Ambro- ży T, Mucha D, et al. Evaluation of the level of anaerobic power and its effect on speed climbing performance in elite climbers. Trends Sport Sci. 2018;3(25):149-158. 15. Rago V, Brito J, Figueiredo P, Carvalho T, Fernandes T,
Fonseca P, et al. Countermovement jump analysis using different portable devices: implications for field testing. Sports. 2018 Aug 31;6(3):91.
16. Ryepko OA. Features and functionality of speed and power capabilites of elite climbers and various types of rock climbing. Phys Educ Students. 2013;6:60-65. 17. Samozino P, Edouard P, Sangnier S, Brughelli M,
Gimenez P, Morin J-B. Force-velocity profile: imbalance determination and effect on lower limb ballistic performance. Int J Sports Med. 2013 Nov 13;35(06): 505-510.
18. Samozino P, Morin J-B, Hintzy F, Belli A. A simple method for measuring force, velocity and power output during squat jump. J Biomech. 2008 Oct;41(14):2940- -2945.
19. Sayers SP, Harackiewicz DV, Harman EA, Frykman PN, Rosenstein MT. Cross-validation of three jump power equations. Med Sci Sports Exerc. 1999 Apr;31(4):572-577.