25 Studies in Physical Culture and Tourism
Vol. 19, No. 1, 2012, 25-29 ISSN 0867-1079 Copyright © 2012 Akademia Wychowania Fizycznego w Poznaniu Copyright © 2012 Cornetis
Subjective assessment of body image by middle-aged men and women
Anna Demuth, Urszula Czerniak, Magdalena Krzykała, Ewa Ziółkowska-Łajp Department of Anthropology and Biometry, University School of Physical Education in Poznań, Poland
ABSTRACT Aim of Study. The aim of the study was to compare the subjective body image of middle-aged men
and women with regard to their morphological traits and physical activity.
Material and Methods. The sample consisted of 71 women and 95 men, between 40 and 60 years of
age, with a higher education. Each subject had their body height, body mass and waist circumference measured. The subjects were divided into two groups with regard to medium values of their morpho-logical parameters. Color-A-Person Body Dissatisfaction Test (CAPT) by O.W. Wooley was used to mea-sure body perception. Also, on the basis of the International Physical Activity Questionnaire results the subjects were divided into two groups: one consisting of physically active men (n = 59) and women (n = 35), and the other of physically passive men (n = 36) and women (n = 36).
Results. 1) CAPT results revealed significant differences in the overall estimation of participants’ own
bodies, while women estimated their own bodies more critically than men. 2) Women with higher body mass and longer waist circumferences had a higher level of negative body perception, but no similar significant correlation was found in men. 3) Physically active men had more positive percep-tion of their own bodies, but in women the correlapercep-tion was not significant.
Conclusions. Morphological traits and intense physical activity are significantly related to one’s own
body perception. Cultural stereotypes connected with both sexes and attractiveness have a signifi-cant influence on the perception of one’s own body.
KEY WORDS body image, middle age.
Introduction
Body image is one of components of self-image relat-ed to our conceptions of our bodies. In social relations the body does not only play the role of a communications car-rier providing the basic information about a person, such as sex, race, age, and even socio-economic status or profes-sion. It is also a source of judgment which affects the per-ception of the whole person and indirectly influences their self-esteem. Therefore, it is not unimportant what we look like [1, 2]. Physically attractive people are perceived as hav-ing a number of other positive qualities such as interper-sonal and professional competences, interperinterper-sonal attrac-tiveness, social adaptation or intellectual abilities, described in psychology as “halo effect” [3]. People with a positive self-image are optimistic, self-confident and cheerful, and others like to stop and talk with them. At the same time these people have more positive and fewer negative social experiences than less attractive people [4, 5, 6]. On the other hand, those with a negative self-image are often dis-satisfied, anxious and perceive the world as threatening and dangerous.
The discussion about the lack of satisfaction with body image in women points to the cultural effects of ‘civiliza-tion of hungry women’ which imposes high, unrealistic standards of a female body – beautiful, slim and always young [7, 8, 9, 10]. As a result, women much more than men, are interested in their body image. They are also more critical of it. The results of research carried out by American psychologists indicate that only slim women whose body mass index does not exceed 20, appear to be happy with their body image to a degree comparable with men [11]. In the modern world the categories of body weight and body height have become significant elements affecting the body image of a person. A slim body is highly valued, and a significant body height is associated with dominance and high social status [12]. At the same time, overweight and obesity are clearly associated with ugli-ness. Obese people encounter many problems not only in interpersonal but also in professional relations. Employers require the employees to be presentable and discriminate against “the plump” [13, 14]. What then do people holding the highest positions in Poznań institutions look like? How do they assess their bodies? Is the level of dissatisfaction
26
with their own bodies related to their sex and morphologi-cal characteristics?
Aim of Study
The aim of the study was to compare the subjective body image of middle-aged men and women with regard to their morphological characteristics and physical activity.
Material and Methods
The material basis for this report was a study carried out among men and women – members of the social elite of the Wielkopolska region in Poland. The studied people have a higher education and their age ranged from 40 to 60 years (women M = 52.44 ± 6.89; men M = 48.24 ± 4.52). The social elite of the Wielkopolska region included respondents in managerial positions in state administration, self-government, and academic teachers with post-doctoral degrees in the Wielkopolska region. People invited to take part in the study were directors, deputy directors, managers of independent units of the Municipal Office of the City of Poznań, Office of the Marshal of the Wielkopolska Province and Poznań district level offices. The study also involved mayors, commune heads from the Poznań district and their deputies. In total, data on 210 people was collected, of whom 71 were women and 95 were men.
In the analysis the participants’ basic morphological traits were considered: body mass and body height, waist circumference and the body mass index (BMI) (Table 1). The values of the analysed morphological traits were the basis of division of the participants into two groups. The first one comprised participants with low values of body mass and body height, waist circumference (values below median determined for given characteristics). The other group included participants with the analysed morphological traits developed significantly (values above median determined for given characteristic). This procedure was adopted in accordance with the rules of anthropology. Table 2 shows the quantitative analysis of the studied groups.
The relationship between the BMI and the sex of indi-vidual participants was also determined with a chi-square test. For the analysis of body image the Color-A-Person Body Dissatisfaction Test (CAPT) by O.W. Wooley was used [15]. The subjects were divided into two groups: one consisting of physically active men (n = 59) and women (n = 35), and the other comprising physically inactive men (n = 36) and women (n = 36). The division into those groups was made on the basis of a shortened version of the International Physical Activity Questionnaire [16]. To examine differences between the sexes in terms of body dissatisfaction with regard to morphological traits and ways of spending leisure time, a non-parametric Mann-Whitney U test was used. Also, the relationship between the level of body dissatisfaction and morphological parameters was established using Spear-man’s correlation. All statistical calculations were made in Microsoft®Excel 2000.
CAPT as a research tool
The Color-A-Person Body Dissatisfaction Test (CAPT) by O.W. Wooley was used for body image analysis [15]. The test had been adapted to Polish conditions by Zarek [3]. The CAPT is designed to analyze the emotional aspect of body image, i.e. body dissatisfaction in adults. It consists of two sheets representing male and female figures (front and side views). The task of a person taking the test is to imagine themselves in the role of the outlined figure by expressing their opinions on their own body using a 5-item grading scale (from very satisfied to very dissatisfied). In order to do this the participant uses five colours corresponding to the way he or she assesses a given body part to fill in the fig-ure outline. The colours are numbered from 1 to 5, from 1 – very satisfied to 5 – very dissatisfied. The advantage of the CAPT test is freedom of choice. The participant decides how the figure will be divided (which elements will be selected for assessment) and how it will be assessed. Only at the picture analysis stage does the researcher use a template to apply a uniform point awarding system and use quan-titative methods. The overall result of the CAPT test is the mean value for 16 body parts: hair, face, shoulders, arms, forearms, hands, chest, breasts, waist, abdomen, hips, but-tocks, thighs, calves, ankles and feet (15 body parts for men as male breasts are not subject to assessment). The CAPT is a general measure of body dissatisfaction – the higher the individual score, the higher the dissatisfaction of a person with his/her body or its parts.
Table I. Analysis of subjects’ morphological characteristics
Parameter Women Men
M SD M SD
Body height 164.96 6.72 174.55 6.36
Body mass 66.20 9.83 80.46 8.99
Waist circumference 79.84 8.68 91.74 7.83
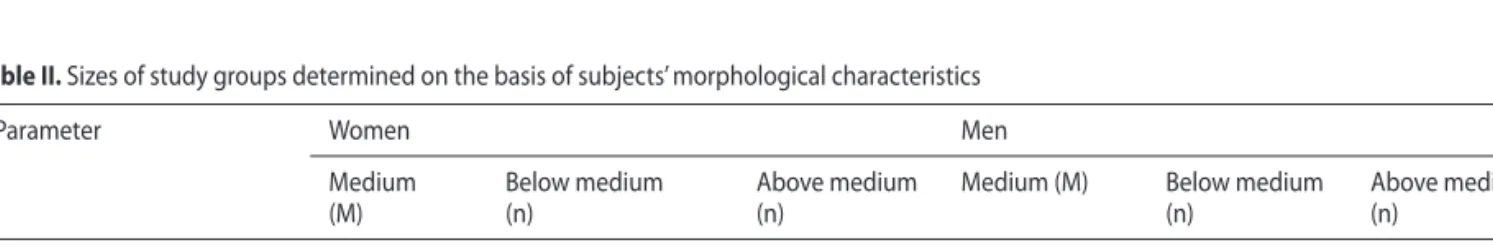
Table II. Sizes of study groups determined on the basis of subjects’ morphological characteristics
Parameter Women Men
Medium (M) Below medium (n) Above medium (n)
Medium (M) Below medium (n) Above medium (n) Body height 164.0 33 31 175.0 45 45 Body mass 65.0 32 32 80.0 41 48 Waist circumference 23.9 34 29 25.83 43 49
27
Results
The study sample comprised public officials from vari-ous institutions of the Wielkopolska region. It was assumed that they cared about their appearance which directly trans-lated into the assessment of their own attractiveness. Thus, in the first stage of result analysis a subjective and objective assessment of participants’ figures was carried out. For this purpose the BMI was used and a four-degree classification model proposed by the WHO was adopted [17]. Four BMI ranges were distinguished: the first one included pants with the BMI lower than 18.5, the second – partici-pants with the BMI from 18.5 to 24.9, the third – participartici-pants with the BMI of 25 to 29.9, and the fourth – participants with the BMI over 30.
Table 3 presents data illustrating the percentage of indi-vidual components of body leanness. The results indicate an interrelation between the category of BMI and the sex of an individual (chi-square = 1.032, p = 0.597). The stud-ied groups differed most strongly in terms of body mass to body height proportions within the normal and overweight range, and the differences in the percentage of the above categories of body leanness were statistically significant. It should be noted, however, that the fractions of people dis-tinguished in terms of the BMI in both analysed groups are different, which is manifested in a greater share of incidence of overweight in men and in a smaller share of people with correct body weight to body height proportions.
After establishing the actual body image of men and women on the basis of their BMI, a subjective assessment of the level of dissatisfaction with body image was carried out. In the studied groups of men and women there were sig-nificant differences in the overall assessment of body image expressed by the CAPT results, and women were more criti-cal towards their bodies than men. A comparison of levels of dissatisfaction with individual areas of the body in men and women showed significant differences only for 5 out of 15 body parts. Women were more dissatisfied than men with
their hips, thighs, calves, buttocks and feet. Mean results of variables for which statistically significant differences were noted between the sexes are presented in Figure 1.
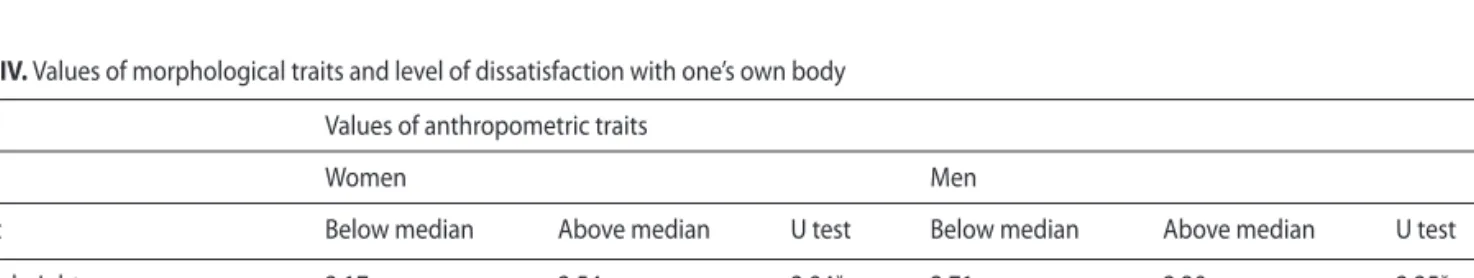
Next, the relationship between the level of develop-ment of morphological traits and body image satisfaction (CAPT) was established. For this purpose the participants were divided into two groups, separately for men and women (Table 4). The first groups consisted of participants with lower body height, body mass and waist circumfer-ence measurement results than the arithmetic means of these properties calculated for the whole group. The other group included people with higher measurement values of morphological traits above the arithmetic means. In the first stage of data analysis the level of dissatisfaction with body image was compared to the value of morphological fea-tures, separately for men and women. Body mass and waist circumference data revealed a varied relationship with the body perception. Higher than average body mass and long-er waist circumflong-erence in women are significantly correlated with a negative body image. Women with greater body mass and longer waist circumference had a higher average CAPT than those with lower values of these properties. The dif-ferences were statistically significant. In men, no significant correlations were found. The male respondents with signifi-cant body mass and waist circumference attained slightly lower CAPT results; moreover, the differences between groups were statistically non-significant. What is interesting, body height measurement revealed significant differences between the studied groups. Both men and women of lower than average height had a more negative perception of their figure, with CAPT differences being statistically significant. No significant correlations between the sexes was noted in the body image assessment for people with lower than
aver-Table III. Percentage of overweight and obese people
Sex BMI M Underweight (%) Normal (%) Overweight (%) Obese (%) Men 25.92 – 37* 57* 6 Women 24.10 6 67* 24* 3 * statistically significant at p = 0.05 0.0 1.0 2.0 3.0 hips feet thighs calfs buttloks CAPT Men Women
Figure 1. Comparative analysis of dissatisfaction with one’s own body le-vel. Variables with signifi cant diff erences between men and women
Table IV. Values of morphological traits and level of dissatisfaction with one’s own body Values of anthropometric traits
Women Men
Capt Below median Above median U test Below median Above median U test
Body height 3.17 2.54 2.94* 2.71 2.30 2.25*
Body mass 2.44 2.91 1.99* 2.44 2.36 0.33
Waist circumference 2.25 2.96 3.15* 2.22 2.20 0.12
28
age body mass and shorter waist circumference. Men and women with such somatic characteristics had similar mean results of assessment of their body image dissatisfaction.
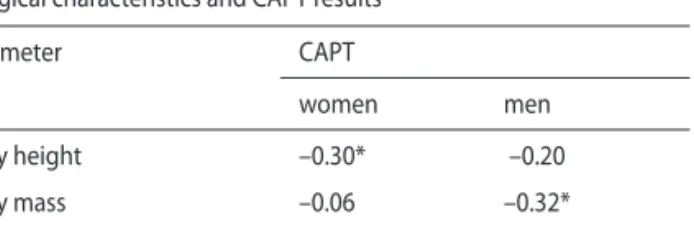
Next, in order to establish the relationships between the size of morphological characteristics and the level of body dissatisfaction in the groups of men and women, Spearman’s correlation test was applied (Table 5). A negative significant correlation with global body assessment (CAPT) and body height in women and with body mass in men was noted. It should be emphasized, however, that these were moderate correlations, i.e. with indices ranging from 0.3 to 0.4.
In the further analysis the level of body satisfaction was established in relation to ways of spending leisure time (Fig. 2, Table 6). The participants were divided into physi-cally active and inactive. In each group the body dissatis-faction level was assessed. Physically active people, both men and women, had a more positive body image than people who do not participate in physical exercises. Moreo-ver, female respondents from both groups attained signifi-cantly higher mean CAPT results than male participants. It should be noted that the comparison of ways of spending leisure time revealed non-significant differences in the level of body image satisfaction in women and significant differ-ences in men.
Discussion
The differences in body image by men and women have been a subject of modern psychology for a long time [2, 5, 6, 8, 11]. The results of the present study show that women tend to have a less positive body image. It is probably related to different social expectations, according to which a woman’s self-esteem is related to her physical attractive-ness [18]. It must not be, however, forgotten that, according to Zarek, from a socio-cultural perspective a human body is assessed in terms of attractiveness. Moreover, a person is physically attractive if their appearance reflects current cul-tural standards, i.e. it has specific physical features [3].
The entire studied group consisted of college graduates. It included high-level officials from institutions of the Poznań district as well as academic teachers with post-doctoral degrees. The respondents were aged 40-60 years, so from the biological point of view, they were entering the period of life when the signs of ageing appear and even intensify. In spite of this, the participants attained average results of the CAPT. Compared with the results by Wooley and Roll, the indices of differences in body image in the studied group were not high [15]. What is more, the results are similar to those obtained by Zarek on a population of young men and women using the same method of assessment of body dissatisfaction [3]. It should be also emphasised that in the present study the greatest differences between the sexes were related to the lower body, i.e. the hips, buttocks, thighs, calves and feet, which is also confirmed by other studies. It can be said that high-level officials from Poznań institu-tions care about their appearance, have a positive attitude towards it, and for them age turned out to be a fairly weak determinant of the assessment of the level of body dissat-isfaction.
By contrast, the comparison of the studied morphologi-cal characteristics with the level of body dissatisfaction indi-cate a different approach to one’s own corporality for both sexes, which is reflected by cultural standards of physical attractiveness. In men, a lower body mass indicated a nega-tive correlation with the level of body image dissatisfaction. This is probably related to the fact that in men a higher level of satisfaction with appearance is more often linked with muscle mass. The results obtained in the groups of active and inactive men clearly confirm this point. The respond-ents who regularly undertook physical exercises in their leisure time had significantly lower CAPT values than the respondents preferring passive leisure. Also physically active women felt more attractive. Although a high level of physi-cal activity positively affects the overall assessment of one’s own figure, it does not mean that women who do physical exercises are free from stereotypical conceptions regarding their attractiveness. Their assessment of body image does not differ significantly from the one of non-training women. According to Olivardia [19], a muscular man is perceived as an impersonation of “masculinity”. Muscles allow men to feel more masculine – more self-confident, respected and admired. In other words – a muscular man feels more attractive. The present study used BMI measurements which pointed to a large percentage of overweight and obese peo-ple in the studied group. It should be kept in mind, however,
active passive 0 women men 1 2 3 4
Table VI. Signifi cance of diff erences between CAPT results and ways of spending leisure time
Physical activity U test
Women 1.16
Men 5.66 *
* statistically significant at p = 0.05
Table V. Spearman’s coeffi cients of correlation between subjects’ mor-phological characteristics and CAPT results
Parameter CAPT women men Body height –0.30* –0.20 Body mass –0.06 –0.32* Waist circumference 0.16 0.15 * statistically significant at p = 0.05
Figure 2. Ways of spending leisure time and level of dissatisfaction with one’s own body
29
that the BMI is a worse estimator of fat in physically active people [20, 21, 22]. Considering that a significant number of men declare taking part in active forms of leisure, it can be assumed that the value of the analysed indicator is not the result of overweight and obesity. This in turn is linked to higher body satisfaction.
The results of the study show that the sex, basic morpho-logical characteristics and physical activity are significantly related with different perceptions of body image. Body mass may be associated with extra kilograms and heavy figure (women), or muscular, strong body (men). However, body height is a source of subjective attractiveness for both sexes.
Conclusions
Morphological characteristics and intensive physical exercises are significantly correlated with different body perceptions by the studied men and women. Body image is significantly affected by cultural stereotypes related to male and female attractiveness. Stereotypes related to appear-ance are stronger in women, but at the same time slightly weaker in people practising sports.
References
1. Mandal E. Body as a process, body as an object. Body image of the physical education and university students. The Journal Psychologi-cal.2004; 1: 35 -47.
2. Pawłowski B. Biology of human attractiveness. Warszawa 2009. 3. Zarek AA. comparison of a subjective evaluation of male and female
bodies ranging from 19 to 25 years of age. Annales Academiae Medi-cae Stetinensis. 2007; 53, 3: 26 -33.
4. Cash T, Fleming E. Body image and social relations. In: Body image. A handbook of theory, research and clinical practice: The Guilford Press, New York 2002. pp. 277 -286.
5. Langlois JH, Kalakanis L, Rubenstein A, et al. Maxims or myths of beauty? A meta -analytic and theoretical review. Psychology Bulletin. 2000; 126: 390 -423.
6. Mazzella R, Feingold A. The eff ects of physical attractiveness, race, socioeconomic status and gender of defendants and victims on judgments of mock jurors: A meta -analysis. Journal of Applied Social Psychology. 1994; 24: 1315 -1344.
7. Bergstrom RL, Neighbors C, Lewis MA. Do men fi nd “bony” women attractive? Consequences of misperceiving opposite sex perceptions of attractive body image. Body Image. 2004; 1, 2: 183 -191.
8. Muth JL, Cash TF. Body image attitudes – what diff erence does gen-der make? J. Aprl. Soc. Psychol. 1997; 27: 1438 -1452.
9. Pingitore R, Spring B, Garfi eld D. Gender diff erences in body satisfac-tion. Obes. Res. 1997; 5: 402 -409.
10. Streigel -Moore R, Franko D. Body image issues among girls and women. In: Body image. A handbook of theory, research and clinical practice: The Guilford Press, New York 2002. pp. 183 -191.
11. Tove MJ, Reinhardt J, Mahmoodi BR, et al. Human female attractive-ness: waveform analysis of body shape. Proceedings of the Royal So-ciety, Biological Sciences. 2002; 269: 2205 -2213.
12. Zebrowicz LA.External appearance as the basis for stereotyping. In: Stereotypes and prejudices, Publisher Gdańsk Psychological; 1999. pp. 66 -96.
13. Crocker J, Cornwell B, Major B. The stigma of overweight – aff ective consequences of attributional ambiguity. J. Pers. Soc. Psychol. 1993; 64: 60 -70.
14. Pingitore R, Dugoni BL, Tindale RS, Spring B. Bias against overweight job applicants in a simulated employment interview. J. Aprl. Soc. Psy-chol. 1994; 79: 909 -917.
15. Wooley OW, Roll S. The Color -A -Person Body Dissatisfaction Test sta-bility, internal consistency, validity and factor structure. J. Pers. As-sess. 1991; 53, 3: 395 -413.
16. International Physical Activity Questionnaire – IPAQ: www.ipaq.ki.se 17. WHO Fact sheet no 31: Obesity and overweight lifestyle www.who.
int/mediacentre/factsheets/ fs311/en./
18. Mirucka B. Types of physical self, the ways of experiencing their phys-icality by women. The Journal Psychological. 2005; 2: 157 -166. 19. Olivardia R. Body image and muscularity. In: Body image. A
hand-book of theory, research and clinical practice: The Guilford Press, New York; 2002. pp. 210 -219.
20. Bergman P, Rogucka E. Correlations of diff erent measures of general adiposity and fat distribution in adult men and women. Physical Ed-ucation and Sport, Warszawa 1998; 3: 79 -92.
21. European guidelines on prevention of cardiovascular disease in clinical practice – shortened version. Polish Heart Journal. 2008; 66: 4 (supl. 1).
22. Łaska -Mierzejewska T. Anthropology in sport and physical educa-tion, Warszawa, AWF; 1999.
Correspondence should be addressed to: Anna Demuth, Department of Anthropology and Biometry, University School of Physical Education, ul. Królowej Jadwigi 27/39, 61-871 Poznań, tel: (061)8355230, e-mail: demuth@awf.poznan.pl
Acknowledgement. This study was supported by the Ministry of Science and Higher Education research grant no. N40402932/0534