STUDIES IN PHYSICAL CULTURE AND TOURISM Vol. 14, Supplement 2007
TERESA ZWIERKO, PIOTR LESIAKOWSKI University of Szczecin, Physical Culture Institute, Szczecin
SELECTED PARAMETERS OF SPEED PERFORMANCE OF BASKETBALL
PLAYERS WITH DIFFERENT SPORT EXPERIENCE LEVELS
Key words: basketball, speed abilities, maximal running velocity.
ABSTRACT
The examination and control of players’ speed at each stage of training provide information about the planning and implementation of training programs. The aim of this study was to compare selected aspects of running velocity during a 20-meter run, with and without dribbling, performed by female basketball players of different age and sport experience. The study covered 42 female basketball players of the STK Kusy Szczecin Club. The girls represented the following age groups: 12 years old (n=12), 14 years old (n=14) and 17-19 years old (
x
=18.4 years, n=16). Speed abilities were diagnosed with a laser diode system LDM 300C-Sport. The analysis of the 20m run did not reveal any significant differences in the run duration between the three age groups. In the second test, with dribbling, the results were different between the age groups and depended on the age (p<0.001). The youngest group achieved maximum speed earlier than the older players.INTRODUCTION
Physical effort during a basketball match is often described as a long-term acyclical work with an interval character, where energy is obtained both aerobically and anaerobically [2]. Studies by Colli et al. [3] show that during a basketball match players cover 4,500-5,000 meters on average; and Roniker [9] shows that 10% of the effort during a match is based on endurance, 50% on speed, and 40% are efforts of minor intensity.
In basketball all aspects of speed are indispensable. During a match, players need to start running instantly, run forward to attack, return for defence, rebound, stop and jump. Their speed can be revealed in comprehensive tests including movement with the ball, and other certain technical elements with and without the ball, as well as the
speed of singular movements, i.e. in taking a shot, passing a ball, etc. Jóźwiak [4] in his study of motor conditions in successful basketball players, observed statistically significant (p<0.01) correla-tions between the success in play (rankings prepared by their coach) and their speed parameters (starting speed, r=0.60; maximum speed r=0.73), strength and endurance parameters (vertical jump, r=0.68), and endurance and speed parameters (15x20 m run, r=0.65). Karpowicz and Karpowicz [5] in their study on the performance structure of young basketball players (n=72) showed that physical performance relies mostly on the speed abilities, i.e. the start up speed (D=65.3%) and running speed (D=52.1%).
Good speed training, both with and without a ball, is crucial for the effectiveness of play. This is why it is one of the basic components of training
Correspondence should be addressed to: Teresa Zwierko, University of Szczecin, Physical Culture Institute,
sessions. Mikołajec et al. [7] examined the effects of six-week long training on the variability of selected aspects of speed in female basketball players from the U-17 Polish National Team. The speed of four maximal sprints for 30 m was analyzed at 5, 15, 20, 30 meters, and the maximum velocity was measured. After 6 weeks of training a significant improvement was observed at short running distance (5 and 15 m), along with maxi-mum running velocity (by 5.36 %).
The examination and control of the players’ speed at each stage of training provides important data for planning and implementation of training programs. The aim of this study was to compare selected aspects of running velocity in a 20 meter run, with and without dribbling, performed by female basketball players, differing in age and sport experience.
METHODS
The study involved 42 female basketball players of the STK Kusy Szczecin Club. The girls comprised the following age groups: under-12 years old (U-12, n=12), under-14 years old (U-14, n=14) and 17-19 years old (
x
=18,45+0,86 years, U-19, n=16). The oldest team won the bronze medal in the U-18 Polish Championships, 5th place in the U-19 Polish Championships and played matches in the 1st division. The players’ general characteristics are presented in Table 1.Speed abilities were diagnosed with a laser diode system LDM 300C-Sport (Jenoptik, Jena, Germany) which provides on-line recording of the required distance-versus-time and velocity-versus-time relationships as well as of selected individual kinematic parameters. The measurements and
mathematical analyses concerned a) duration of 20 m run (t20) and the times at each meter (t1...20) of
the distance [s], b) velocity at each meter (V1…20) of
the distance [m/s], c) maximum speed Vmax, along
with the point (sVmax) and time (tVmax) where it was
achieved.
Procedure: the examination was preceded by a 15-minute warm up. Test 1–20 m run, was performed twice by the players (the better resultwas taken into account), with their own start. The finish line was 5 meters after the 20 meters distance. Test 2–20 m run with dribbling. All the other conditions of the measurement were identical with Test 1.
To confirm the significance of differences between the groups we used the ANOVA analysis of variance. The differences within the groups were measured with post-hoc Tukey’s test (HSD).
RESULTS
The analysis of the results began with the presentation of the run duration (s) for 20 meters, achieved by the examined groups of players. Mean times for each meter of the 20-meter long distance are similar in all the age groups (Fig. 1).
Table 2 shows the variability of the results in the studied groups, recorded on the 5th, 10th, 15th and 20th meter of the distance. At each of the analyzed points (s), mean results obtained by the players do not differ significantly (p>0.05).
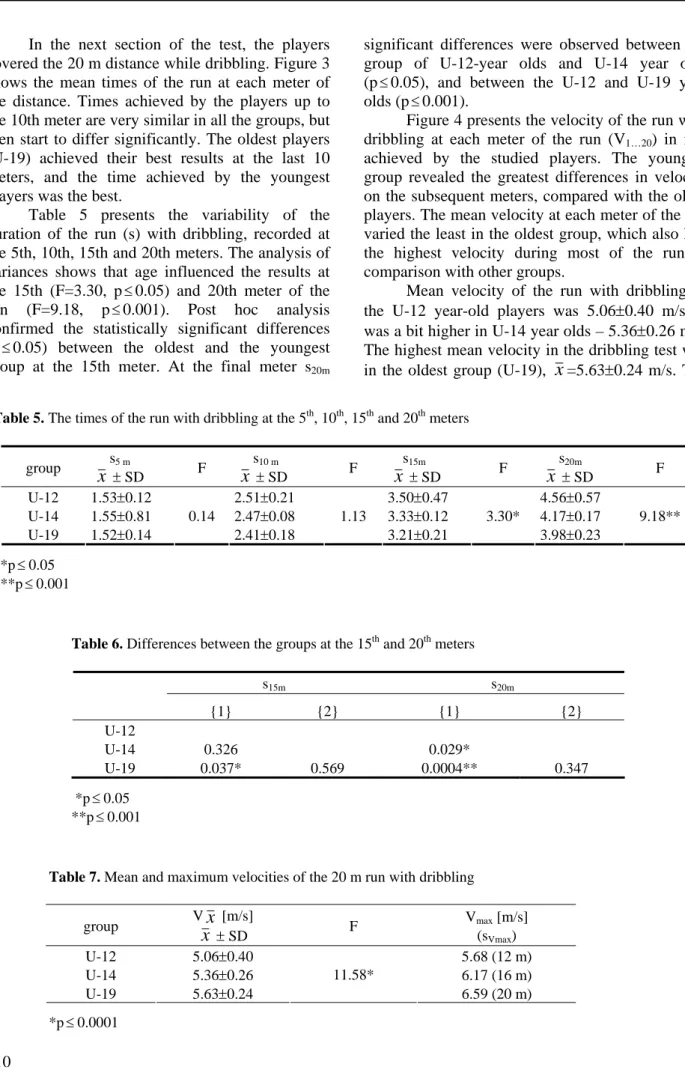
Figure 2 presents the velocity of the run on each meter (V1…20) in m/s, achieved by the
examined players. Lines constructed of mean values recorded at each meter have a similar shape, although the youngest group displays the greatest differences during the run in comparison with other groups. The velocity of the youngest group decreases during the last 5 meters.
Table 1. General characteristics of the STK Kusy
Szczecin players
Group Body height [cm]
x
± SD Body weight [kg]x
± SD Sport experience [years]x
± SD U-12 160.75 ± 6.62 48.79 ± 6.33 2.0 ± 0.73 U-14 169.0 ± 7.26 58.64 ± 6.13 3.14 ± 0,73 U-19 175.93 ± 9.42 63.56 ± 9.44 5.75 ± 1.61In further analysis, we concentrated on the mean velocity during the whole run (Tab. 3). The velocity of the U-12 group was
x
=5.59±0.32 m/s.The velocity of the U-14 group was higher (
x
=5.83±0.28 m/s), and the oldest group was thefastest (
x
=5.93±0.22 m/s). The analysis ofvariance shows that the mean velocity differs in relation to the age of the examined players (F=5.77, p≤ 0.006). The analysis of differences between the groups showed that statistically significant differences (p≤ 0.01) were apparent between the oldest players (U-19) and the youngest ones (U-12) (Table 4).
The youngest group achieved maximum speed at the 14th meter of the run (Vmax (s14m) =
6.54 m/s), and the older players at the final meters (Vmax (s20m) = 6.87 m/s, Vmax (s19m) = 6.95 m/s, respectively). 0,00 1,00 2,00 3,00 4,00 5,00 6,00 7,00 8,00 1 2 3 4 5 6 7 8 9 10 11 12 13 14 15 16 17 18 19 20 Distance [m] V e lo c it y [ m /s ]
U-12 U-14 U-19
Figure 2. The velocity of the 20 m run [m/s]
0 0,5 1 1,5 2 2,5 3 3,5 4 4,5 1 2 3 4 5 6 7 8 9 10 11 12 13 14 15 16 17 18 19 20 Distance [m] Ti m e [ s ]
U-12 U-14 U-19
Figure 1. Duration of the 20 m run [s]
Table 2. Times on the 5th, 10th, 15th and 20th meter
group s5 m
x
± SD F s10 mx
± SD F s15mx
± SD F s20mx
± SD F U-12 1.40±0.18 2.30±0.21 3.15±0.27 3.98±0.30 U-14 1.50±0.07 2.36±0.10 3.14±0.12 3.90±0.16 U-19 1.48±0.07 2.31 2.33±0.08 0.62 3.10±0.10 0.39 3.,83±0.13 1.72Table 3. Mean and maximum velocity during the 20 m run
group V
x
[m/s]x
± SD F Vmax [m/s] (sVmax) U-12 5.59±0.32 6.54 (14 m) U-14 5.83±0.28 6.87 (20 m) U-19 5.93±0.22 5.77* 6.95 (19 m) *p 0.006 ≤ 0 0,5 1 1,5 2 2,5 3 3,5 4 4,5 5 1 2 3 4 5 6 7 8 9 10 11 12 13 14 15 16 17 18 19 20 Distance [m] Ti m e [ s ]U-12 U-14 U-19
Table 4. Velocity differences between the groups
in the 20 m run (HSD) group {1} {2} U-12 {1} U-14 {2} 0.075 U-19 {3} 0.009* 0.651 *p≤0.01
In the next section of the test, the players covered the 20 m distance while dribbling. Figure 3 shows the mean times of the run at each meter of the distance. Times achieved by the players up to the 10th meter are very similar in all the groups, but then start to differ significantly. The oldest players (U-19) achieved their best results at the last 10 meters, and the time achieved by the youngest players was the best.
Table 5 presents the variability of the duration of the run (s) with dribbling, recorded at the 5th, 10th, 15th and 20th meters. The analysis of variances shows that age influenced the results at the 15th (F=3.30, p 0.05) and 20th meter of the run (F=9.18, p≤0.001). Post hoc analysis confirmed the statistically significant differences (p 0.05) between the oldest and the youngest group at the 15th meter. At the final meter s
≤
≤
20m
significant differences were observed between the group of U-12-year olds and U-14 year olds (p≤0.05), and between the U-12 and U-19 year olds (p≤0.001).
Figure 4 presents the velocity of the run with dribbling at each meter of the run (V1…20) in m/s
achieved by the studied players. The youngest group revealed the greatest differences in velocity on the subsequent meters, compared with the older players. The mean velocity at each meter of the run varied the least in the oldest group, which also had the highest velocity during most of the run in comparison with other groups.
Mean velocity of the run with dribbling of the U-12 year-old players was 5.06±0.40 m/s; it was a bit higher in U-14 year olds – 5.36±0.26 m/s. The highest mean velocity in the dribbling test was in the oldest group (U-19),
x
=5.63±0.24 m/s. TheTable 5. The times of the run with dribbling at the 5th, 10th, 15th and 20th meters
group s
x
± SD 5 m F sx
± SD 10 m F sx
± SD 15m F sx
± SD 20m F U-12 1.53±0.12 2.51±0.21 3.50±0.47 4.56±0.57 U-14 1.55±0.81 2.47±0.08 3.33±0.12 4.17±0.17 U-19 1.52±0.14 0.14 2.41±0.18 3.21±0.21 1.13 3.30* 3.98±0.23 9.18** *p≤0.05 **p≤0.001Table 6. Differences between the groups at the 15th and 20th meters
s15m s20m {1} {2} {1} {2} U-12 U-14 0.326 0.029* U-19 0.037* 0.569 0.0004** 0.347 *p≤0.05 **p 0.001 ≤
Table 7. Mean and maximum velocities of the 20 m run with dribbling
group V
x
[m/s]x
± SD F Vmax(sVmax [m/s] ) U-12 5.06±0.40 5.68 (12 m) U-14 5.36±0.26 6.17 (16 m) U-19 5.63±0.24 11.58* 6.59 (20 m) *p 0.0001 ≤analysis of variances confirms that the mean velocity of the run with dribbling depends on the age of the players (F=11.58, p 0.0001), although the significance of differences between the mean velocities was confirmed only between the oldest and the youngest group (Tab. 8).
≤
The analysis of the maximum velocities showed that both in the run with and without dribbling the youngest players achieved maximum speed earlier than the older players. In the test with dribbling it was at the 12th meter of the run (Vmax=5.68 m/s). The 14 year-olds were the fastest
at the 16th meter (Vmax=6.17 m/s), and the oldest at
the 20th meter of the run (Vmax=6.59 m/s).
DISCUSSION
The analysis of the 20 m run did not reveal any significant differences in the run duration between the three age groups. The explanation for this may be the fact that all the players had a naturally higher level of maximum anaerobic power. It is widely accepted that young women develop speed abilities between 12 and 14 years of age [10], and for the next 5 years they are relatively stable [8]. Girls examined in this study have been subject to the process of selection regarding the skills necessary in basketball. Studies carried by Błajet [1] on three age groups of female basketball players (U-14, U-16 and seniors) proved that the level of maximum anaerobic power, examined by a 30-secs test on an ergometer, do not differ between the age groups. According to the author the level of maximum anaerobic power, as a factor limiting effort that might be taken in basketball, should be taken as a selective criterion at all stages of training.
Similarly, Litkowycz [6], in his study on the structure of individual predispositions and speed and strength skills at various stages of basketball training, indicates that anaerobic power is more significant in basketball players than in non-training individuals. 0,00 1,00 2,00 3,00 4,00 5,00 6,00 1 2 3 4 5 6 7 8 9 10 11 12 13 14 15 16 17 18 19 20 Distance [m ] V e lo c it y [ m /s ]
U-12 U-14 U-19 U
Figure 4. The velocity of the 20 m run [m/s] with
dribbling
Table 8. Differences in mean velocity between the
groups group {1} {2} U-12 {1} U-14 {2} 0.053 U-19 {3} 0.002* 0.106 *p≤0.01
The players examined in this study had at least 2-year-long athletic experience. According to Sozański et al. [10], if speed training starts at about the age of 10 (before puberty), it results in the largest increase in speed abilities and is most promising when it comes to its outcome.
In the second test, with dribbling, the results were different between the age groups and depended on the age (F=9.18, p<0.001). It seems that the crucial element influencing the differences were the technical skills concerning dribbling. The group of 12-year-old players achieved significantly worse results than the 14-year-olds and 17-19-year-olds, although the differences became apparent only after the 10th meter of the run. It is assumed that in the process of technical training in basketball, velocity development takes place during the directed training (13-15 years of age), when velocity and coordination exercised constitute about 50% of the general effort [11]. Therefore, the examined individuals were apparently trained in a correct fashion.
Differences in technical training were apparent also in the analysis of the velocity of the 20 m run with and without dribbling. Significant variations on subsequent meters of the run were mostly visible in the youngest group. Their mean velocity was also significantly (p 0.01) different from that of the oldest group. Differences in the mean velocity were due to differences in the players’ technical preparation.
≤
Differences in achieving maximum speed by the players are also worth noticing. The youngest group achieved maximum speed earlier than the
older players (at the 14th m without the ball, and 12th meter with dribbling). The older players achieved maximum velocity more towards the final meters of the run.
REFERENCES
[1] Błajet P., Energetyczne uwarunkowania wysiłku w koszykówce. (Energetic conditioning of physical effort in basketball), Sport Wyczynowy (Professional Sport), 1989, 3-4, pp. 65-75.
[2] Brack R., Steuerung, Regelung und Planung des Basketballtrainings (Control, Monitoring and Planning basketball training) Basketball, 1985, 16-18, pp. 20-22.
[3] Colli R., Faina M., Gallozzi C., Lupo S., Marini C., Endurance training in sport games, Magazine of sport education, 1987, 8, pp.78-86.
[4] Jóźwiak J., Próba określenia motorycznych uwa-runkowań powodzenia w grze na przykładzie młodych koszykarzy (Motor conditions of successful basketball play in young basketball players), [in:] Z. Naglak, R. Panfil, eds., Zespołowe gry sportowe w wychowaniu fizycznym i sporcie (Team games in physical education and sport) AWF we Wrocławiu (University School of Physical Education in Wroclaw), 1995, pp. 97-100.
[5] Karpowicz K., Karpowicz M., Struktura sprawności fizycznej młodych koszykarzy (Physical fitness of young male basketball players), Trening (Training), 1998, 2-3, pp. 48-56.
[6] Litkowycz R., Struktury predyspozycji osobniczych i zdolności szybkościowo-siłowych koszykarzy na różnych etapach szkolenia sportowego (Structures of individual predispositions and speed abilities in basketball players at various stages of training).
Doctoral dissertation. University School of Physical Education in Katowice, 2003.
[7] Mikołajec K., Góralczyk R., Poprzęcki S., Zając A., Szyngiera W., Waśkiewicz Z., The effects of specific conditioning on speed abilities in young female basketball players. Journal of Human Kinetics, 2003, 10, pp. 39-48.
[8] Osiński W., Wielokierunkowe związki zdolności motorycznych i parametrów morfologicznych. Ba-dania dzieci i młodzieży wielkomiejskiej z uwzględ-nieniem poziomu stratyfikacji społecznej (Multi-directional relationships of motor abilities and morphological parameters. Studies on urban chil-dren and youths, considering social stratification.) Monografie, AWF Poznań (University School of Physical Education in Poznań), 1988, 261.
[9] Roniker A., Mierniki wydajności i ich diagnozujące zastosowanie w sportowych grach zespołowych. (Measurement of effectiveness and their diagnostic role in team games), [in:] J. Bergier, ed., Nauka w zespołowych grach sportowych (Science in team games) IWFiS Biała Podlaska (Institute of Physical Education and Sport in Biała Podlaska), 1995, pp. 328-334.
[10] Sozański H., Witczak T., Starzyński T., Podstawy treningu szybkości. (The basics of speed training) Centralny Ośrodek Sportu (Main Center of Sport in Warsaw), Warszawa 1999.
[11] Zając A., Model wieloletniego procesu szkolenia koszykarzy (The model of long-term basketball training), [in:] I. Ryguła, ed., Czynniki warunkujące efektywność walki sportowej w koszykówce (Factors determining the effectiveness of play in basketball), AWF Katowice (University School of Physical Education in Katowice), 1995, pp. 111-122.
![Figure 2. The velocity of the 20 m run [m/s]](https://thumb-eu.123doks.com/thumbv2/9liborg/3116539.8834/3.892.107.798.173.373/figure-velocity-m-run-m-s.webp)