TRENDS IN SPORT SCIENCES
TRENDS
in
Sport Sciences
2017; 1(24): 19-25 ISSN 2299-9590 Received: 15 December 2016 Accepted: 23 February 2017Corresponding author: gcesar@madonna.org
GUILHERME M. CESAR1, HANNAH T. EDWARDS2, RYAN M. HASENKAMP3,
JUDITH M. BURNFIELD1
Prediction of athletic performance of male and female athletes
measured by triple hop for distance
Introduction
H
igh school, university, and professional sports teams often devote considerable resources (human and capital) to quantify an athlete’s sport potential and to train individuals to improve athletic performance. Athleticism is computed not simply by the points scored or tackles achieved, but also through metrics that eliminate the need to compensate for different levels of competition and support from teammates. Performance on screening tests such as the vertical jump, 10-yard sprint, or pro-agility shuttle run are used to help differentiate those athletes most likely to excel in a given sport from a larger cohort of skillful recruits [1]. These same performance measures can also be used to track an athlete’s response to training over short and long periods of time [2].Lower extremity strength and power can heavily factor into overall athletic performance. For example, the results of performance tests involving jumping height and running speed are largely dependent on the individual’s lower extremity strength and power production capabilities [1, 3]. When taking into account
Abstract
Introduction. Triple hop for distance (THD) is an inexpensive test used clinically to evaluate lower extremity functional performance. Given known relationships between THD and lower extremity strength and power, THD could be used as a time efficient approach for assessing athleticism. Aim of Study.
The aim of this study was to detect the extent to which THD of the dominant and non-dominant legs predict performance of vertical jump (VJ), pro-agility shuttle run, and 10-yard sprint in a large cohort of male and female collegiate athletes. Material and Methods. One hundred sixty athletes (80 men) performed VJ, 10-yard sprint, pro-agility shuttle run, and THD. Separate stepwise linear regression analyses were used to determine how THD of dominant and non-dominant legs predicted athletic performance of each test. Results. For male athletes, non-dominant leg was the best and only predictor for VJ, pro-agility shuttle run, and 10-yard sprint, explaining 42.4%, 56.6%, and 46.9% of the variance, respectively. For female athletes, the dominant leg was the best and only predictor for VJ, pro-agility shuttle run, and 10-yard sprint, explaining 42.9%, 41.5%, and 27.0% of the variance, respectively. Conclusions. THD could serve as efficient tool to predict performance on athletic tasks including jumping and sprinting. Moreover, THD could guide subsequent training interventions aimed at improving athletes’ jumping and sprinting abilities.
KEYWORDS: agility, athletic performance, sprint, triple hop for distance, vertical jump.
1 Institute for Rehabilitation Science and Engineering at
Madonna Rehabilitation Hospitals, Movement and Neurosciences Center, Lincoln, NE, United States of America
2 University of Nevada–Las Vegas, Department of Kinesiology
and Nutrition Sciences, Las Vegas, NV, United States of America
3 University of Nebraska–Lincoln, Nebraska Athletic Performance
the individual’s mass, lower extremity strength observed during a one repetition maximum squat strongly correlates with sprint velocity (r = 0.88), vertical jump (r = 0.85), and agility T-test (r = 0.81) [4]. Similarly, peak lower extremity power calculated from a vertical jump task correlates strongly with sprint velocity (r = 0.78) and agility T-test (r = 0.74) [4].
The triple hop for distance (THD) assessment is an inexpensive test used clinically to evaluate lower extremity functional performance [5, 6, 7]. Traditionally, THD has been used to evaluate knee function after ACL reconstructive surgery in return-to-sport rehabilitation protocols [8, 9]. In addition, clinicians use this test to screen for athletes at risk for ACL injuries as a preventive method [1]. THD measures the maximal horizontal foot displacement executed with three consecutive forward hops on the ipsilateral leg. In contrast to hopping tests that are performed bilaterally (e.g., broad jump), the THD allows for the identification of inter-limb asymmetries since it is performed unilaterally. The test requires lower extremity strength, neuromuscular coordination, and stability in order for the athlete to achieve maximum distance and maintain balance [8]. Significant correlations ranging from 0.70 to 0.77 have been reported between the results achieved with the dominant side leg on the THD and isokinetic quadriceps and hamstrings peak torques at different speeds for male and female collegiate soccer athletes [10].
Given that greater lower extremity strength and power are related to improved vertical jump height, sprint velocity, and agility T-test performance, and that greater isokinetic quadriceps and hamstring torque correlates positively with improved dominant limb THD, it stands to reason that the THD could be used as an efficient approach for assessing athleticism. However, it is not known whether THD predicts jumping and running capabilities during athletic performance tests. The purpose of the current study was to detect the extent to which the dominant and non-dominant legs’ THD test predicts three of the major tests of athletic performance (vertical jump, pro-agility shuttle run, 10-yard sprint) in cohorts of male and female collegiate athletes. We hypothesized that high scores on the THD would predict high scores in the three performance tests. Moreover, we hypothesized that for both male and female athletes, the THD scores of the dominant leg would exhibit a higher prediction of the performance tests when compared with the non-dominant side.
Aim of Study
The aims of this study were twofold: first, to determine whether THD was an effective tool for athletic performance;
second, to investigate the extent of which the dominant and non-dominant leg predicts athletic performance.
Methods
Participants
One hundred sixty National Collegiate Athletic Association (NCAA) Division I athletes (80 men, 80 women) participated in this study. Their characteristics (mean ± standard deviation) can be observed in Table 1. Twelve participants were left side dominant, defined by the preferred limb used to kick a ball for distance [11]. Inclusion criteria involved (1) clearance for participation from the athletic medicine staff, and (2) completion of all athletic performance tests. Participants were involved in football (n = 72), men’s basketball (n = 8), women’s basketball (n = 2), women’s soccer (n = 39), women’s volleyball (n = 31), and women’s gymnastics (n = 8). All participants provided informed consent on a form approved by the University’s Institutional Review Board.
Table 1. Participants’ characteristics (mean ± standard deviation)
Male Athletes (n = 80) Female Athletes (n = 80) Age (years) 20.3 ± 1.1 19.7 ± 1.2 Height (cm) 188.0 ± 7.5 175.0 ± 10.4 Mass (kg) 103.8 ± 18.5 72.1 ± 10.6 Procedures
Participants wore self-selected athletic footwear. Prior to testing, they warmed up for approximately 7 minutes with a series of drills involving jogging drills and dynamic stretching to full range of motion under the supervision of the team’s respective strength and conditioning coach [12]. The sequence of performance testing was the same across all participants [5]: vertical jump, pro-agility shuttle run, 10-yard sprint, and THD.
Testing apparatus
The Vertec device (Power Systems, Knoxville, TN) was used to measure vertical jump height. The Vertec is a steel-frame apparatus with horizontal vanes, which are rotated over the athlete. The vanes of the Vertec are spaced in 1.27 centimeter increments. Data were measured and recorded in centimeters (cm).
Custom-built electronic timing systems were used to record the time to complete the pro-agility shuttle run and the 10-yard sprint tests. The pro-agility shuttle run
system utilized a single laser beam located at the starting position of the test. This system started once the laser beam became initially unbroken by the athlete’s body, and it stopped once the athlete broke the laser beam the final (third) time. The 10-yard sprint system utilized an electronic timing device that initiated with the release of a button on the start line. This system stopped when the athlete’s body crossed a laser beam positioned 10 yards away from the starting line. Time data were measured and recorded in seconds (s).
Triple hop for distance was performed on the Zeno Walkway (Protokinetics, Havertown, PA). This instrumented mat is 12 meters in length (by 1 meter in width) and contains 16-level pressure sensing pads and circuitry that detects pressure data. The entirety of the mat area is filled with 1 cm square pressure sensors that sample data at 120 Hz. Spatial-temporal data can be calculated based upon the pressure data during the triple hop test. Maximum distance was measured and recorded in centimeters (cm).
Prior to the jump height testing with the Vertec, each participant’s standing vertical reach with their dominant arm was measured. Then, participants stood with their dominant hand closest to the Vertec, feet placed shoulder-width apart, and both arms raised overhead. Participants held this position for one second, at which point they were instructed to perform a single counter-movement and jump straight vertically to reach maximal height by targeting the highest possible vane on the Vertec with their dominant hand. The depth of the counter-movement was not controlled. Each participant performed the counter-movement to their comfort. Participants were allowed to practice with a second Vertec at a sub-maximal level for familiarization of procedures as many times as desired. Participants then performed three maximal jumps, and the highest jump was used for statistical analysis.
The second test was the pro-agility shuttle run. Participants straddled the start line that was aligned with the timing system’s laser beam, using an athletic 2-point stance. They were instructed to sprint 5 yards to the right, reverse direction and sprint 10 yards to the left, and reverse direction once more and sprint 5 yards back towards the center (finish) line. Participants had to touch a line on the floor at each end of the run for the test to be considered successful. Participants were instructed to perform the test as fast as possible, and the fastest trial of three attempts was used for statistical analysis.
The third test was the 10-yard sprint. Participants started in a sprinters’ stance, placing their thumb on top
of a button. They were instructed to start when ready, sprinting down a 40-yard unobstructed pathway. The fastest 10-yard time of three attempts was used for statistical analysis.
The single-leg THD test was performed on the Zeno Walkway. Participants stood on a single leg at one end of the mat. They then performed three consecutive maximal forward hops on the same limb. Arm swing was allowed. On the last hop, they were required to stick
the landing by maintaining their balance on the single
leg upon landing. Participants were allowed to practice before testing for familiarization of test procedures, but were limited to three attempts on each leg in order to prevent potential fatigue. Participants performed the test for both right and left legs in order of their choosing. If participants failed to keep their balance on the final landing or contacted the ground with the contralateral limb at any time during the task, the trial was considered a failure and they were required to perform the test again. The test was performed until one successful trial for each limb was achieved. Distance covered on the Zeno Walkway was measured from the most posterior location of the heel before the first forward hop and the location of the heel at the last landing. The maximum distance achieved was recorded in centimeters and used for statistical analysis.
Statistical analysis
Descriptive statistics were calculated and expressed as mean, standard deviation, minimum and maximum values, for each variable of interest: distance of the THD test, height of vertical jump, and time for pro-agility shuttle run and 10-yard sprint.
Separate stepwise linear regression analyses were used to determine how THD variables predict the athletic performance tests. The independent variables were the distances (in centimeters) of the triple hop for the dominant and non-dominant legs. The independent variable would enter the model if the probability of the F-ratio was less than 0.05; the independent variable was removed from the model if the probability of the F-ratio for the resulting model exceeded 0.10. Vertical jump, pro-agility shuttle run, and 10-yard sprint were entered as the dependent variable in separate models for male athletes (80 trials) and for female athletes (80 trials). Multicollinearity was tested using the test of variance inflation factor (VIF). VIF values were calculated by running artificial OLS regressions between each independent variable inputted as the dependent variable and the remaining independent variables. VIF values obtained for male and female athletes separately were
under 10, suggesting no correlation among the predictor variables [13]. All statistical analyses were performed (SPSS Inc., Chicago IL, USA) with significant levels set a priori at α = 0.05.
Results
Descriptive statistics
Descriptive statistics of the scores obtained by males and females on the THD task and the three performance tests are provided in Table 2.
Vertical jump and THD
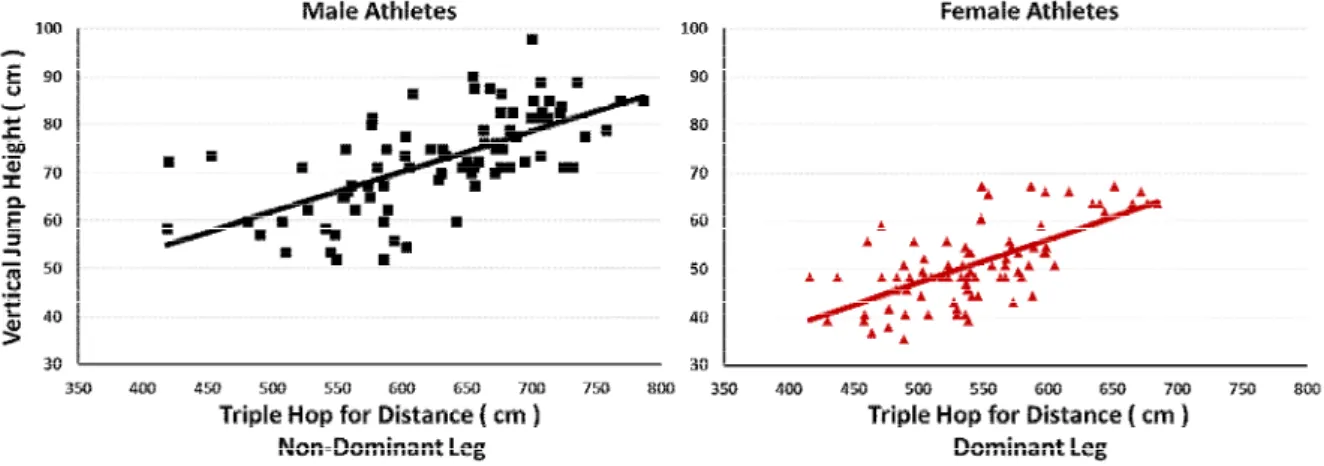
For the male athletes, the non-dominant leg was the best predictor of vertical jump height (r = 0.653; p < 0.0001; observed power, OP 0.99), explaining 42.6% (R2) of the variance (Figure 1A). The dominant
leg did not enter the model for males. For the female athletes, the dominant leg was the best predictor of
vertical jump height (r = 0.650; p < 0.0001; OP 0.99), explaining 42.2% of the variance (Figure 1B). The non-dominant leg did not enter the model for females. For both males and females, longer THD values predicted higher vertical jump heights.
Pro-agility run and THD
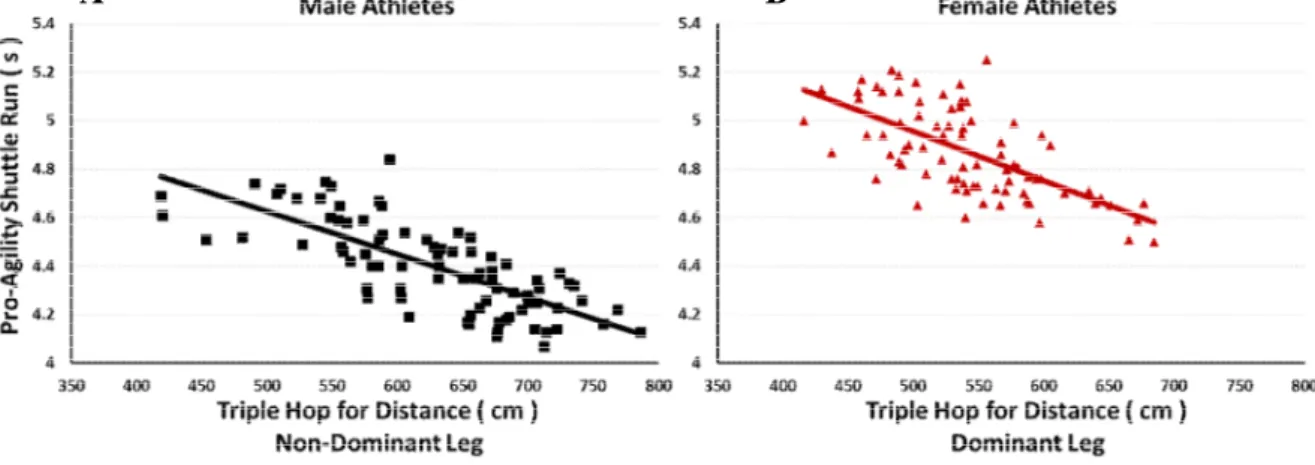
For the male athletes, the non-dominant leg was the best predictor of the time to complete the pro-agility shuttle run (r = 0.757; p < 0.0001; OP 1.0), explaining 57.3% of the variance (Figure 2A). The dominant leg did not enter the model for males. For the female athletes, the dominant leg was the best predictor of the time to complete the pro-agility shuttle run (r = 0.644; p < 0.0001; OP 0.99), explaining 41.5% of the variance (Figure 2B). The non-dominant leg did not enter the model for females. For both males and females, longer THD values predicted faster times in the pro-agility shuttle run test.
Figure 1. Relationship between vertical jump height and triple hop for distance for male athletes’
A B
Figure 1. Relationship between vertical jump height and triple hop for distance for male athletes’ non-dominant leg (left graph;
r = 0.653) and female athletes’ dominant leg (right graph r = 0.650)
Table 2. Descriptive statistics for both male and female athletes for all performance tests: Triple hop for distance (THD),
vertical jump, pro-agility shuttle run, and the 10-yard sprint
Mean ± SD Minimum Maximum
Males Females Males Females Males Females
THD, da (cm) 628.3 ± 77.2 543.4 ± 58.4 465.8 416.1 858.0 684.6 THD, ndb (cm) 627.6 ± 80.0 528.9 ± 49.3 418.4 431.8 785.9 661.5 Vertical Jump (cm) 72.8 ± 10.3 51.1 ± 8.1 52.1 35.6 97.8 67.3 Shuttle Run (s) 4.40 ± 0.19 4.87 ± 0.19 4.07 4.50 4.84 5.25 10-yard Sprint (s) 1.79 ± 0.10 1.95 ± 0.09 1.63 1.76 2.07 2.14 a dominant b non-dominant
10-yard sprint and THD
For the male athletes, the non-dominant leg was the best predictor of the time to complete the 10-yard sprint (r = 0.683; p < 0.0001; OP 1.0), explaining 46.6% of the variance (Figure 3A). The dominant leg did not enter the model for males. For the female athletes, the dominant leg was the best predictor of the time to complete the 10-yard sprint (r = 0.548; p < 0.0001; OP 0.99), explaining 30.0% of the variance (Figure 3B). The non-dominant leg did not enter the model for females. For both males and females, longer THD values predicted faster times in the 10-yard sprint test.
Discussion
Collegiate athletic programs invest substantial time, effort, and money into assessing and refining athletic
performance. Differentiating amongst a cadre of high caliber athletes and identifying those with the greatest athleticism is critical to a program’s success [4]. Re-assessments are often employed throughout the academic year to evaluate the individual’s response to the rigors of training and play. Among other screening tasks, such as running and cutting [14, 15] or landing from a jump [16, 17], the THD test has been used clinically to screen for lower extremity postural imbalances that might suggest a risk for injury [1]. The current study explored the extent to which values recorded during the THD test could also be used to predict performance on three tasks commonly used to assess athletic prowess [5, 18]. The findings suggest that the THD could be used as an efficient surrogate measure and provide robust information relevant to high caliber performance across many sports.
Figure 2. Relationship between pro-agility shuttle run and triple hop for distance for male athletes’ non-dominant
leg (left graph; r = 0.757) and female athletes’ dominant leg (right graph r = 0.644)
A B
Figure 2. Relationship between pro-agility shuttle run and triple hop for distance for male athletes’ non-dominant leg (left
graph; r = 0.757) and female athletes’ dominant leg (right graph r = 0.644)
Figure 3. Relationship between 10-yard sprint and triple hop for distance for male athletes’ non-dominant leg (left
graph; r = 0.683) and female athletes’ dominant leg (right graph r = 0.548)
B A
Figure 3. Relationship between 10-yard sprint and triple hop for distance for male athletes’ non-dominant leg (left graph;
Consistent with our initial hypothesis, THD served as a strong predictor of performance on the vertical jump, pro-agility shuttle run, and 10 yard sprint. This finding has important implications for both the efficiency and cost-effectiveness of athletic performance screening procedures in collegiate environments. First, it is possible that in some settings, the use of the THD test could replace the need to perform multiple types of assessments (i.e., jumping, shuttle run, sprinting). Given the limits placed by the NCAA on contact time with student-athletes, the use of a single test approach could help preserve contact time for other types of assessments. Additionally, less staff would be required to monitor the single THD station versus a series of stations, thus contributing to staffing efficiencies. Finally, use of only the single test could reduce space and technology requirements by avoiding the need to set-up stations employing potentially expensive technology (e.g., Vertec jump device, force plates, motion capture systems, timing switches, electronic timing gates) [18, 19, 20]. While we elected to use an instrumented mat to assess THD, this test can be done inexpensively and reliably [21] by simply pre-labeling distances on the ground where jumping will be assessed [2, 7]. In fact, we performed a pilot study and identified a nearly perfect correlation (R = 0.999) between measurements recorded simultaneously using a standard cloth tape affixed to the floor versus values recorded using the Zeno Walkway for four participants (40 hopping trials). While we had initially hypothesized that the dominant limb’s THD would serve as the best predictor of vertical jump, pro-agility, and 10-yard sprint, our results indicated this was only true for the female cohort. Interestingly, for male athletes the THD achieved with the non-dominant leg served as the best (and only) predictor for the three tasks. This finding is in contrast with a study that investigated the biomechanics and motor control of male futsal athletes kicking a ball [11]. Barbieri and colleagues [11] found that the performance of the dominant limb was superior to that observed on the non-dominant side. It is important to note the distinction between the tasks analyzed. While our task required lower limb power and control of the whole body in space for task completion, Barbieri et al.’s task involved the interaction of the lower limb with an object (i.e., the futsal ball) for task accuracy. Interestingly, the only athletes from our sample who participated in a sport where the interaction between lower limb and ball is emphasized and kicking for accuracy is practiced were female athletes, whose dominant leg was the main predictor of performance. Thus, differences in sports
and training regimens may explain the differences in lower limb symmetry. Future work exploring lower limb symmetry should investigate the effect of sex in the same sport to better understand the differences in lower limb performance to potentially maximize training programs.
Given the demands of different sports, detecting inter-limb imbalances can be of great importance to improving overall athletic performance along with decreasing potential risks of injury [6, 22]. This finding could be used to refine the program developed by strength and conditioning coaches and athletic trainers to more comprehensively address lower extremity functional strength asymmetries in order to enhance an athlete’s development. However, while targeting bilateral lower extremity improvement, one should consider the results of our study as our findings do not reflect some previous studies [6]. Improving female athletes’ dominant leg THD and male athletes’ non-dominant leg THD would be expected to positively impact overall jumping and running performance. However, our data do not establish a direct impact of THD training on athletic performance. Future studies should consider such investigation to elucidate the ability of using THD as training tool for enhancing performance and the significance of leg dominance in predicting athleticism. The capacity to evaluate each leg’s THD individually presents distinct advantages for performance screening when compared with the other athletic tasks in this study. By comparing values between the two limbs, lower extremity imbalances can be quickly identified, in contrast to the bilaterally-performed tasks that usually conceal such asymmetries. When combining this information with a strong understanding of an athlete’s sport, position, sport specific conditioning, injury history, and clinical capacity (e.g., strength, sensation, joint stability, and pain measures), performance team members should be able to develop customized training programs aimed at enhancing symmetry and/or overall capacity.
Conclusion
Our findings suggest that the THD test could serve as a cost, time, and space efficient tool to predict performance on tasks relevant to many team sports containing jumping and sprinting. In addition, data arising from the THD could guide subsequent training interventions aimed at improving an athlete’s jumping and sprinting abilities. However, our results should be interpreted with care since approximately half of the variance on all tests was not explained by the distance achieved in the THD test alone. Future studies considering different single-leg hopping
tests, or additional athletic performance tests, are needed to determine if the relationships found in our current study are indeed reflective of a true relationship between athleticism and the distance achieved in the THD.
References
1. Hoog P, Warren M, Smith CA, Chimera NJ. Functional hop tests and tuck jump assessment scores between female division I collegiate athletes participating in high versus low ACL injury prone sports: a cross sectional analysis. Int J Sports Phys Ther. 2016; 11(6): 945-953. 2. Manske RC, Smith BS, Rogers ME, Wyatt FB. Closed
kinetic chain (linear) isokinetic testing: relationships to functional testing. Isokinet Exerc Sci. 2003; 11: 171-179. 3. Lawrence EL, Cesar GM, Bromfield MR, Peterson R,
Valero-Cuevas FJ, Sigward SM. Strength, multijoint coordination, and sensorimotor processing are independent contributors to overall balance ability. Biomed Res Int. 2015; 2015: 561243.
4. Peterson MD, Alvar BA, Rhea MR. The contribution of maximal force production to explosive movement among young collegiate athletes. J Strength Cond R. 2006; 20(4): 867-873.
5. Edwards H, Van Lent A, Rasmussen CM, Burnfield JM, Cesar GM. Triple hop for distance as a measure of athletic performance. Med Sci Sports Exerc. 2016; 48(5 Suppl 1): 1043.
6. Maulder P, Cronin J. Horizontal and vertical jump assessment: reliability, symmetry, discriminative and predictive ability. Phys Ther Sport. 2005; 6: 74-82. 7. Reid A, Birmingham TB, Stratford PW, Alcock GK,
Giffin JR. Hop testing provides a reliable and valid outcome measure during rehabilitation after anterior cruciate ligament reconstruction. Phys Ther. 2007; 87(3): 337-349.
8. Barber SD, Noyes FR, Mangine RE, Mccloskey JW, Hartman W. Quantitative assessment of functional limitations in normal and anterior cruciate ligament-deficient knees. Clin Orthop Relat R. 1990; 255: 204-214. 9. Noyes FR, Barber SD, Mangine RE. Abnormal lower
limb symmetry determined by function hop tests after anterior cruciate ligament rupture. Am J Sport Med. 1991; 19(5): 513-518.
10. Hamilton RT, Shultz SJ, Schmitz RJ, Perrin DH. Triple-hop distance as a valid predictor of lower limb strength and power. J Athl Training. 2008; 43(2): 144-151.
11. Barbieri FA, Gobbi LT, Santiago PR, Cunha SA. Dominant-non-dominant asymmetry of kicking a stationary and rolling ball in fusal context. J Sports Sci. 2015; 33(13): 1411-1419.
12. Cesar GM, Tomasevicz CL, Burnfield JM. Frontal plane comparison between drop jump and vertical jump: implications for the assessment of ACL risk of injury. Sports Biomech. 2016; 15(4): 440-449.
13. Maddala GS. Introduction to Econometrics. Upper Saddle River: Prentice-Hall; 2000.
14. Cesar GM, Havens KL, Chang YJ, Sigward SM. Effects of cut angle and online processing on cutting maneuvers. In: American Society of Biomechanics Annual Conference; 2011.
15. Sigward SM, Cesar GM, Havens KL. Predictors of frontal plane knee moments during side-step cutting to 45 and 110 degrees in men and women: Implications for anterior cruciate ligament injury. Clin J Sport Med. 2015(6); 25: 529-534.
16. Cesar GM, Pereira VS, Santiago PR, Benze BG, da Costa PH, Amorim CF, Serrão FV. Variations in dynamic knee valgus and gluteus medius onset timing in non-athletic females related to hormonal changes during the menstrual cycle. Knee. 2011; 18(4): 224-230.
17. Pollard CD, Sigward SM, Powers CM. Limited hip and knee flexion during landing is associated with increased frontal plane knee motion and moments. Clinical biomechanics. 2010; 25(2): 142-146.
18. Leard JS, Cirillo MA, Katsnelson E, Kimiatek DA, Miller TW, Trebincevic K, Garbalosa JC. Validity of two alternative systems for measuring vertical jump height. J Strength Cond Res. 2007; 21(4): 1296-1299.
19. Earp JE, Newton RU. Advances in electronic timing systems. J Strength Cond Res. 2012; 26(5): 1245-1248. 20. Glatthorn JF, Gouge S, Nussbaumer S, Stauffacher S,
Impellizzeri FM, Maffiuletti NA. Validity and reliability of optojump photoelectric cells for estimating vertical jump height. J Strength Cond Res. 2011; 25(2): 556-560. 21. Ross MD, Langford B, Whelan PJ. Test-retest reliability
of 4 single-leg horizontal hop tests. J Strength Cond Res. 2002; 16(4): 617-622.
22. Myers BA, Jenkins WL, Killian C, Rundquist P. Normative data for hop tests in high school and collegiate basketball and soccer players. Int J Sports Phys Ther. 2014; 9(5): 596-603.