USING SUSTAINABLE TRANSPORT VIRUS
ANALY-SIS TO IDENTIFY LOGISTICS PROBLEMS
IN A TRANSPORT SYSTEM OF FLOAT GLASS
MANU-FACTURER
Piotr Cyplik*, Rafal Pierscinski** and Łukasz Hadaś***
* Faculty of Engineers Management, Poznan University of Technology, Poznan, 60-965, Poland, Email: piotr.cyplik@put.poznan.pl
** Faculty of Engineers Management, Poznan University of Technology, Poznan, 60-965,
Poland, Email:r.pierscinski@uroglas.com
*** Faculty of Engineers Management, Poznan University of Technology, Poznan, 60-965, Poland, Email: lukasz.hadas@put.poznan.pl
Abstract Identification and analysis of problems occurring in implementation of sustainable
logistics is a very crucial stage in the process of improving the functionality of all companies which decided to follow the sustainable development strategy. This conceptual process framework has been developed and successfully used within the frames of a project aimed at improving the logistics system of one of the Polish a float glass manufacturer. Problem identification and analysis tool of organization of sustainable transport and production processes developed within this project has been called Sustainable Transport System Virus Analysis (STVA). In this paper basic assumptions and methodology of the tool developed by the Authors have been included.
Paper type: Research Paper Published online: 09 July 2014
Vol. 4, No. 3, pp. 267-277 ISSN 2083-4942 (Print) ISSN 2083-4950 (Online)
© 2014 Poznan University of Technology. All rights reserved.
1. INTRODUCTION
An efficient transportation system, as the core component of distribution and sourcing system, is one of the key elements of competitive advantage of compa-nies. An effective transport system is a driving force for efficient functioning of both the company itself and the supply chain, in which the company is involved. It should be also noted that introducing changes to logistic processes ought to be consistent with the concept of sustainable development. It implies that sustainable development allows for addressing the company’s current needs in such a manner so as not to hinder the fulfillment of the same or potential requirements that may arise. As regards conducting business activity, this concept involves balancing three planes: economic, ecologic and social. Heterogeneity and variegated array or problems in the transportation system, both internal and external, makes identi-fication of key problems, which determine the effectiveness of the entire company. Unfortunately, not all companies may regard their transportation and, consequent-ly, distribution systems as effective. Therefore they put in place long-term correc-tive measures. Streamlining the transportation system is by definition complex and difficult. Heterogeneity and variegated array or problems in the transportation sys-tem, both internal and external, makes identification of key problems, which de-termine the effectiveness of the entire company. The analysis performed by the aut-hors may be a useful tool for identifying and analysing such problems within the context of sustainable development. The tool discussed in this paper has been developed and successfully implemented as part of works aimed at facilitating the transportation system in one of the largest a float glass manufacturer.
2. THEORETICAL BACKGROUND
The first step to be taken in every improvement-oriented action is to understand the business process in question. One of the tools used to understand a business process is mapping, which serves several purposes. Firstly, it ensures good under-standing of the process elements – actions, results and participants. Secondly, it helps to define the process scope and to separate it from adjoining processes. Thirdly, it stands as a point of reference, against which improvement is measured (Bozarth & Handfield, 2006). Besides process mapping, companies must adopt more formalized procedures to be certain that a problem has been diagnosed cor-rectly. Root cause analysis is a technique which involves brainstorming, intended to identify potential causes of problems in the first place, then collecting data and analyzing it in an organized fashion, narrowing down the area of interest to several root causes. Causal maps are one of the tools for root cause analysis. In operations management literature causal maps are known under many names: Ishikawa (fish-bone) diagram, impact wheel analysis, issue trees, strategy maps, risk assessment
mapping tools (FMEA) and cause and effect diagrams. Cause and effect maps are often used in business. Input data for causal maps should come from the enter-prise, and could be captured through, as has been mentioned above, brainstorming technique or personal interviews. Compare in Chmeilewski and Dansereau (1998), Cyplik, Hadaś and Fertsch (2009), Hajdul and Guszczak (2009), Hugos (2003), Kumar (2000), Franceschini and Galetto (2001), Zak (2005).
3. SUSTAINABLE TRANSPORT SYSTEM VIRUS ANALYSIS
(STSVA) METHODOLOGY
STSVA is a practical conceptual framework for identifying and analyzing prob-lems faced by a transportation system. The end product of implementing individual stages of this analysis is creating the Sustainable Transport System Problems Virus. The virus attacks healthy tissue of a transport system and causes their death or transforms them into hybrids that fall short of fulfilling the basic functions they are supposed to fulfil. Infected tissues hamper the functioning of a transport sys-tem, which leads to its impaired efficiency. Therefore, an unambiguous identifica-tion of the problems virus is a key to its total eliminaidentifica-tion or, at least, the limitaidentifica-tion of its activity, which enhances the effectiveness of transport system. STSVA meth-odology implies passing through the 6 subsequent stages:
1. Defining the objective of changes, 2. Appointing a team of experts, 3. Determining performance measures, 4. Identifying problems,
5. Statistical analysis of identified problems, 6. Designing the transport system problem virus.
Each of the stages will be elaborated on below.
3.1.Defining the objective of changes
Problem analysis is most often the first stage of implementing a transport system streamlining project, hence the fundamental role of clear identification of changes in applying STSVA. Such decisions fall within the scope of the company Management Board.
3.2.Appointing a team of experts
A panel of experts should be appointed during direct workshops based on brain-storming techniques with a view to identifying and analyzing problems in a transport system. This panel should include employees directly involved in a transport process,
as well as staff from auxiliary areas. The broader the scope of the company functioning covered, the more effective the problem identification process in a transport system. With the members of such a team having competence in all areas of the company’s operation, any problems arising on the border of transportation and other functional areas will be for certain identified and analysed. It is possible to divide the panel of experts into smaller groups to run the problems identification workshops based on the brainstorming technique.
3.3. Determining performance measures
The objectives of process changes should be measurable. It is therefore neces-sary to evaluate the advantages of improvements intended to enhance the efficiency of a transport system in a selected company. At this stage the main performance measures of a transport system should be selected, which will constitute a measur-able effect of improvements to be carried out. A large number of measures may entail certain problems in this case. However, top managers are expected to be able to take right decisions and choose at the maximum 10 major performance measures in a transport system, reflective of the current state of affairs and future changes in the broadest context possible, including sustainable development. Determining performance measures means defining measurable managerial value drivers.
3.4. Identifying problems
Identifying problems of a transport system within STSVA implies two stages: • Workshops involving a panel of experts, where problems in a transport
system are being identified based on the brainstorming technique.
• Drawing and analyzing maps of processes based on well-known tools for developing such elements.
Based on identified problems, the panel of experts should determine the impact of each diagnosed problem on the objective of the change project and its parame-ters as defined in the previous stage of the STSVA model implementation. It is re-commended to apply relative dispersion rate index to unambiguously determine compliance among the experts.
3.5. Statistical analysis of identified problems
Statistical analysis of identified problems is a stage at which problems reported at the workshop by the Team of Experts are subject to grouping and preliminary analysis. What is examined here is the impact of defined problems on individual parameters of success, determined within the third stage of the STSVA model. Analyses are performed using statistical tools, such as: histograms, bar charts etc.
Thus prepared data is utilized in the second stage, which is analysing the current situation and finding root causes.
3.6. Designing the Transport System Problem Virus
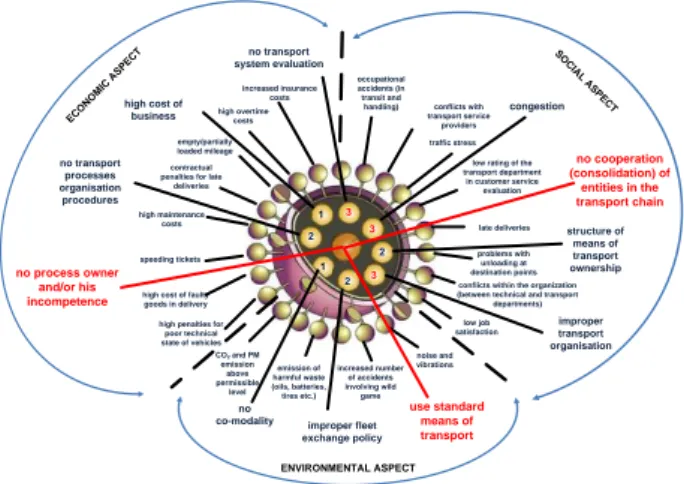
The aim of this stage is to find root causes underlying the current situation by de-signing the Sustainable Transport System Problem Virus. In line with the STSVA methodology, this task involves examining the material compiled in earlier stages. The virus consists of:
• central part referred to as the nucleus, • internal coating,
• external coating.
External coating has protrusions on its surface, representing the symptoms of prob-lems which appear in the process of production. It has been divided into 3 zones illus-trating the aspects of sustainable development of a company (economic, social and environmental). Each of highlighted zones stands up for the symptoms of problems suffered by a company.
Internal coating contains the major problems, manifested by symptoms identified in the external coating. As a single problem may be seen as economic, social and envi-ronmental, the authors have decided to introduce an additional measure – problem density (ρ). Maximum problem density is 3, minimum – 1 (value 1 means that the identified problem has an adverse impact on the company’s functioning in only 1 of 3 aspects of sustainable development; 2 indicates negative influence in 2 out of 3 aspects, and, 3 denotes that all 3 aspects of sustainable development in the company’s functioning are adversely affected).
The virus nucleus symbolizes root causes – fundamental problems within the organization. Their elimination will deactivate the entire virus. Although the mem-bers of the problem identification team may seem to have discovered the root cause, their views must be verified before they proceed to design a process stream-lining solution. A real data analysis based on the tools such as correlation dia-grams, control sheets, Pareto analysis, performance measure analysis and a tool for logical inference tool will allow approval or rejection of the diagnosed root cause (Bozarth & Handfield, 2006).
4. EMPIRICAL VERIFICATION OF STSVA TOOL
The tool for identifying and analysing problems in a transport system, designed by the authors, has been implemented as part of a transport system streamlining pro-ject in one of the main Polish a flat glass manufacturer. Production is performed in standard way, typical for this branch and flat glass of „float” type. Long and thin
band of glass is pulled on several hundred meters long production line which provides best quality of glass produced. Next, glass is cut, sorted for predefined assortment groups and stored in specialist cases waiting for completation and transported to final customers. The transport system of the entity under inspection is in many aspects a typical representative of companies operating in this manner. Transport is organized using own means of transport. The main objective of the transport system functioning is to meet all transport needs, which is to supply goods to the markets. The anticipated effect of the STSVA tool was the identification of key transport system problems in the context of sustainable development, and then their elimination. Such a measure was intended to improve the financial standing of the company by better using the potential of managerial value drivers.
4.1. Defining the objective
The main objective of streamlining project in the company under analysis was to design solutions which would enhance the effectiveness of the transport system. Such an improvement requires that the concept of improvement of the transport sys-tem’s effectiveness be defined in the first place. Therefore, an efficient transport system may be construed as a set comprising the means of transport, point and linear transport infrastructure, people, as well as principles of its functioning. Those rules govern the moving of people and goods from points of departure (dispatch), through potential reloading points right to end points (receipt). The rules of functioning are the rules of movement organisation. The main objective of transport system functioning is an efficient organisation of transport processes by effective use of means of transport independently and in combination, which will result in an optimal and sustainable use of resources (Hajdul & Guszczak, 2009), (Hajdul & Cyplik, 2009).
4.2. Appointing a team of experts
A panel of experts (Project Team) has been appointed to analyze and identify problems in the transport system of the analyzed company at direct workshops, which were carried out based on brainstorming techniques. The Project Team has been divided into 3 groups:
• Steering Committee – the company’s Management Board,
• Core Team – 20 key employees of the company, in charge of the main and auxiliary processes in the field of manufacturing, including, among others: Transport Manager, Service Manager, Production Manager, Sales Manag-er, Purchasing Department Manager etc.
• Support Team – 8 employees in charge of auxiliary processes, including: Chief Accountant, HR Manager, Stock Department employee, Head of En-vironmental Protection Management and Safety at Work Team etc.
Each of the groups described above had an equal share of influence on the final re-sult of the works. The division into smaller groups was related to a more effective con-duct of workshops based upon brainstorming technique. The full approval of decisions made by other groups falls within the competence of the Steering Committee. Such a cross-section of employees, covering all areas of the company’s operations, will ensure the identification and analysis of problems in the transport system in a broad context of the impact they exert on the overall performance of the company.
4.3. Determining performance measures
From a number of indicators used to assess streamlining in the transport system of the analysed company 9 were selected. It was not a random choice. The main criterion was the verification of a co-modal approach in the transport processes organization, which implies an efficient use of various means of transport, inde-pendently and in combination, for the purpose of optimum and sustainable exploi-tation of resources. The word optimum should be understood on both economic and service level, as well as with regard to social and environmental concerns. Among others, there are financial measures, safety at work measures, innovation measures, customer service and environmental measures. The group of selected measures comprises: Load factor (LF), Transport cost of single pallet (TCP), Transport cost in value of delivery (TCVD, Indicator of Faulty Goods In Delivery (IFGD), Average Fuel Used per Truck (AFUT), Worktime of single trailer (WToT), Reliability of Transport Service Provider (RTSP), Indicator of Introduc-tion (IoI), Indicator of Health and Safety at work (IHSW).
4.4. Identifying problems
A list o problem which occurs in the transport system was defined during work-shops at which brainstorming techniques were put to use. In the course of these workshops the Project Team identified as many as 186 problems. For each of them the degree of severity was measured, indicative of the impact they had on the ful-filment of the project objectives (selected from 4 options: very high - VH, high - Hi, medium - Me, low - Lo) according to the measures – compare Table 1. Identi-fied problems covered all the areas of the company’s operations, which was due to the right selection of employees for the Team of Experts. The conformity among the experts was defined by means of the relative dispersion measure.
4.5. Statistical analysis of identified problems
All the problems reported in the course of workshops were subject to a more de-tailed analysis. Table 1 below presents identified problems along with the
differ-ences in their impact on the measures (LF, TCP, TCVD, IFGD, AFUT, WToT, RTSP, IoI, IHSW) and the category (severity) they were ascribed.
Table 1 Problem statistics
LF TCP TCVD IFGD AFUT WToT RTSP IoI IHSW Total*
VH 19 18 8 9 1 17 2 2 3 79
Hi 45 23 54 14 1 45 2 9 4 197
Me 11 3 12 5 0 9 1 4 3 48
Lo 0 0 1 1 0 0 0 0 1 3
Total 75 44 75 29 2 71 5 15 11 327
* The total number of problems presented in the table above does reflect the actual number of problems identified in the course of the workshops. 186 problems were identified. The number in the table reflects the fact that problems may influence more than one measure.
It follows from the table above that problems in the Important category (60 per cent) constitute the largest group. The second largest group involves problems classi-fied as Very Important (24 per cent). Other problems constitute only 16 per cent. Thus, it is evident that the classic Pareto principle was applied – approximately 20 per cent of all the problems were regarded as very important. According to the estimates, solving these problems will enable the realization of 80 per cent of assumed effects.
4.6. Designing Sustainability Transport System Problem Virus of
the company
The conclusions drawn in earlier stages were the basis for designing the “Sustainable Transport System Problems Virus” of the analysed company in compliance with methodology described in part 2 – see Figure 1.
high penalties for poor technical state of vehicles high cost of faulty goods in delivery speeding tickets high maintenance
costs contractual penalties for late
deliveries high overtime costs empty/partially loaded mileage increased insurance costs occupational accidents (in transit and
handling) conflicts with transport service providers
low rating of the transport department in customer service evaluation problems with unloading at destination points late deliveries traffic stress
conflicts within the organization (between technical and transport
departments) low job satisfaction CO2 and PM emission above permissible level emission of harmful waste (oils, batteries, tires etc.) noise and vibrations increased number of accidents involving wild game no transport processes organisation procedures high cost of business congestion improper fleet exchange policy no transport system evaluation improper transport organisation structure of means of transport ownership no co-modality no process owner and/or his incompetence no cooperation (consolidation) of entities in the transport chain use standard means of transport 2 1 3 2 3 1 2 3 ENVIRONMENTAL ASPECT ECO NO MIC AS PEC T SOC IA L ASP EC T
The main goal the company pursues is to produce and sell goods at a profit. The task of the transport system is to support this goal as rationally as possible. Nevertheless, the analysis makes it clear that the company faces a wide range of management-related problems. The most important are the flow of information, the division of competences (capacity to make decisions) and an overall model of planning and organizing transport processes. Another problem is use of standard transport means instead of dedicated especially for the glass branch. All described problems translate into high costs of logistics organization processes and, conse-quently, reduce the company’s final profit. The need to introduce changes in the company is hence evident, to begin with implementing a model of transport processes organization, precisely defining the scope of responsibilities and the man-ner of task execution. At present the analysed company fails to learn from its mis-takes. Errors are multiple and recurrent (a track record of irregularities). The density (ρ) of major problems identified in the course of the analysis supports the assumption that some problems may be perceived as important from the point of view of all 3 aspects of sustainable development. They involve the lack of transport system as-sessment as well as congestion and improper organization of transport. Performance measure analysis was also conducted to verify the idea behind the designed virus. As many as 30 indicators were analysed, which described economic, technical, social and environmental aspects of transport system (including TCP, TCVD, IFGD, AFUT, WToT, RTSP, IoI, IHSW measures described as performance measures). Less than 50 per cent out of examined 15 indicators failed to meet the objectives set for them (including 6 out of 8 performance measures). The re-sults of conducted analysis demonstrated that the virus was designed correctly.
5. CONCLUSIONS
The company’s situation can be remedied by returning to long-established, yet still up-to-date principles of good practice – corporate order. The employment of praxeology practices in management will allow the company to enhance the ef-ficiency of its processes and, simultaneously, understand the implications of suc-cesses and failures of individual actions. Destroying the virus responsible for the ineffectiveness of the transport system depends on destroying the reasons constitut-ing its core – root causes. They are the followconstitut-ing:
• Using standard means of transport instead of dedicated for the branch, • No process owner and/or his incompetence,
• No cooperation in consolidation.
Dedicated means of transport used in glass branch cannot be used in other branches as their specialization is high and consequently they generate high cost. Simultaneously in extensively competitive environment, need for increasing cus-tomer-service standards and global economy, supply chain stakeholders strive for
improving their market position with using more efficient transport means and keeping their cost at the lowest possible level. Costs of transport are very important for glass industry because of its specific characteristics and reach even several doz-en percdoz-ent of value of products sold. Ability to apply modern specialists semi-trailers can provide substantial savings of transport costs at the same time resulting in shortened lead time. Introduction of such vehicles will result in decrease in as-sortment number which will additionally improve warehousing process – improv-ing customers’ service level. Accordimprov-ing to data provided by semi-trailers manufac-turer creating new standards in glass industry coherent with specification for new means of transport which is supposed to provide (www.vanhuet.com):
• Lower transport cost for m²/t of glass, • 23 % higher load capability,
• 23 % lower emission of CO2, • 23% less outsourcing necessity.
Two other core reasons can be eliminated with organizational changes inside the company.
REFERENCES
Bozarth, C.C. & Handfield, R.B. (2006), “Introduction to Operations and Supply Chain Management”, Pearson Prentice Hall.
Chmeilewski T.C. & Dansereau D.F., (1998), “Enhancing the recall of text: Knowledge mapping training promotes implicit transfer”. Journal of Educational Psychology, 90 (3), pp. 407-413.
Copeland, T., Koller, T. & Murrin, J. (1996), “Valuation – Measuring and Managing the Value of Companies”, 2nd Ed., New York, NY: McKinsey & Company, Inc., John Wiley & Sons.
Cyplik P., Hadaś Ł. & Fertsch M., (2009), “Production planning model with simultaneous production of spare parts”. International Journal of Production Research vol. 47, No. 8, 15 April 2009, pp. 2091-2108.
Cyplik P. & Hajdul M. (2009), “Efficient planning of transport processes which takes into consideration trade-offs relations with inventory management”, M. Fertsch, K. Grzybowska, A. Stachowiak (Eds.), Modelling of modern eneterprises logistics, Poznań, Wydawnictwo Politechniki Poznanskiej, pp. 61-70.
Franceschini, F. & Galetto M. (2001). A new approach for evaluation of risk priorities of failure modes in FMEA, International Journal of Production Research, 39 (13), pp. 2991- 3001.
Hajdul M. & Guszczak B. (2009), “Knowledge transfer as an element of streamlining transport processes In business activities”. M. Fertsch, K. Grzybowska, A. Stachowiak (Eds.), Modelling of modern eneterprises logistics, Poznań, Wydawnictwo Politechniki Poznanskiej, pp. 39-48.
Hugos, M. (2003), “Essentials of Supply Chain Management”, John Wiley & Sons, Inc., New Jersey.
Żak J. (2005). “Wielokryterialne wspomaganie decyzji w transporcie drogowym”, Wydawnictwo Politechniki Poznańskiej, Poznań, pp. 39-40.
BIOGRAPHICAL NOTES
Piotr Cyplik is an adiunkt at the Faculty of Engineering Management in Poznan
University of Technology. Specializes in stock management, procurement and production organization and shop floor control of production processes. Author of about 70 scientific publications in this thematic area, both in national and foreign journals. Their relationships with business practice as a consultant building projects reorganization of inventory management system and production systems. Manager and main participant in many consulting projects for e.g. Polkomtel S.A., Grundfos Pompy Sp. z o.o., Opoczno S.A., Grupa Paradyż, PEPSI-COLA General Bottlers Poland Sp. z o. o., Leszczyńska Fabryka Pomp Sp. z o.o., Kompania Piwowarska S.A.
Rafal Pierscinski is a long-time practitioner in the area of logistics. He was a
pro-ject manager in many logistics propro-jects. He has a ELA's cetryfikat at Junior Level confirming professional competence in the area of logistics.
Piotr Cyplik is an adiunkt at the Faculty of Engineering Management in Poznan
University of Technology. Specializes in logistics and procurement and production organization and shop floor control of production processes. Author of about 80 scientific publications in this thematic area, both in national and foreign journals. Their relationships with business practice as a consultant building projects reorganization of production systems in the creation of dedicated solutions including hybrid MRP / TOC, MRP / JIT and transformation of planning and shop floor control system from the logic of the push to pull.