TRENDS
in
Sport Sciences
2014; 1(21): 39-45. ISSN 2299-9590Objectives. Capillary blood sampling is less invasive than venous blood sampling; it is also often used in diagnosis of athletes. The hematological parameters are useful for general health assessment and adaptation of the athlete’s body to physical activity. Methods. The study was carried out on 40 healthy athletes (21 females and 19 males). Resting venous and capillary blood were obtained by fingerstick and collected to adequate tubes containing K2-EDTA as an anticoagulant. Blood analysis was performed using an 18-parametric hematology analyzer. The obtained measurement results were then compared. Blood cell count and hemoglobin concentration measurements involved the hematocrit correction formula which takes into consideration differences of plasma volumes in tested tubes. Results. The obtained results show that differences between hematological indicators were not statistically significant except for the mean corpuscular volume (MCV; p < 0.05), which was lower, and the mean platelet volume (MPV; p < 0.001), which was higher in the capillary blood, respectively. The involvement of hematocrit correction formula showed a lower granulocytes count (p < 0.05) and platelet count (p < 0.01) in the capillary blood. Differences between the indices ranged from 0.04 to 3.79 percent. Conclusions. The obtained hematological parameters of venous and capillary blood show comparable values. Assessment of athletes’ health can be based on an analysis of hematological parameters using a less invasive method of capillary blood sampling.
KEY WORDS: erythrocyte count, leukocyte count, thrombocyte count, leukocyte subpopulations, hematocrit index, differences of the hematocrit value, blood collecting.
Received: 5 October 2013 Accepted: 23 December 2013
Corresponding author: podgorski@awf.poznan.pl
University School of Physical Education, Department of Biochemistry, Poznań, Poland
What is already known on this topic?
Comparative studies of hematological parameters in venous and capillary blood have been carried out in clinical trials. There are, however, discrepancies regarding the results of such measurements in the available scientific literature. Little is known about this kind of research among athletes.
Introduction
T
he hematological analysis of blood is one of the most important elements of health control as well as athlete training. Regular monitoring of blood allows early detection of signs of inflammation or iron deficiency anemia. State-of-the-art hematology analyzers have the ability to determine multiple parameters in a small blood volume. It is now possible to perform a hematological analysis in a volume of 10 ml of whole blood within a few minutes of blood sample collection. This, in turn, allows for an immediate interpretation of the results and their consideration for athletes’ training program. Differences in the composition of venous and capillary blood result primarily from the applied method of blood collection. Venous blood is collected using a needle and syringe or vacuum tube systems. The obtained material comprises whole blood directly from the venous bed.Comparison of hematological parameters of venous and
capillary blood in athletes
40 TRENDS IN SPORT SCIENCES March 2014 The capillary blood in contrast to the venous blood is
a mixture of arterial and venous blood because it comes from capillary vessels. In addition, during collection of capillary blood by fingerstick or from the earlobe some of tissue fluid may seep to the test tube from puncture-damaged tissues. Research has shown that differences in biochemical indices are in most cases non-significant [1], or display a permanent decreasing or increasing tendency. For example, the concentration of glucose is higher in the capillary blood [2], which should be taken into account when interpreting laboratory results. In contrast to this finding inverse differences were observed relative to the concentration of uric acid and sodium [3]. These differences might be taken into account in each case when comparing results from different blood drawing locations. In the case of biochemical factors, these differences do not exceed a few percent, and only in the case of certain enzymes, such as alanine aminotransferase (AlAT) or creatine kinase (CK) they can be higher than 30%. During the hematology investigation some rules should be followed at the time of blood collection and processing of the blood sample prior to the measurement by the hematology analyzer. Drawing venous blood using a syringe should be performed with great care when pulling the plunger. An excessively vigorous movement may result in the formation of negative pressure that causes damage to the cells, may lead to hemolysis and falsify the obtained results. The velocity of plunger pull is also dependent on the diameter of the used needle. When the needle diameter is small then the filling of the syringe with blood should be appropriately slower. The brawn blood from the syringe should be immediately transferred to an appropriate tube containing a proper anticoagulant, usually K2-EDTA or K3-EDTA [4], and precisely and gently stirred to prevent any clot formation. Capillary blood sampling by fingerstick is more widespread in the regular diagnosis of athletes’ health. Before proceeding to blood collection some restricted procedures should be adhered to including adaptation of the appropriate temperature of the hand. This prevents excessive pressure on the puncture of the fingertip in the process of blood collection to the appropriate test tube. Too intense pressure on the surface of the fingertip leads to the replacement of tissue fluids in the investigated biological material in the test tube and thus may falsify the laboratory results. The use of lancets with an optimal penetration of the tissue allows an unhampered flow of the capillary blood, and the minimal pressure on the fingertip surface prevents the occurrence of hemolysis
of erythrocytes. After collection blood should be gently mixed with the anticoagulant dusted inside a tube. The basic principle is to collect the appropriate blood volume in accordance with the manufacturer’s requirements into tubes designed to maintain a proper proportion between the amount of blood and the anticoagulant. The hematological analysis of blood must be performed within two minutes of collection of the biological material in order to avoid the phenomenon of EDTA-dependent pseudotrombocytopenia [5]. This disorder causes an aggregation of platelets (thrombocytes), which reveals a decrease in the number of platelets, and inflated leukocytes count as read by the hematology analyzer [6]. Although the frequency of this phenomenon is rare, i.e. from 0.09% to 0.21% of the population [7], it should be taken into account during laboratory assays.
The aim of the study was to determine the relationship between hematological parameters obtained from athletes’ venous and capillary blood marked with an automated hematology analyzer.
Material and Methods
Participants
The study involved 40 physically active, non-smoking subjects (21 females and 19 males). They were athletes of different sports including fitness exercises (n = 16), basketball (n = 5), soccer (n = 3), volleyball (n = 2), handball (n = 2), long-distance running (n = 2), triathlon (n = 2), short-distance swimming (n = 2), field hockey (n = 2), canoeing (n = 1), judo (n = 1), cycling (n = 1) and gymnastics (n = 1). The research was approved by the Bioethics Committee of the Poznań University of Medical Sciences in Poland. Each participant was informed about the procedures and gave their written consent to participate in the study.
Procedures
The athletes were subjected to basic anthropometric measurements (body height and body mass) using a WPT 60/150 OW medical balance (Radwag®, Poland). Body
mass index (BMI) was calculated for each participant. Anthropometric parameters are shown in Table 1. The measurements were taken in the afternoon from 12 p.m. to 2 p.m. Prior to blood sampling, in order to identify the state of subjects’ health, blood pressure and heart rate were determined using both hands with the Marshall MB02 pressure measuring equipment (Omron Matsusaka Co, Japan). Physiological parameters are shown in Table 2.
Blood Sampling
The biological material was collected by qualified professional laboratory staff. All the safety rules were strictly adhered to during the time of blood collection. Capillary blood was collected from the ring, non-dominant fingertip, using a disposable lancet-spike Medlance® Red (HTL-Zone, Germany) with a 1.5 mm
blade and 2.0 mm penetration depth. The material volume of 300 ml was collected into a Microvette® CB
300 tube (Sarstedt, Germany) containing K2-EDTA (EDTA dipotassium salt) as an anticoagulant. The venous blood (5 ml) was collected from the ulnar vein of the non-dominant hand using a 20 G x 1½″–0.9 x 40 mm needle (Terudo®, Belgium) into a Luer slip syringe
(BD® II Discardit, Spain). The drawn blood (1 ml) was transferred into a tube (Profilab®, Germany) containing
dusted K2-EDTA (dipotassium salt of EDTA) as an anticoagulant. The blood in both tubes was gently mixed and analyzed within 5 minutes of collection in order to avoid the occurrence of EDTA-dependent pseudotrombocytopenia.
Hematological Analysis
The analysis of both blood samples was carried out with the use of an 18-parametric automated hematology analyzer Mythic® 18 (Orphée, Switzerland). The reader
aspirated only 9.8 μl of blood during the measurement. The differences between the hematocrit values in both samples were calculated with regard to the number of cellular components such as leukocytes, granulocytes,
lymphocytes, monocytes, erythrocytes, platelets counts and hemoglobin concentration. This calculation was based on the hematocrit value to a hypothetical level of 0.500 (50%). The values of these parameters were determined according to the formula:
calculated parameter value = measured parameter value · 0.500 measured hematocrit value
Statistical Analysis
Results were presented as means and standard deviations (SD) using the Statistica 10.0 software package (StatSoft. Inc., USA). The differences between the sample values obtained at different locations were performed using the Wilcoxon test. Correlations between the values from the venous and capillary blood samples were determined using multiple regression. Correlations were calculated using Pearson’s correlation coefficient R2. Statistical
significance for was set at 95.0% (p < 0.05).
Results
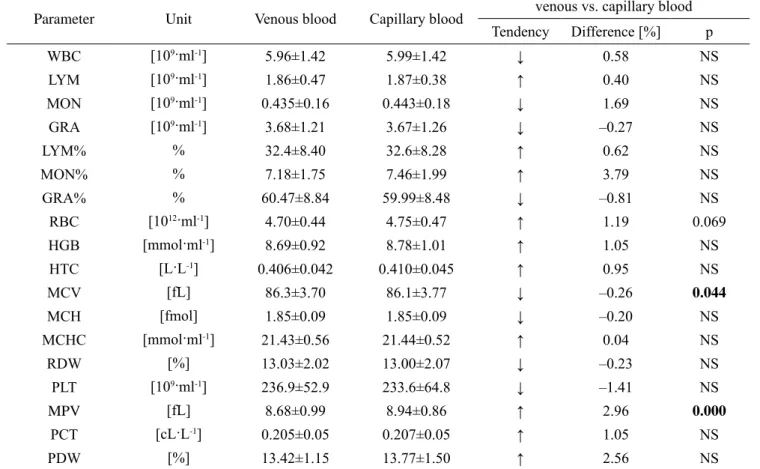
The hematological analysis of venous and capillary blood showed that the differences between the parameters ranged from 0.04% to 3.79% for MON% and MCHC, respectively. The only observed statistically significant differences between the two types of blood were MPV and MCV (Table 3). In addition, a higher erythrocyte count was noted in the capillary blood in comparison with the venous blood, and the difference displayed a trend toward significance (p = 0.069). Seven
Table 1. Anthropometric parameters (mean ± SD) of the examined subjects
Sex N [years]Age Body height[cm] Body mass[kg] [kg/mBMI2]
Female 21 23.48±0.93 167.29±5.83 61.43±6.85 21.96±2.20
Male 19 23.53±1.39 180.84±7.14 74.34±7.81 22.71±1.75
Total 40 23.50±1.15 173.73±9.38 67.56±9.74 22.32±2.01
Table 2. Blood pressure and heart rate (mean ± SD) in both hands of subjects from the tested group
Sex N Systolic blood pressure [mmHg]
Diastolic blood pressure
[mmHg] [beat/min]Heart rate
Right Left p Right Left p Right Left p
Female 21 118.33±11.02 116.57±11.55 NS 72.76±9.35 75.24±9.95 0.02 65.62±13.08 66.19±13.49 NS Male 19 133.58±16.45 129.16±13.12 NS 74.00±7.12 73.74±8.54 NS 60.63±11.88 60.16±10.46 NS Total 40 125.58±15.70 122.55±13.72 0.08 73.35±8.28 74.53±9.22 NS 63.25±12.62 63.33±12.38 NS NS – non-significant (p > 0.05)
42 TRENDS IN SPORT SCIENCES March 2014 out of eighteen hematological parameters showed lower
values in the capillary blood compared to the venous blood, although these differences did not exceed 1%. Taking into account the differences in hematocrit values in both blood samples related to the cellular components of blood and hemoglobin concentration showed statistically significant changes in relation to the granulocytes and platelets counts. Differences between the capillary and the venous blood did not exceed 2%, while for RBC and HGB they were lower than 0.25% (Table 4).
The performed correlation analysis between the venous and capillary blood samples made for all eighteen hematological parameters, except for PDW, showed statistically significant differences (p < 0.001). In addition, all parameters listed in Table 4, which were calculated with the hematocrit formula, showed a high correlation index (p < 0.001) between the venous and
capillary blood. Figure 1 shows the correlations of the hemoglobin concentration, erythrocyte count and hematocrit values. Moreover Figure 2 demonstrates the correlation between leukocytes count and its subpopulations such as granulocytes, lymphocytes and monocytes determined in both types of blood.
Discussion
The comparison of hematological parameters between venous and capillary blood has been rarely examined by researchers. Most often, the topic is related to clinical cases, and available databases such as PubMed do not include any papers examining this subject among training individuals or athletes. The conducted comparative analysis of hematological parameters marked in the venous blood and capillary blood from the fingertip exhibits slight differences between the places of blood collection.
Table 3. Comparison of venous and capillary blood parameters (mean ± SD)
Parameter Unit Venous blood Capillary blood venous vs. capillary blood Tendency Difference [%] p WBC [109·ml-1] 5.96±1.42 5.99±1.42 ↓ 0.58 NS LYM [109·ml-1] 1.86±0.47 1.87±0.38 ↑ 0.40 NS MON [109·ml-1] 0.435±0.16 0.443±0.18 ↓ 1.69 NS GRA [109·ml-1] 3.68±1.21 3.67±1.26 ↓ –0.27 NS LYM% % 32.4±8.40 32.6±8.28 ↑ 0.62 NS MON% % 7.18±1.75 7.46±1.99 ↑ 3.79 NS GRA% % 60.47±8.84 59.99±8.48 ↓ –0.81 NS RBC [1012·ml-1] 4.70±0.44 4.75±0.47 ↑ 1.19 0.069 HGB [mmol·ml-1] 8.69±0.92 8.78±1.01 ↑ 1.05 NS HTC [L·L-1] 0.406±0.042 0.410±0.045 ↑ 0.95 NS MCV [fL] 86.3±3.70 86.1±3.77 ↓ –0.26 0.044 MCH [fmol] 1.85±0.09 1.85±0.09 ↓ –0.20 NS MCHC [mmol·ml-1] 21.43±0.56 21.44±0.52 ↑ 0.04 NS RDW [%] 13.03±2.02 13.00±2.07 ↓ –0.23 NS PLT [109·ml-1] 236.9±52.9 233.6±64.8 ↓ –1.41 NS MPV [fL] 8.68±0.99 8.94±0.86 ↑ 2.96 0.000 PCT [cL·L-1] 0.205±0.05 0.207±0.05 ↑ 1.05 NS PDW [%] 13.42±1.15 13.77±1.50 ↑ 2.56 NS
WBC – white blood cells count; LYM – lymphocytes count; MON – monocytes count; GRA – granulocytes count; RBC – red blood cells count; HGB – hemoglobin concentration; HTC – hematocrit value; MCV – mean corpuscular volume; MCH – mean corpuscular hemoglobin; MCHC – mean corpuscular hemoglobin concentration; RDW – red blood cell distribution width; PLT – platelet count; MPV – mean platelet volume; PCT – plateletcrit value; PDW – platelet distribution width. ↑ – increasing tendency, ↓ – decreasing tendency, NS – non-significant (p > 0.05)
Vol. 1(21) TRENDS IN SPORT SCIENCES 43
Table 4. Comparison of venous and capillary blood parameters (mean ± SD) including hematocrit correction
Parameter Unit Venous blood Capillary blood venous vs. capillary blood Tendency Difference [%] p WBC [109·ml-1] 7.40±1.84 7.38±1.81 ↓ –0.28 NS LYM [109·ml-1] 2.31±0.57 2.30±0.49 ↓ –0.29 NS MON [109·ml-1] 0.54±0.19 0.55±0.23 ↑ 1.64 NS GRA [109·ml-1] 4.58±1.58 4.52±1.59 ↓ –1.27 0.041 RBC [1012·ml-1] 5.80±0.25 5.82±0.26 ↑ 0.25 NS HGB [mmol·ml-1] 10.72±0.28 10.72±0.26 ↑ 0.07 NS PLT [109·ml-1] 295.8±80.7 290.8±102.4 ↓ –1.69 0.003
WBC – white blood cells count; LYM – lymphocytes count; MON – monocytes count; GRA – granulocytes count; RBC – red blood cells count; HGB – hemoglobin concentration; PLT – platelet count
↑ – increasing tendency, ↓ – decreasing tendency, NS – non-significant (p > 0.05)
Figure 1. Correlations between venous and capillary blood values of hemoglobin concentration (red rhombuses),
erythrocyte count (green circles) and hematocrit value (blue crosses).
Figure 2. Correlations between venous and capillary blood count of leukocyte (blue rhombuses), granulocyte
(green rhombuses), lymphocyte (red triangles) and monocyte (black stars).
Figure 1. Correlations between venous and capillary blood values of hemoglobin concentration (red rhombuses), erythrocyte
count (green circles) and hematocrit value (blue crosses)
Studies of hematological blood allow an analysis of three groups of cellular components that inform about the status of athletes’ health in three key elements [8]. The resting number of leukocytes in the blood of individual athletes as well as their subpopulations i.e., granulocytes, lymphocytes and monocytes, may reveal the presence of infection in the body [9], overtraining syndrome [10, 11] or injury [12]. In addition, the
post-exercise increase in the number of leukocytes indicates the level of training load or the degree of adaptation of athletes for particular exercises [13].
Hollis et al. [14] showed that differences in the leukocytes count between the venous and the capillary blood was slight and ranged from 0 to 2%. A similar relationship was noted in the number of granulocytes and monocytes. Only the lymphocytes count was
44 TRENDS IN SPORT SCIENCES March 2014 higher, approximately 6% in the capillary blood,
as compared with the venous blood. These findings are similar to the present study and demonstrate a statistically non-significant higher leukocytes count in the capillary blood. Similar differences were noted by Leppänen [15], in particular, in the monocytes count. Also Yang et al. [16] noted the same trends, but in their case the differences were statistically significant. This was primarily associated with the count of large size leukocytes (granulocytes), while the small leukocytes count (lymphocytes) showed no differences.
Comparable results were obtained in the present study (Table 3). Yang et al. [16] explain this phenomenon by the increased immune stimulation in the fingertip during blood collection. Additionally, they found significant differences in the majority of hematological parameters between the venous and arterial blood. This disqualifies arterial blood for routine hematological studies. In addition, this type of blood sampling is highly invasive and not used in sport diagnostics, except for specific medical indications.
Parameters of the red blood system (RBC, HGB, HTC, MCV, MCH, MCHC, RDW) are often used to evaluate iron metabolism in well trained individuals
and athletes. Disorders, especially decreasing values of these parameters, are often the first signs of iron deficiency anemia, also called sports anemia. The present study demonstrated clearer in contrast differences in the red blood system parameters between the venous and capillary blood samples compared to the leukocytes count and their subpopulations. This mainly concerns the erythrocytes count which was higher in the capillary blood by 1.19% (p = 0.069, Table 3). Other studies also indicated this relationship [17, 18], particularly for neonates and young children. In contrast to these findings other authors showed a different tendency [16]. The reason for such discrepancies remain unknown. Perhaps they result from a statistical error arising during the counting by hematology analyzers, differences during blood collecting techniques or eventually small hemolysis of erythrocytes in the test tube. These point to the analysis carried out by Neufeld et al. [19], which showed significant differences of hemoglobin concentration assessment in the same blood samples measured by two hematological methods (Hemocue vs. Celldyn). It should be noted that these differences are small and should not affect the final interpretation of the results.
Figure 2. Correlations between venous and capillary blood count of leukocyte (blue rhombuses), granulocyte
(green rhombuses), lymphocyte (red triangles) and monocyte (black stars).
Figure 2. Correlations between venous and capillary blood count of leukocyte (blue rhombuses), granulocyte (green
Platelets play a role in hemostasis especially during the formation of blood clots. Additionally, athletes are characterized with a higher platelet count in comparison to untrained individuals [20]. Furthermore, the thrombocytes count [21] and their activity [22] may be modified during exercise. The present study shows a lower platelet count in the capillary blood in comparison with the venous blood. The difference between these two types of blood is low and does not exceed 1.5% of the total count of cells. These results are similar to those by other authors [16]. This tendency is particularly visible during analysis of children’s blood. Myung et al. [18] show that the platelet count is also higher in the venous blood (329.0 ± 146.6 x 10⁹·ml-1) in comparison with
fingerstick capillary blood (247.5 ± 129.1 x 10⁹·ml-1),
and the difference was statistically significant (p < 0.001). Moreover, Ponampalam et al. [23] showed that the platelet count difference between venous and capillary blood is connected with the total count of these cells. Patients characterized by a low thrombocytes count below reference values (lower than 140·109·ml-1), had a higher platelets count
in the capillary blood than in the venous blood. In contrast to normal values this parameter is higher in the venous blood. It is very important and should be taken into consideration during interpretation of received results.
In this paper we analyzed two indicators, i.e. MCV and MPV, which differed significantly. The first of them was higher in the venous blood, while the other was higher in the capillary blood. Unfortunately, none of available papers in databases indicates the reasons for such differences. The effect on the MCV value can be in this case the phenomenon of erythrocyte aggregation and deformation in the collected biological material. Probably, the reason can be found in the difference in the diameter of the blood vessels. Red blood cells in the capillaries are flattened, and this may ultimately affect their volume. Simmonds et al. [24] showed that the place of blood collection affects hemorheology parameters of these kinds of cells. The authors of this study propose that capillary blood may be an alternative to the analysis of parameters of venous blood, in particular, in individuals who practice physical exercises.
The scores of biochemical and hematological parameters in two or more blood samples of the same person, constitute a problem in situations when the
hematocrit value in these assays is different. This was pointed out by Van Beaumont [25], who noted that the difference in the hematocrit may affect the actual value of examined parameters. Dill and Costill [26] showed that significant changes of the circulating fluid in the vascular bed had a moderate effect on the erythrocytes count. The hematocrit correction in the present study showed that the initial erythrocyte count was at 1.19% (Table 3, p < 0.069), i.e. higher in contrast to 0.25% (Table 4, p > 0.05) in the capillary blood as compared to the venous blood, before and after calculation, respectively. The conversion method allows comparisons between trials obtained at different periods of time, or from two or more places of blood collecting for analysis. Taking a hypothetical hematocrit ratio at 0.500 (50%) and using a simple formula can be a useful hematological monitoring tool for researchers, coaches and athletes.
Conclusions
The hematological parameters marked in the venous and capillary blood did not show significant differences. The less invasive method of collecting capillary blood from the fingertip can be therefore used for systematic health status monitoring of athletes.
What this study adds?
Collection of capillary blood by fingerstick is less invasive as compared to the collection of venous blood. In addition, it is more accepted by athletes during exercise tests. This also has some practical value especially when blood is sampled during or immediately after exercise. This obstacle is the result of post-exercise high blood pressure, which makes it difficult, and sometimes impossible to draw venous blood immediately after exercise. Determination of biochemical and hematological parameters in capillary blood helps to perform multiple studies during training or exercise tests. This study indicates that the results of hematological analyses in venous and capillary blood are coherent.
Acknowledgment
The research was supported by a grant from the Ministry of Science and Higher Education of the Republic of Poland “University Sports Development” No NRSA1002651.
46 TRENDS IN SPORT SCIENCES March 2014
References
1. Jones AW, Jönsson KA, Jorfeldt L. Differences between capillary and venous blood-alcohol concentrations as a function of time after drinking, with emphasis on sampling variations in left vs right arm. Clin Chem. 1989; 35(3): 400-404.
2. Boyd R, Leigh B, Stuart P. Capillary versus venous bedside blood glucose estimations. Emerg Med J. 2005; 22(3): 177-179.
3. Kupke IR, Kather B, Zeugner S. On the composition of capillary and venous blood serum. Clin Chim Acta. 1981; 112(2): 177-185.
4. Goossens W, Van Duppen V, Verwilghen RL. K2- or K3-EDTA: the anticoagulant of choice in routine hematology? Clin Lab Hematol. 1991; 13(3): 291-295. 5. Hagerman R. Ethylenediaminetetraacetic acid
(EDTA)-Dependent Pseudothrombocytopenia: a case report of an incidental but important finding. Priory.com 2009. 6. Berkman N, Michaeli Y, Or R, Eldor A.
EDTA-dependent pseudothrombocytopenia: a clinical study of 18 patients and a review of the literature. Am J Hematol. 1991; 36(3): 195-201.
7. Gearge JM, Rizvi MA. Thrombocytopenia. In: Williams Hematology, Beutler E, ed., VIth edition, McCrawth
Medical Publishing, New York 2001: 1495-1539. 8. Malcovati L, Pascutto C, Cazzola M. Hematologic
passport for athletes competing in endurance sports: a feasibility study. Hematologica. 2003; 88(5): 570-581. 9. Gleeson M. Immune function in sport and exercise. J
Appl Physiol (1985). 2007; 103(2): 693-699.
10. Natale VM, Brenner IK, Moldoveanu AI, Vasiliou P, Shek P, Shephard RJ. Effects of three different types of exercise on blood leukocyte count during and following exercise. Sao Paulo Med J. 2003; 121(1): 9-14.
11. Nieman DC, Berk LS, Simpson-Westerberg M, Arabatzis K, Youngberg S, Tan SA, Lee JW, Eby WC. Effects of long-endurance running on immune system parameters and lymphocyte function in experienced marathoners. Int J Sports Med. 1989; 10(5): 317-323.
12. Wu HJ, Chen KT, Shee BW, Chang HC, Huang YJ, Yang RS. Effects of 24 h ultra-marathon on biochemical and hematological parameters. World J Gastroenterol. 2004; 10(18): 2711-2714.
13. Saito Y, Kusaka Y, Shimada M. Effects of exercise intensity on circulating leukocyte subpopulations. Environ Health Prev Med. 2003; 8(1): 18-22.
14. Hollis VS, Holloway JA, Harris S, Spencer D, van Berkel C, Morgan H. Comparison of venous and capillary differential leukocyte counts using a standard hematology analyzer and a novel microfluidic impedance cytometer. PLoS One. 2012; 7(9): e43702.
15. Leppänen EA. Experimental basis of standardized specimen collection: the effect of the site of venipuncture on the blood picture, the white blood cell differential count, and the serum albumin concentration. Eur J Hematol. 1988; 41(5): 445-448.
16. Yang ZW, Yang SH, Chen L, Qu J, Zhu J, Tang Z. Comparison of blood counts in venous, fingertip and arterial blood and their measurement variation. Clin Lab Hematol. 2001; 23(3): 155-159.
17. Daae LN, Hallerud M, Halvorsen S. A comparison between hematological parameters in ‘capillary’ and venous blood samples from hospitalized children aged 3 months to 14 years. Scand J Clin Lab Invest. 1991; 51(7): 651-654.
18. Myung JK, Ji HJ, Young SK, Yong HJ, Soon KK. Comparison of blood counts in capillary and venous blood in children. Korean J Hematol. 2009; 44(4): 237-243.
19. Neufeld L, García-Guerra A, Sánchez-Francia D, Newton-Sánchez O, Ramírez-Villalobos MD, Rivera-Dommarco J. Hemoglobin measured by Hemocue and a reference method in venous and capillary blood: a validation study. Salud Publica Mex. 2002; 44(3): 219-227.
20. Singh I, Quinn H, Mok M, Southgate RJ, Turner AH, Li D, Sinclair AJ, Hawley JA. The effect of exercise and training status on platelet activation: do cocoa polyphenols play a role? Platelets. 2006; 17(6): 361-367. 21. Fallon K, Fallon S, Boston T. The acute phase response
and exercise: court and field sports. Br J Sports Med. 2001; 35(3): 170-173.
22. Kestin AS, Ellis PA, Barnard MR, Errichetti A, Rosner BA, Michelson AD. Effect of strenuous exercise on platelet activation state and reactivity. Circulation. 1993; 88(4 Pt 1): 1502-1511.
23. Ponampalam R, Chong SMCF, Tan SC. Comparison of full blood count parameters using capillary and venous samples in patients presenting to the emergency department. ISRN Emergency Medicine. 2012; Article ID 508649.
24. Simmonds MJ, Baskurt OK, Meiselman HJ, Marshall-Gradisnik SM. A comparison of capillary and venous blood sampling methods for the use in haemorheology studies. Clin Hemorheol Microcirc. 2011; 47(2): 111-119. 25. Van Beaumont W. Evaluation of hemoconcentration from hematocrit measurements. J Appl Physiol. 1972; 32(5): 712-713.
26. Dill DB, Costill DL. Calculation of percentage changes in volumes of blood, plasma, and red cells in dehydration. J Appl Physiol. 1974; 37(2): 247-248.
![Table 2. Blood pressure and heart rate (mean ± SD) in both hands of subjects from the tested group Sex N Systolic blood pressure [mmHg] Diastolic blood pressure](https://thumb-eu.123doks.com/thumbv2/9liborg/3079419.7736/3.892.85.837.176.285/table-blood-pressure-subjects-systolic-pressure-diastolic-pressure.webp)