Research into radiation damage in single cells
using molecular spectroscopic techniques
Ewelina W. Lipiec
The Henryk Niewodniczański Institute of Nuclear Physics
Polish Academy of Sciences
Kraków, Poland
Thesis presented for the degree of Doctor of Philosophy written under supervision of
Prof. dr hab. Wojciech M. Kwiatek
Prof. Bayden R. Wood
Abstract
The aim of this research is to study the effects of how radiation interacts with living cells and radio-biologically relevant molecules. Raman and Synchrotron Fourier Transform Infrared microspectroscopy with subsequent multivariate analysis was applied to investigate radiation damage to nucleic acids, proteins and lipids and also to monitor the cellular response to radiation exposure. DNA conformational changes including the partial molecular transformation from the B–DNA to the A–DNA form, along with an increase in protein expression, characteristic of DNA repair, was observed in cells exposed to radiation, as evidenced by a shift in the DNA asymmetric phosphodiester vibration to a higher wavenumber value. Chromatin condensation and intranuclear lipid deposition associated with apoptotic processes were also detected by mapping the distribution of characteristic functional groups associated with biomolecules.
The molecular structure of individual Double Strand Breaks (DSBs) were characterised for the first time using Tip Enhanced Raman Scattering (TERS) with a top-down configuration and reflective substrate. Based on spectral interpretation it was found that DSBs result from cleavage at the 3’– and 5’– bonds of the deoxyribose unit upon exposure to UVC radiation. The observation of P–O–H and methyl/methylene deformation modes enhanced in the TERS spectra proved that strand fragments are hydrogen–terminated at the lesion, indicating the action of free radicals during photon exposure.
The results presented herein enhance the knowledge about the interaction between radiation and living matter in a cell population, single cells, single extracted cellular nuclei, double stranded DNA and other radio-biologically relevant molecule levels.
Acknowledgements
I would like to express many thanks to my supervisor Prof. Wojciech M. Kwiatek, for his great help, an understanding, scientific discussions, for supporting me and my ideas, giving me the freedom in making scientific decisions. Without the help and patience of my Professor this work would not have been possible.
I would like to thank my co–supervisor Prof. Bayden R. Wood, for his great enthusiasm, head full of scientific ideas, and deep knowledge which he shared with me selflessly. I am grateful for an invitation to his laboratory at Monash University and supporting me during the internship. I have to admit, that I had a lot of luck, walking my scientific path, because I met great professionals who shared with me their knowledge and experience selflessly. I had the opportunity to learn from the best experts, to whom I would like to thank in the order in which they appeared on my scientific way. From the bottom of my heart I would like to thank Dr. Janusz Lekki for introducing me the low doses, microprobes and single cells world, Mrs. Joanna Wiltowska–Zuber, who taught me a cell culturing, Mr. Zbigniew Szklarz and Mr. Tomasz Pieprzyca for all hours in Microbeam laboratory. I would like to acknowledge to beamscientists Prof. David Moss, Dr. Lisa Vaccari, Dr. Giovanni Birarda, Prof. Paul Dumas, Dr. Joni Frederick, Dr. Christopher Sandt and Dr. Luca Quaroni with whom I had a pleasure to work, for their support and scientific discussions. I would like to thank Dr. Anna Wiecheć for our measurements. Especially, I would like to thank Prof. Małgorzata Lekka and Her students, who taught me the AFM microscopy and for all Her excellent suggestions and comments. I would like to thank Dr. Ryo Sekine, Dr. Christian Vogel, Prof. Don McNaughton Mr. Finlay Shanks for their hand in Biospec. Lab. at Monash University. I would like to thank Dr Jakub Bielecki for an implementation of 'ab initio' calculations, presented in chapter III. I would like to thank Dr. Mark Tobin and Dr. Keith Bambery for the great support at the Infrared microspectroscopy beamline at Australian Synchrotron. I would like to thank Maria Kaczmarska for English corrections. For all difficult questions I would like to thank Dr. Zbigniew Stachura. I was walking the scientific path simultaneously, with M.Sc. Eng. Joanna Czapla i Dr. Joanna Kowalska, to whom I would like to thank for our experiments and more or less scientific discussions.
During these four years of PhD studies my fiance Kuba, my family and my friends were supporting me, keeping their fingers crossed . I would like to thank each of them with all my heart.
Contents
Introduction …...
Chapter I – Theoretical introduction ... 1.1 Introduction to Radiobiology...
1.1.1. Charged particles interaction with matter…...
1.1.2. Electron interaction with matter...
1.1.3. Photon interaction with matter...
1.1.4. Radiation interaction with living matter …...
1.1.4.1. Radiation interaction in living matter on molecular
level...
1.1.4.2. Radiation interaction in living matter on cellular level....
1.2 Introduction to Biospectroscopy... 1.2.1. Raman Scattering... 1.2.2. SERS... 1.2.3. TERS... 1.2.4. Infrared Absorption... 1.2.5. Molecular vibrations...
1.2.6. Multivariate statistical analysis …...
1.2.6.1. UHCA... 1.2.6.2. PCA... 1.2.7. Dealing with the baseline...
1.2.8. An application of SR–FTIR microspectroscopy and the
Raman microspectroscopy in radiation research...
Chapter II – Experimental introduction... 2.1 Nucleic acid components under SR–FTIR and Raman microscopies...
2.1.1. Materials and methods...
2.1.1.1. ATR–FTIR spectroscopy measurement and data
processing...
2.1.1.2. Raman spectroscopy measurement and data processing..
1 4 5 5 7 7 9 9 11 12 12 15 16 17 18 18 19 19 20 23 26 27 27 27 27
2.1.1.3. Single cells and nuclei SR–FTIR spectroscopy
measurement and data processing...
2.1.1.4. Single cells and nuclei Raman spectroscopy
measurement and data processing... 2.1.2. Results... 2.2 An analysis of radiation damage in DNA, nucleotides and adenosine.... 2.2.1. Methodology...
2.2.1.1. Irradiation of DNA, nucleotides and adenosine using the
proton microbeam …...
2.2.1.2. Raman spectra collection and their processing...
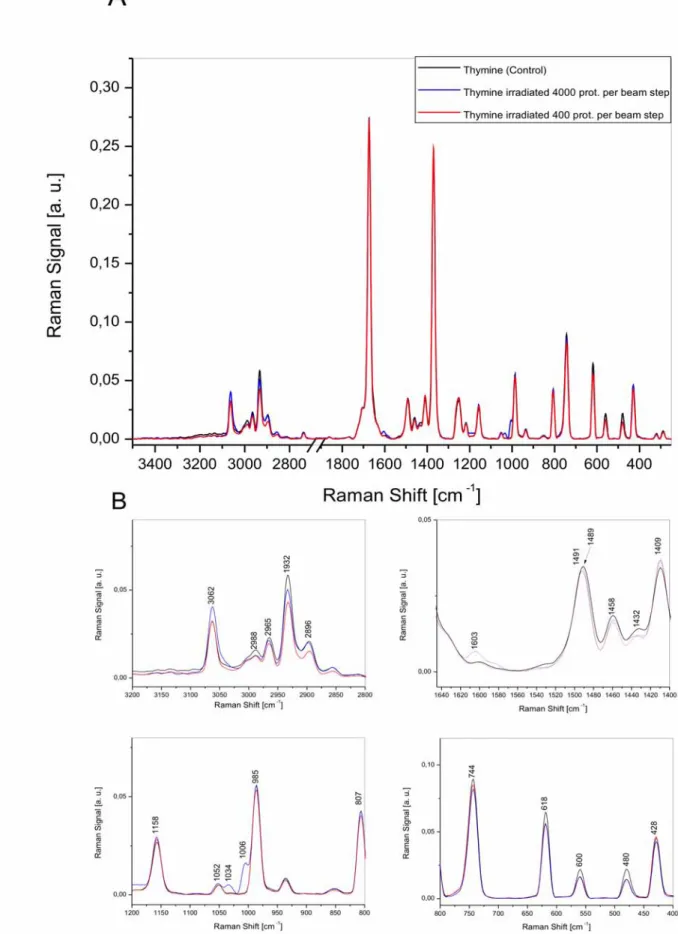
2.2.2. Radiation damage of thymine molecule...
2.2.3. Radiation damage of cytosine molecule...
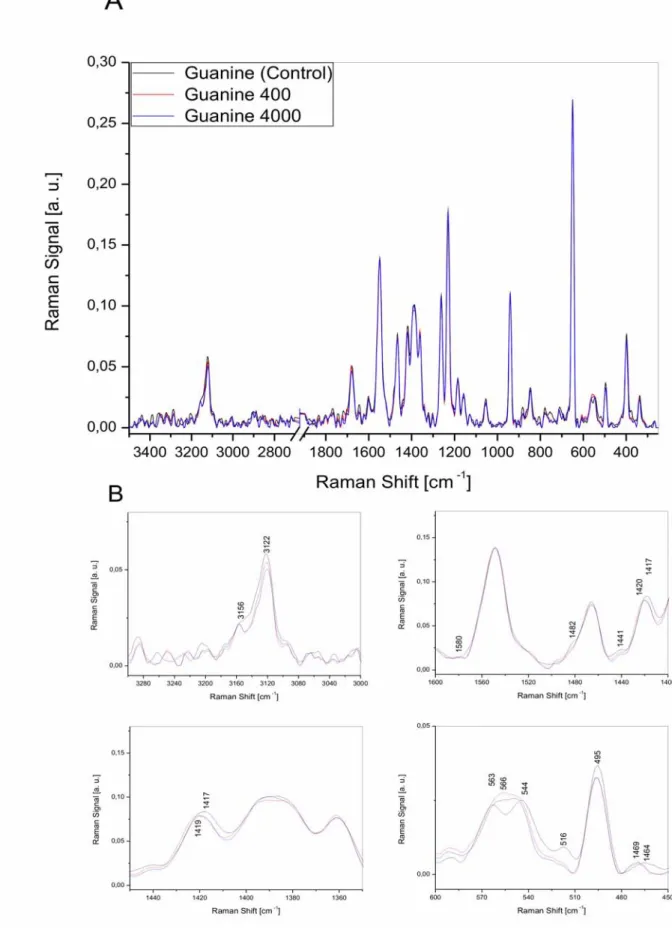
2.2.4. Radiation damage of guanine molecule...
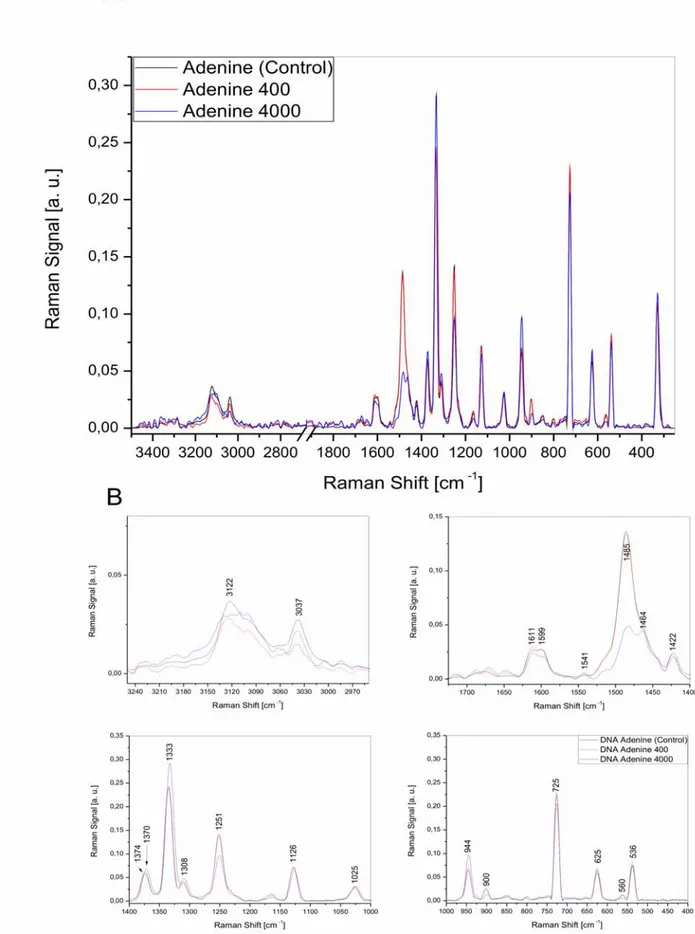
2.2.5. Radiation damage of adenine molecule...
2.2.6. Radiation damage of adenosine molecule...
2.2.7. Radiation damage of DNA molecule...
2.3 Summary and conclusions... Chapter III – An investigation of individual DNA Double Strand Breaks using Tip Enhanced Raman Scattering...
3.1 Introduction... 3.2 Materials and Methods...
3.2.1. Tips and samples preparation...
3.2.2. AFM imaging...
3.2.3. Focusing the laser on the Tip...
3.2.4. TERS spectra collection... 3.2.5. Spatial resolution... 3.3 Results...
3.3.1. Spectral reproducibility for control and irradiated plasmid
DNA...
3.3.2. Principal Component Analysis (PCA)...
3.3.3. TERS, SERS and microraman comparison...
3.3.4. Individual DSB structure... 28 28 29 33 33 34 34 34 38 40 43 46 48 51 52 53 54 54 55 57 58 58 60 60 61 63 66
3.3.5. Individual DSB formation...
3.3.6. Comparison of the TERS results with DFT calculations...
3.4 Summary and Conclusions... Chapter IV An investigation into an interaction of cells with various kind of radiation...
4.1 Radiation damage detection in single cells and cellular response to radiation study... 4.1.1. Motivation... 4.1.2. Methodology... 4.1.2.1. Cell line, cell culturing... 4.1.2.2. Irradiation procedures... 4.1.2.2.1. Deposited energy... 4.1.2.3. SR–FTIR measurements... 4.1.2.4. Data processing... 4.1.3. Results... 4.1.3.1. Damage detection...
4.1.3.2. Cellular response to radiation study...
4.2 Bystander effect study... 4.2.1. Motivation... 4.2.2. Methodology... 4.2.3. Results... 4.3 Sunlight influence on living cells study... 4.3.1. Motivation... 4.3.2. Methodology... 4.3.2.1. Cells and nuclei...
4.3.2.2. “Laboratory sun” light exposure...
4.3.3. Results...
4.3.3.1. Dose dependent response to UV radiation studied by
SR–FTIR in isolated cellular nuclei...
4.3.3.2. Dose dependent response to UV radiation studied by
SR–FTIR in living cells...
4.3.3.3. Time dependent response to UV radiation studied by
69 70 73 75 76 76 77 77 78 79 80 81 81 81 86 91 91 93 93 97 97 99 99 99 101 103 109
SR–FTIR inisolated cellular nuclei and living cells...
4.3.3.4. Raman microspectroscopy...
4.3.3.5. Raman imaging... 4.4 Summary and conclusions... General conclusions... References... List of Tables... List of Figures... 113 114 117 121 123 126 141 142
List of abbreviations
DNA – Deoxyribonucleic acid DSB – Double Strand Break IR – Infrared
FTIR – Fourier Transformed Infrared LET – Linear Energy Transfer
PCA – Principal Component Analysis RNA – Ribonucleic acid
SERS – Surface Enhanced Raman Scattering SR – Synchrotron Radiation
SSB – Single Strand Break
TERS – Tip Enhanced Raman Scattering
UHCA – Unsupervised Hierarchical Cluster Analysis UVR – Ultraviolet radiation
Introduction
All living organisms are continually exposed to radiation through natural sources such as cosmic rays and terrestrial sources including radon thorium and uranium. Radiation has found application in cancer treatment and diagnosis and has direct effects on tissues and cells. The most sensitive molecule in terms of affecting cell function is damage to DNA because the genetic information is stored here [Warters 1977, Warters
1978, Wouters 2009]. The processes at the cellular and molecular level are the basis for
the macroscopic effects of ionising radiation on whole organisms. The cellular response to ionising radiation depends on the radiation type, LET, dose, dose rate, and cell type
[Prise 2005, Wouters 2009]. However, the existing knowledge about these processes is
still incomplete and requires further studies. In radiobiology, the effects of low dosages are extremely important in understanding how radiation interacts with cells and tissues in radiotherapy and our daily lives.
The results of this thesis provide a unique database of knowledge about processes in living matter after exposure to radiation and the effectiveness of proton therapy. Such information could potentially lead to new therapeutic strategies especially given proton therapy is currently used in countries including Poland for the treatment of ocular melanoma at IFJ PAN.
In recent years, the Synchrotron Radiation Fourier Transformed Infrared (SR–FTIR) and Raman microspectrosopies have been applied to studies of biological materials at the cellular level. Undoubtedly the advantages of these methods are the high sensitivity and noninvasive nature of the approach. In this thesis the application of SR–FTIR microspectroscopy and various Raman scattering techniques including Tip Enhanced Raman Scattering (TERS) and Surface Enhanced Raman Spectroscopy (SERS) are applied to analyse radiation damage in single cells and double DNA strands.
The main areas of investigation are three-fold:
1. To investigate the effects of irradiating single cells with a proton microbeam using SR-FTIR spectroscopy.
2. To develop a TERS method to investigate the chemical nature of individual Double Strand Breaks (DSBs) in DNA.
3. To investigate spectral changes in cellular nuclei isolated from irradiated and control cells.
This study combines various types of spectroscopic approaches with the goal to enhance the knowledge of the physical and chemical phenomena that take place in a living cell and DNA in solution after radiation exposure. This thesis has been divided into four chapters.
The first chapter consists of two subsections: “Introduction to Radiobiology” and “Introduction to Biospectroscopy”. The first subsection “Introduction to Radiobiology” describes the physical, chemical and biological phenomena associated with exposure to various kinds of radiation starting with an explanation of the basic physical processes associated with the interaction of photons, electrons and heavy charged particles with matter at the atomic level. The section provides an explanation of chemical phenomena in biologically relevant macromolecules and finishes with a biological description of the cellular response to radiation. In the second section “Introduction to Biospectroscopy” the spectroscopic techniques such as Raman scattering, Surface Enhanced Raman Scattering (SERS), Tip Enhanced Raman Scattering (TERS) and Fourier Transform Infrared (FTIR) spectroscopy are explained. Additionally the mathematical descriptions of the algorithms related to data processing such as baseline correction and Principal Component Analysis (PCA) and Unsupervised Hierarchical Cluster Analysis (UHCA) are presented.
The second chapter provides an introduction to the experimental methods. First, the radiobiological relevant macromolecules in single cells including nucleic acids and nucleotides are investigated using IR and Raman microspectroscopy. The spectra of these compounds are compared to spectra of control and irradiated single cells and the radiation dependent changes in DNA and nucleotides are discussed.
The third chapter shows a novel approach to visualise and characterise the molecular structure of the most dangerous form of DNA damage namely DSBs at the nano–scale in isolated plasmid DNA using TERS with a top–down configuration. The detection of terminal hydrogen bonding in plasmid DNA exposed to UVC radiation is reported using the TERS technique. Based on visual inspection and PCA three main types of TERS spectra and three potential cleavage sites were identified. To the best of
the author's knowledge, the chemical structure of individual DSBs has never been experimentally verified. The analysis of the spectral variance was performed using PCA and a comparison with TERS, SERS along with micro–Raman spectra are presented.
In the fourth chapter a number of experiments were performed to enhance the knowledge about the interaction between living single cells to various types of radiation using SR–FTIR and Raman microspectroscopy in combination with PCA. Three types of experiments are presented namely proton damage detection in single cells, single cell response to proton irradiation, non–targeted effects such as the bystander effect induced by proton irradiation, and a study on the response of cells to UV radiation.
Chapter I
Theoretical introduction
1.1 Introduction to Radiobiology
The aim of this chapter is to describe the principal physical, chemical and biological phenomena of the interaction between ionising radiation and biological matter at the atomic, molecular and single cell level.
1.1.1 Charged particle interaction with matter
Charged heavy particles such as those used in cancer therapy, which include carbon ions, alpha particles and protons with MeV energy range, interact with matter mainly by Coulomb interaction with orbital electrons of the absorbent. Because of the low cross– section for Rutherford scattering (elastic scattering of charged ions against scattering absorbent atom nuclei) or nuclear reactions, these processes are not involved in energy transfer between the charged heavy ions and the absorbent atoms. As a result of energy transfer there is usually excitation and ionisation of absorbent atoms. The trajectory of the interacting particle changes constantly, however, those changes are very small and because of the direction compensation (the total sum of random changes of the velocity vector direction is equal 0) the resultant trajectory is a straight line, which is defined by the direction of the initial velocity. When the decreasing particle energy becomes comparable to the energy of electrons in absorbent atoms the probability of electron capture by the particle increases, which temporarily prevents further Coulomb impact. Averaged energy loss of heavy charged particles per unit of path is described by the Bethe formula (1.1): −dE dx = 4 e4z2 meV2 NZ [ln 2meV2 I 1−2 − 2 ] (1.1) where: e – electron charge,
z – atomic number of heavy particle,
me – electron mass,
V – particle velocity,
N – number of atoms per one unit volume of the absorbent, Z – atomic number of the absorbent,
β – the ratio of particle velocity to the speed of light,
I – averaged ionisation or excitation potential of absorbent atoms, the value is
determined by the semi–empirical formula (1.2):
I =9,1 Z 11,9 Z
2
3 (1.2)
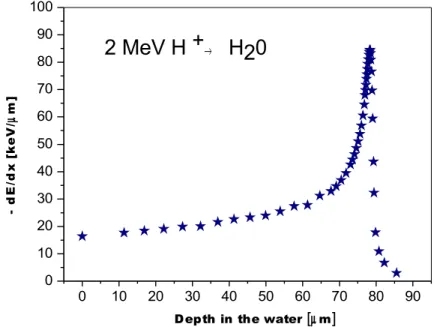
Using the data generated in the program SRIM [1] a plot showing the averaged energy loss per unit path for a proton (initial energy 2 MeV) during its travel through the water (Fig 1.1) was prepared. Water is considered as a material that mimics biological materials and is often used in radiobiological modelling because human cells are made up of approximately 80% of water.
The energy losses per path unit increases exponentially with decreasing proton energy and reaches a maximum – the Bragg peak, and then declines rapidly due to the increasing probability of electron capture. The energy is transferred over the entire heavy particle trajectory. Electrons ejected during ionisation and photons emitted in de– excitation processes can affect the absorbent causing indirect radiation damage.
[Hrynkiewicz 2001, Wagenaar 1995]
Fig. 1.1 A plot showing the averaged energy loss per path unit for a proton (initial
energy 2 MeV) during its travel through water.
0 10 20 30 40 50 60 70 80 90 0 10 20 30 40 50 60 70 80 90 100
2 MeV H +
→H20
Depth in the water [µm]
- d E /d x [ k e V / µ m ]
1.1.2 Electron interaction with matter
According to classical theory, each electron interaction with a matter results in a loss of energy because of changes in velocity accompanied by the emission of
electromagnetic radiation called bremsstrahlung dE /dx r . The electrons can transfer
their energy by Coulomb interaction dE /dxC . The ratio of these values is
approximated by the formula (1.3).
dE /dxr dE /dxc ∝ EZ 700 (1.3) where: E – electron energy,
Z – atomic number of the absorbent.
The trajectory of the electron interacting with matter changes dramatically because of the very high–energy transfer. The electron can transfer a significant part of its energy to the absorbent electron because in the centre of mass system, both particles have the same rest masses. [Hrynkiewicz 2001, Wagenaar 1995]
1.1.3 Photon interaction with matter
X rays, UV and gamma radiation are more penetrating than charged particles – the interaction with matter is weaker (ionisation density is lower). Interaction is described by the probability of a photon removal from the incident beam per unit of path in the absorbent (μ), which is called a linear absorption coefficient. The intensity of the beam (I) in the absorbent decreases exponentially:
I =I0e−x (1.4)
where:
I0–intensity of incident light,
x– the thickness of the absorbent.
The energy transfer takes place through the photoelectric effect, the Compton effect and pair production.
In the photoelectric effect the whole energy of a photon is transferred to one of the electrons located on the internal atomic shell. The electron is ejected gaining the photon kinetic energy reduced by the binding energy of an electron in the atom (Fig. 1.3). De–excitation of the electron from higher energy atomic shell is accompanied by emission of characteristic X–rays, Auger electron emission or Coster–Cronig phenomenon. The probability of the photoelectric effect is approximately proportional to
Zn/E3, where for low energy quanta the exponent n
varies between 3 and 4.
In the Compton effect just a part of photon energy is transferred to the electron located in the outer–shell of the absorbent. As a result of this mechanism the photon, losing its energy, has a longer wavelength and the electron is ejected from the atom. The probability of the Compton scattering process is proportional to the Z number and decreases with increasing photon energy.
The minimum energy needed for the pair production process is 1.02 MeV – the sum of two electrons rest energies. Photon energy is partially converted into the mass and creates a particle – an electron and antiparticle – positron. Due to the principle of conservation of momentum and energy the phenomenon must take place in the electromagnetic field of the electron or atom nucleus. The probability of
pair production is proportional to Z2 of the absorbent.
[Hrynkiewicz 2001]
Fig. 1.2 The scheme of
photoelectric effect.
Fig. 1.3 The scheme of
Compton effect.
Fig. 1.4 The mechanism of
pair (electron position) production.
1.1.4 Radiation interaction with living matter
The interaction of radiation with living matter with the response to exposure could be divided into four distinct stages:
1. the physical stage: ionisations, excitations and deexcitations of absorbent atoms, 2. the chemical stage: from the interaction with free radicals, enzymatic reactions, 3. the early biological stage: DNA repair, the cellular response to radiation
exposure, which can lead to cell death.
4. the late biological stage: the occurrence of cancer and mutations that can be passed onto future generations.
Before consideration of radiation interaction in living cells the basic phenomena occurring at the molecular level should be reiterated. [Hrynkiewicz 2001]
Taking into consideration the interaction of ionising radiation with biological systems, certain physical and radiobiological radiation quantities and units must be defined. The ionising radiation energy absorbed per unit mass of absorbing material is defined as a absorbed dose (sometimes referred to simply as 'dose'). The unit of absorbed dose is the Gray [Gy] which is equal to J/kg. In a micro–dosimetric approach, where the very small mass is difficult to estimate, the absorbed dose is referred to as the specific energy. Linear Energy Transfer (LET) is defined as the energy transferred to the material of a absorbent, per unit length of the track of an ionising particle within the medium, which can be measured by the density of ionisation. The Relative Biological Effectiveness (RBE) increases with the increasing LET of the radiation. An increase in the density of ionisations in DNA leads to an increase in the level of damage leading to cell death decreasing the survival fraction.
1.1.4.1 Radiation interaction with living matter on molecular level
Ionisations, excitations and deexcitations could lead to molecular changes such as bond breaking or new bond formation. Damage can be caused either directly by radiation or indirectly by knocking electrons (delta electrons), emitted photons or the generation of free radicals. It was reported that just 0.5% of DNA irradiated by gamma rays in solution is damaged directly by radiation and the 99.5% indirectly because of water radiolysis products [Sonntag 2006 ].
An ionised water molecule (1) reacts with a non–ionised one and a hydroxide radical is formed (2). The ionised water molecule bonds to a free electron to form an excited state water molecule, (3) which disintegrates to the hydrogen radical and the hydroxyl radical (4). The hydrogen radical reacts with oxygen and creates an unstable peroxide hydroxyl radical (5). This reacts with a second peroxide hydroxyl radical (6) or with a hydrogen radical (7) leading to the production of hydrogen peroxide, which can cause oxidative damage to biological molecules. [Sonntag 2006]
(1) H2O H2O+ + e– (2) H2O+ + H2O H+aq + OH• (3) H2O+ + e– H2O* (4) H2O* H• + OH• (5) H• + Ο2 HO2• (6) 2HO2• H2O2 + O2 (7) HO2• + H• H2O2
The molecular damage caused either directly or indirectly by these processes are the same. Lipid peroxidation is a possible consequence of the radiation exposure. Lipid radiation damage can lead to inflammation, which has serious complications post– radiotherapy. The inflammation is caused by the intrusion of the cytoplasm through the lipid membrane to the extracellular matrix. Protein degradation can also occur resulting in: 1) the breakdown of secondary, tertiary and quaternary structure, 2) the creation of cross–links and 3) the breaking of covalent bonds at the primary structural level. DNA is particularly sensitive to the effects of radiation exposure [Prise 2005, O'Neill 2009]. A damaged lipid or protein molecule is easily replaced, whereas damaged DNA must be repaired. Ionising radiation can cause various types of DNA damage: DNA strand cross–links, DNA–protein cross–links, Single Strand Breaks (SSBs), base damage, sugar damage and the most dangerous form namely the DSBs [Ugenskiene 2007]. In eukaryotes DSBs are critical lesions that can lead to cell death. The yield of DSBs per Gy (unit of absorbed dose) determines the biological effectiveness of different radiation qualities [Ugenskiene 2007]. A number of repair enzymes exist in each cell constantly monitoring the state of the genetic material and repairing damage [Branzei 2008]. However, the broken DNA molecule is not always repaired correctly. Along with the
increasing level of damage appearance (proportional to the radiation dose received) the probability of failure fixation, or incorrect repair process is higher [Hrynkiewcz 2001]. The minimum number of lesions leading to cell death might be calculated, but it is impossible to determine a threshold dose below which the DNA damage is correctly fixed. This is essential in establishing a criterion for risk assessment of low dose interactions in cells.
1.1.4.2 Radiation interaction in living matter on cellular level
Unrepaired or incorrectly repaired DNA damage may result in malignant transformation or cellular death [Wouters 2009]. There are two types of radiation– induced death: the mitotic death and interphase death: apoptosis or necrosis.
Mitotic death, also called mitotic catastrophe, takes place when a fatally damaged cell may not die until the next mitosis, at which point damage to the DNA becomes evident in the form of fragmentation of chromosomes. Due to a loss of a significant part of the genetic information proliferation is no longer possible [Castedo 2004].
A seriously damaged cell, which cannot repair the DNA damage, dies regardless of the phase of the cell cycle. Necrosis caused by irradiation is an instant process. Usually it is associated with serious damage to the cellular membrane. The culture medium will flow through the damaged cell membrane and into the cytoplasm and the cell swells and bursts releasing cellular contents into the extracellular space. Not all of the cellular proteins are recognised by the immune system, which results in the inflammation response. Inflammation is a serious consequence of radiotheraphy. [Taylor 2008]
Apoptosis is programmed cell death. All kinds of cellular components: nucleic acids, lipids and proteins are involved in this process. Production of mechanisms to prevent this type of cell death depends on the cell genotype and is typical for the cancer cells. Apoptosis is used by the multicellular organisms to dispose of unwanted cells [Kerr
1972, Wyllie 1980]. Several types of apoptotic pathways exist. In one pathway cysteine–
aspartic proteases, known as caspases, are activated. Intrinsically a caspase 9–mediated and extrinsically caspase 8–mediated are activated. This ultimately activates a set of effector enzymes: caspase 3 and and caspase 7 in the cytoplasm which cleave major cellular proteins. The apoptotic pathway could be also Caspase–independent in which apoptosis–inducing factor (AIF) from the mitochondria migrates to the nucleus and
binds to the DNA. All pathways lead to blebbing, cell shrinkage, nuclear fragmentation, chromatin condensation, chromosomal fragmentation and formation of apoptotic bodies – sealed membrane vesicles. [Okada 2008, Wouters 2009, Lockshin 2004, Taylor 2008]
1.2 Introduction to the Biospectroscopy
Nowadays, very often, biochemical methods are used to detect radiation damage. However, these methods may affect the biological samples leading to changes in their structure due to chemical substances and complex preparation procedures. Moreover, most of the biochemical methods are not intended to study the effect at the single cell level. Therefore, the importance of the application of various complementary techniques is evident. SR–FTIR and Raman microspectroscopies are well known for their uniqueness as a non–destructive tools used for the identification of vibrational structure in biological materials.
Optimisation of these molecular spectroscopic methods to study radiation damage in single cells will allow the fast, simultaneous detection of lipids, protein and nucleic acid damage at the molecular level. The measurements enable the detection of various types of DNA damage, which is correlated to the types, energies and doses of radiation.
The physical fundamentals of all Raman techniques applied in ths study: Raman microspectroscopy, Surface Enhanced Raman Scattering (SERS), Tip Enhanced Raman Scattering (TERS) and Infrared Spectroscopy are explained below.
1.2.1 Raman Scattering
Light scatters into an optical medium heterogeneously [Tyndall 1968, Rayleigh
1871]. Molecular light scattering was first described by Lord Rayleigh [Rayleigh 1899]
and then Einstein [Einstein 1910]. Lord Rayleigh, in studying the colour of the sky,
proved that the intensity of light scattered from molecules (IS) is proportional to the
incident light intensity II and inversely proportional to the fourth power of wavelength λ
(1.5).
Rayleigh scattering is an elastic process, the energy of light is conserved.
Quantum mechanics explains that Rayleigh scattering results from photon absorption by a molecule and the emission of the photon at exactly the same energy in a
random direction E = hν0 (Fig. 1.5).
In general, a case exists for another type of scattering, which is not elastic and
where the incident light wavelength changes ΔE=hν0 – hνS or hν0 + hνS (Fig. 1.5) and is
characteristic for the dispersion medium. The scattered photon frequency is equal to
ν0 – νS or ν0 + νS for Stokes and Anti–Stokes scattering, respectively. The phenomenon
of inelastic scattering was described by Raman and Krishnan (1928) in the solid state and by Landsberg and Mandelstam (1928) in crystals. Elastic and inelastic scattered photons could be observed in spectra (Fig. 1.5).
In 1934 Placzek explained the Raman scattering using the theory of changing polarisability. Placzek’s polarisability theory, the non–resonant Raman intensity
associated with vibrational mode Qi, is defining by the Raman scattering activity:
Si=gi[45 'i27 'i2] (1.6)
and also by the depolarisation ratio:
i= 3 'i
2
[45 'i24 'i2] (1.7)
where is degeneracy of normal mode Qi, and and are the derivatives of
isotropic and anisotropic invariants of Raman tensor defined respectively by (1.8) and (1.9):
(1.8) and
(1.9) In equation (1.8) and (1.9) αij are components of the Raman tensor.
Raman scattering is a very weak process, just one per 106–1012 photons are scattered in this way. Raman spectroscopy of biological specimens is extremely difficult because of the poor Raman cross–sections for many biological molecules and their lack of symmetry. Additionally biological samples are very sensitive to temperature changes and fluorescence activity.
Effective Raman cross section could be described in terms of the molecule dipole
momentum (µ) induced by the electromagnetic field (EL) of the laser radiation and
molecule polarisability (α),
µ (ω) = α EL (ω) (1.10) where ω is the light incidence.
However, it is possible to increase the Raman cross–section by making use of localised
Fig. 1.5 The Jablonski diagram representing the anti–Stokes and Stokes scatter from the molecule in
terms of transitions between energy states of the molecule and the corresponding Raman spectrum. The intensity of the scattered radiation is represented by the amplitude of the lines. The centre line represents the position of the Rayleigh scatter of the excitation laser and by convention is set to zero such that the spectrum represents the shift from the incident radiation, with Stokes frequencies being positive by convention.
electromagnetic fields generated by the interaction of laser light with metal particles or by chemical adsorption of the molecule onto a metal surface leading to new charge– transfer electronic transitions. These properties are utilised in techniques of Surface Enhanced Raman Scattering (SERS) and Tip Enhanced Raman Scattering (TERS).
1.2.2 SERS
In 1974, Fleischmann observed unusually strong Raman signals of pyridine molecules adsorbed onto a roughened silver electrode [Fleischmann 1974]. Three years later Creighton and Van Duyne published independently that the intensity enhancement
originated from the roughened silver surface [Albrecht 1977, Jeanmaire 1977]. Typical
SERS enhancement factors are (102–106) [Fleischmann 1974, Kneipp 1996, Kneipp
1997, Kneipp 1999, Nie 1997], allowing studies of samples at very low concentration.
The physical phenomenon of the enhancement is not fully understood. It is currently assumed that the increase of the cross–section of Raman Scattering is caused by either the plasmon resonance or so called chemical enhancement [Lombardi 2008,
Morton 2009].
Chemical enhancement
In chemical enhancement a significant increase of the molecule polarisability is brought about by the adsorption of the chemical onto the metal surface resulting in charge transfer and electron–hole pair creation [Otto 1984].
The mechanism of electron transfer assumes a chemi–sorption process of the molecule with the metal surface resulting in the appearance of a new excited state, which comes into resonance with the excitation laser line like in resonant Raman scattering. Albrecht proposed a model to characterise resonant Raman scattering using the charge–transfer model [Albrecht 1977]. In this model the Fermi level is located between populated and unfilled molecular orbitals, allowing for electron tunnelling. This process leads to the formation of new excited states, that exhibit a much larger effective Raman cross section for the molecule absorbed onto the metal surface [Kneipp 1999]. The electron is transferred from the Fermi level of metal to unfilled molecular orbitals of the sample or from populated molecular orbitals of the sample to the Fermi level of metal.
Electromagnetic enhancement
The electrons are not localised evenly on the irregularly shaped metallic structure. The field strength at the tip of the metal nano–structures goes to infinity
[Moskovits 1985]. Collective movement of electrons located on the metal roughened
nanostructure stimulated by the incident light called plasmon resonance can modify the electromagnetic field, which surrounds it. The electromagnetic enhancement is explained by a higher value of electromagnetic radiation (both incident and scattered).
The scattered light IR might be described by:
IR ~ α(ER(r, ωS)) (1.11)
where ER(r, ωS) is the total field strength associated with the sample molecule and α is
the molecule polarisability. The total field strength is a sum of external electromagnetic field interacting with the sample and the electromagnetic field, which is emitted by the nanostructure. The energy of dipole – laser light interaction is low, so the influence of external electromagnetic field is quite small in comparison to the electromagnetic field, which is emitted by the nanostructure and enhances the Raman cross section. Additionally, because of plasmon resonance, motions for which the incident and scattered light is perpendicular to the metal surface are enhanced more strongly than motions for which the incident and scattered light is not perpendicular to the metal surface.
1.2.3 TERS
A metal nanostructure can be deposited on the apex of an AFM tip, enhancing the Raman scattering cross–section from the small amount of sample located close to the tip. The physical phenomenon of enhancement was discussed earlier when explaining the SERS effect. Using TERS the area of interest can be probed to a spatial relsoution of less than 20 nm [Chan 2011, Stadler 2010]. The origin of this phenomena can be explained by near–field optics. An evanescent wave that occurs close to small objects is a standing wave, which exponentially decays in space. It can be probed by a tip – nano–antenna, by converting the standing wave into a propagating wave detectable in the far–field. The nanostructure size and shape, the electric properties of the material and the illumination geometry with the type of incident laser light polarisation all
influence the enhancement factor. [Bailo 2008, Groot 2001, Chan 2010, Chan 2011,
Novotny 1997]
1.2.4 Infrared absorption
The energy of phonon excitations and vibrations as well as oscillations of functional groups in molecules correspond to the energy in the infrared region of the electromagnetic radiation spectrum. For this reason, infrared radiation can be absorbed
by a sample. The transition moment Rv of the molecule is given by:
R=
∫
nmdx (1.12)where:
n – the wavefunction of the n state,
– the electric dipole moment operator,
m – the wavefunction of the m state,
can be approximated using Taylor expansion:
=0∂ ∂ xx ∂ ∂ xx 2 ... (1.13) where:
μ0 – molecule dipole momentum in the equilibrium state ,
Insertion of equation (1.13) to equation (1.12) gives:
R=
∫
nmdx∂ ∂ x∫
n
x mdx... (1.14)
The molecule can not exist in the same energetic state at once (
∫
nmdx=0 )which reduces the equation (1.14) to :
R=∂ ∂ x
∫
nx m
dx... (1.15)
and indicates that IR absorption changes the dipole moment of the molecule
∂
∂ x≠ 0 .
molar concentration of the sample (c) and the optical path (l) through the molar extinction coefficient (ε)
IA = εlc (1.16)
The shape of the absorption spectrum depends on the molecular dipole moment and the symmetry of the molecular system (wavefunctions). So it depends on the number of energy levels, their energy values along with electron filled shells and degeneracy of the states.
1.2.5 Molecular vibrations
There are two types of molecular vibrations:
• stretching (ν) – changes in bond length, in–phase symmetric (νsym) and out of
phase asymmetric (νasym),
• deformational motions (def.) and bending (δ) – changes in bond angle, they
might be held in plane as a scissoring (δS) and rocking (δr) or out–of–plane like
twisting (δt), wagging (δw) and torsion (χ).
1.2.6 Multivariate statistical analysis
Molecular spectroscopy techniques can provide vast amounts of data. Additionally, dealing with biological samples requires a large sample numbers for statistical analysis. To extract the most important variables in the data matrix multivariate data analysis can be utilised. This enables the reduction of multidimensional data and thus extraction of information underlying the similarity and the variability of collected data, which can then be interpreted. In this study two kinds of multivariate data analysis were applied: Hierarchical Cluster Analysis and Principal Component Analysis. [Stanisz 2007]
1.2.6.1 UHCA
Unsupervised Hierarchical Cluster Analysis is an unsupervised clustering algorithm designed to produce false colour maps based on spectral similarity and dissimilarity. In this study the k–means algorithm which works by dividing the data in
clusters based on specal simmilarity. During the first step the location of the centroids of the clusters is randomly chosen. Then the distance between each spectrum and centroid is calculated using a Euclidean distance measure. Based on the results, the new centroid location is appointed to minimise the intra–group variance. This step is repeated until the variance achieves the desired level of confidence. [Stanisz 2007]
In this thesis the k–means HCA was applied to the Raman data collected by multidimensional confocal imaging of single isolated cellular nuclei.
1.2.6.2 PCA
The application of Principal Components Analysis (PCA) allows for the reduction of data, resolution of subtle differences in the spectra and the detection sub– groupings within the data. The investigated objects are placed in the space of new orthogonal variables – Principal Components (PC). The new variables are linear combinations of the investigated objects. The most important results are Scores Plots and Loadings Factors.
• The Scores Plots represent the spectra in multidimensional space
– Can be used to detect sample patterns and group them accordingly – Separates the data into their principal components
• Loadings Plots show, which variables in the data set are responsible for the greatest degree of separation
• Each PC has an explained variance
– Explained variance decreases with the increasing PC number:
PC–1>PC–2>PC–3>PC–4>PC–5>PC–6…etc The basic equation of PCA is a linear transformation (1.17):
X = A Z (1.17)
where:
X – the matrix of observable objects (absorbance, Raman signal), A – an orthogonal transformation matrix,
Z – the matrix of new variables PC.
The Z variance should be maximalised under the normalisation condition
∑
i=1
aij=1 After the mathematical transformation the solution of the problem boils down to the diagonalisation of covariance matrix S of X variables
(S – λ 1) = 0 (1.18)
The resulting eigen values of S matrix are sorted in descending order and are interpreted as variations of new variables. [Stanisz 2007]
In the presented thesis PCA was applied both to spectra of control cells and cells treated by various kind of radiation with the aim to determine the general clustering between data and to detect bands responsible for the general clustering, associated with functional groups of biomolecules sensitive to radiation.
1.2.7 Dealing with the baseline
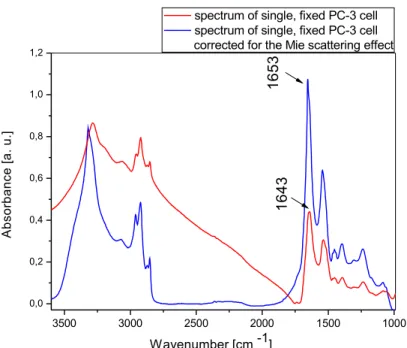
Usually a host of factors can influence the background in SR–FTIR measurements. The scattering of IR especially by dispersion and/or Mie scattering (Mie
scattering is the electromagnetic plane wave scattering by a homogeneous, isotropic
sphere [Stratton 1941]), affects the spectral shape additionally also the peak shifts. Those effects obscure the information about chemical vibrations. In many cases it is not possible to remove these physical effects but by the application of mathematical algorithms the spectral shape can be improved.
The basic model: multiplicative scattering correction (1.19) can be applied or the data may be improved using the extended multiplicative scattering correction (1.20).
ZRaw=ch ZRef (1.19) where:
ZRaw – raw spectrum,
ZRef – reference spectrum,
c – an offset,
ZRaw=cmh ZRefE (1.20)
where additionally:
m – a slope ( – gradient of the sloping baseline, m – constant value of slope),
E – the unmodelled residual energy.
These models are applied prior to multivariate data pre–processing method and linear statistical regression modelling. The correction is done by taking a reference spectrum
ZRef which can be the mean spectrum of the sample data set or a spectrum with
similar spectral features. The algorithm takes the reference spectrum and attempts to
recreate the raw spectrum ZRaw by adding an offset c, a slope m and amplifying
the reference by multiplication h. These contributions can be summarised algebraically. By finding the values of c, m and h using a least squares linear regression method, the spectra can be corrected.
There are many reports on the effect of Mie scattering and dispersion on FTIR spectra of single cells [Kohler 2008, Bassan 2009a, Bassan 2010, Lipiec 2013]. Especially in fixed cells because of spherical shape of cells and organelles and the differences in refractive indexes of the cell and air. In 1957, Van de Hulst published an approximation equation for the Mie scattering efficiency, Q, which is a simpler and less computationally intensive version of the original theory published in 1908 by Mie. The approximation is presented below:
Q=2−4
sin
4
21−cos (1.21)
In above formula =2 d n−1
, n and d denote the ratio of the real refractive
indexes of a particle and the surrounding medium, and d is the diameter of the scattering particle, respectively.
The Q curve is nonlinear function which can be can be approximated by Bassan et al. using a multivariate bilinear model. The model is developed by a choosing 200 values of α (α = 2 d n−1 ) to cover the whole range of d (2 μm – 25 μm) and n (1.1 – 1.5) generating of 200 Q curves and then by an application of Principal Component
Analysis to reduce the number of created data. Based on these approximations the extended multiplicative scattering correction could be improved by adding a factor:
∑
i=1 6
gipi associated with the 6 first loadings controlled by the g parameters. This
model (1.16) called Mie scattering EMSC correction was developed by Kohler et al.
[Kohler 2008]. ZRaw=cmh ZRef
∑
i=1 6 gipi E (1.22)In later publication, the Mie scattering EMSC correction was improved by a choice 1000 values of α and taking into consideration 7 first loadings (Resonant Mie scattering correction (1.21)) [Bassan 2009a]. The main advantage of the Resonant Mie scattering correction is taking into account the refractive index dependency on wavelength.
ZRaw=cmh ZRef
∑
i=1 7 gipi E (1.23)To generate the real, wavelength dependent refractive index parameters the Kremes– Kronig transformation was applied (1.24):
nkk~P
∫
s x k s2−2 ds (1.24) where:
n kk is the real refractive index spectrum minus the average real refractive index,
k is the imaginary part of the refractive index,
P – is the Cauchy Principal value of improper integrals.
The Resonant Mie scattering EMSC correction was applied to correct the data presented by the author. The example of the correction application is presented in Fig. 1.6. The calculations were performed in Matlab software by an application of the algorithm written by Paul Bassan. [Bassan 2009a, Bassan 2009b, Bassan 2010]
1.2.8 An application of SR–FTIR microspectroscopy and the Raman microspectroscopy in radiation research
SR–FTIR microspectroscopy and the Raman microspectroscopy have become potential analytical method in single cells studies [Hamada 2008, Yao 2009, Xie 2002] on a molecular level. A growing amount of literature data demonstrates their usefulness in studies of the conformational aspects of lipids, nucleic acids and other biomolecules. It is known that both methods are sensitive tools that can be applied to DNA damage study at chemical bond level [Hamada 2008, Yao 2009, Xie 2002, Dovbeshko 2000,
Pijanka 2009, Whelan 2011]. FTIR microspectroscopy is useful for cellular membrane
damage investigation [Drobnis 1993].
The application of SR–FTIR and Raman microspectroscopy to DNA damage study in single cells is a new research area. However, early applications of IR and Raman spectroscopy in radiobiology have been reported. Dose dependent changes of model membranes exposed to γ–rays were studied using Raman spectroscopy by Verma et al. Radiation induced decreases in phospholipid unsaturation and increases in their trans– configurations in dipalmitoyl lecithin and polyunsaturated liposomes were observed
Fig. 1.6 The IR spectrum of single fixed PC–3 cell before (red) and after (blue)
RMieEMSC correction. 3500 3000 2500 2000 1500 1000 0,0 0,2 0,4 0,6 0,8 1,0 1,2 1 6 4 3 A b so rb a n ce [ a . u .] Wavenumber [cm -1]
spectrum of single, fixed PC-3 cell spectrum of single, fixed PC-3 cell corrected for the Mie scattering effect
1
6
5
based on the calculation of ratios of the C–C trans vibration at 1064 cm–1 and its
vibration at 1090 cm–1, together with ratios of the cis C=C stretching vibration at 1660
cm–1 and C–H deformation vibration at 1440 cm–1 [Verma 1986, Verma 1990, Verma
1991]. These results were confirmed by Sailer et al. studying peroxidation in a
phospholipid and membrane model system. Additionally the reduced mobility of lipid chains was observed [Sailer 1997].
The radiation damage of nucleic acids were studied by a few independent groups
[Sailer 1996, Dovbeshko 2000, Synytsya 2004, Synytsya 2007]. Sailer et al. using
Raman spectroscopy, observed in calf thymus DNA exposed to γ–radiation (with doses from 0 to 40 kGy) strand breaks, base damage, base–unstacking, pre-melting effects, and disordering of the backbone in the B–DNA form. These results were confirmed by Synytsya et al. Dovbesko et al. applied FTIR spectroscopy to describe dose dependent changes in DNA isolated from low–dose gamma–irradiated epididymis cells of rats from the Chernobyl accident zone. The damage in the primary, secondary and tertiary structure of nucleic acid was investigated, which was correlated to modifications of bases and sugars [Dovbeshko 2000].
Structural changes in secondary structure in protein have been studied [Verma 1993]. Radiation exposure affects the spectral regions assigned to the Amide I, Amide III and side chain amino acid groups. The tyrosine and cysteine side groups were identified as being particularly radiosensitive [Verma 1993]. Raman spectroscopy was also applied to investigate the effects of radiotherapeutically irradiated (gamma–radiation) tissue specimens [Lakshmi 2002] and in vitro proton irradiation of excised tissues [Synytsya
2004]. The sensitivity of FTIR spectroscopy was proven by Gault et al. by detecting
molecular changes during apoptosis in gamma irradiated lymphocytes. The researchers observed shifts in phosphodiester bands and the band assigned to the base stacking mode after radiation exposure [Gault 2003].
Studies on radiation damaged normal human skin cells (HaCaT) were performed by a group from the School of Physics and Radiation and Environmental Science Centre and Dublin Institute of Technology. Cells were irradiated by gamma rays applied in doses ranging from 0 Gy to 5 Gy. One of the most interesting results form this work was the discovery of a correlation between the variation of spectral peak ratios and various
aspects of the physiology of the cell 96 hours after irradiation following a linear– quadratic model. The variation in nucleic acid phosphodiester stretching vibrations was also studied. The results show that the vibrational intensity of phosphodiester stretching motion at 96 hours after irradiation varies in accordance with the Induced Repair (IR).
[Meade 2010a, Meade 2010b]
The next chapters describe the results from radiation studies performed on cells, isolated nuclei and plasmid DNA and monitored with vibrational spectroscopic techniques.
Chapter II
Experimental introduction
2.1 Nucleic acid components under SR–FTIR and Raman microscopies
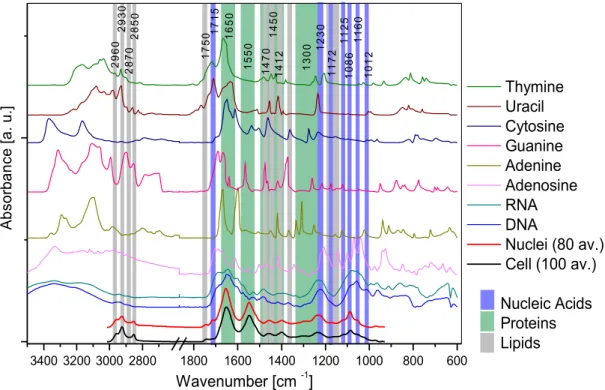
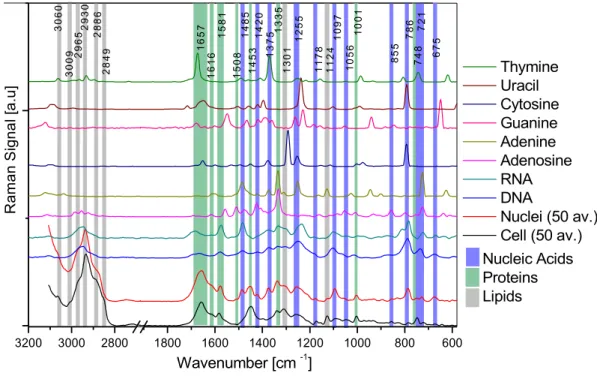
Cells are very complex molecular systems and consequently their Raman and IR spectra are rich in bands from the main cellular components: proteins, lipids and nucleic acids. To achieve the central aim of the thesis, namely to investigate radiation induced damage in DNA and nucleic acids in single cells, spectra of the basic macromolecules and their components were investigated. Fig. 2.1 shows ATR–FTIR spectra of thymine, uracil, guanine, adenine, adenosine, DNA and RNA (SIGMA Aldrich) compared with SR–FTIR spectra of cellular nuclei and single, living cells (COLO–679 cell line). Fig. 2.2 shows the analogous Raman spectra. The following sections outline the methodologies used to record these spectra and details the important band assignments that underpin this research.
2.1.1 Materials and methods
2.1.1.1 FTIR spectroscopy measurement and data processing
ATR–FTIR (Attenuated Total Reflection) spectra of nucleic acids and their components were collected using a Bruker IFS 55 Equinox FTIR microscope system
fitted with a Golden GateTM single bounce diamond Micro–ATR with the diamond top
plate option. Spectra were recorded in the range of 4000 cm–1 – 600 cm–1. For each
spectrum 64 scans were co–added with a spectral resolution of 4 cm–1.
Spectra were processed in Opus 6.5 software. Extended ATR correction (number of ATR reflections: 1, ATR angle of incidence: 45º mean refraction index of the sample: 1.5). Then each spectrum was smoothed (number of smoothing points: 9) and baseline of each spectrum was corrected (rubber–band correction with 16 baseline points and 2– 4 iterations).
2.1.1.2 Raman spectroscopy measurement and data processing
For comparison the samples were investigated by Raman microspectroscopy. Single channel Raman spectra were recorded using a WiTec Confocal Raman Microscope alpha–300 R equipped with Nd–Yag 532 nm (green) laser with a CCD
camera cooled to –60 ºC in the range of 3700 cm–1 – 200 cm–1 and incorporating a 50x
Zeiss objective. The acquisition time was 5–20 second per spectrum, depending on
quality, and the spectral resolution was 2 cm–1.
Raman spectra were also processed using Opus 6.5 software, which included smoothing (number of smoothing points: 13) and baseline correction (rubber–band correction, number of baseline points: 16, number of iterations 2–4).
2.1.1.3 Single cells and nuclei SR–FTIR spectroscopy measurement and data processing
Isolated cellular nuclei and COLO–679 living cells were measured using the IR microspectroscopy beamline at the Australian Synchrotron. The procedure of sample preparation is described in detail in Chapter: 4.2. The SR–FTIR spectra were taken in
transmission mode at a spectral resolution of 4 cm–1 in the spectral range of
4500 cm–1 – 800 cm–1 with 64 interferograms co–added. The spectrum of each cell and
nucleus was collected with an aperture of 11 μm x 11 μm. The spectra presented in Fig. 2.1 are averaged from 100 for cells and 80 for nucleus.
The spectral procession was performed in Opus 6.5 software and included smoothing with 13 smoothing points and baseline correction using the rubber–band algorithm with 16 baseline points (8–9 iterations).
2.1.1.4 Single cells and nuclei Raman spectroscopy measurement and data processing
Cells and extracted nuclei were also investigated using Raman spectroscopy. Living cells were seeded on aluminium coated (200 nm thickness) Petri dishes (35 mm diameter) for 24 hours prior to measurement. Aluminium coated Petri dishes were modified earlier by 15 minutes incubation in 0.01% Poly–L–lysine solution at room temperature and then washed in deionised water. Aluminium coated Petri dishes make excellent substrates for Raman measurements because they are not Raman active and have high reflectivity. A confocal Raman Microscope alpha 300 R equipped with Nd– Yag 532 nm laser and the 60x water immersion objective was used for measurements.
The applied spectral procession procedure was the same as described above (section 2.1.1.3).
2.1.2 Results
Detailed FTIR and Raman band assignments for cells and nuclei spectra are based on comparison with nucleic acids and their nucleotides along with lipids and proteins. These assignments appear in Table 2.1 and Table 2.2, respectively.
Fig. 2.1 The FTIR spectra of cells, cellular nuclei, nucleic acids and nucleotides.
3400 3200 3000 2800 1800 1600 1400 1200 1000 800 600 1 3 0 0 1 5 5 0 1 6 5 0 1 4 50 1 4 1 2 1 4 7 0 17 5 0 2 9 6 0 2 85 0 29 3 0 2 8 7 0 1 0 1 2 1 1 6 0 1 0 8 6 1 12 5 1 1 7 2 12 3 0 Thymine Uracil Cytosine Guanine Adenine Adenosine RNA DNA Nuclei (80 av.) Cell (100 av.) Nucleic Acids Proteins Lipids A bs or ba nc e [a . u .] Wavenumber [cm -1] 17 1 5
Table 2.1 FTIR band assignments for spectra of single cells, cellular nuclei, nucleic acids and their components [Mantsch 1996, Kotler 2008, Baynay 2003].
Wavenumber [cm –1] Assignment
1 2960 νsym(CH2) carbohydrates, νasym(CH3)lipids
2 2930 νasym(CH2)carbohydrates, νasym(CH2)lipids, sensitive to hydrocarbon chain
conformation
3 2870 νsym(CH3) lipids
4 2850 νsym(CH2)lipids, sensitive to hydrocarbon chain conformation
5 1740 ν(C=O) lipids, sensitive to hydration and hydrogen bonding – decreasing
frequency with hydration
6 1715 ν(C=O) nucleic acids: G, T, C, base–stacking mode sensitive to DNA conformation
7 1695–1610 Amide I (predominantly ν(C=O)), sensitive to hydration
1690 turns and bands pleated sheets and β–turns from proteins 1670 turns and bends, resulting from anti–parallel
1650 α–helical structure 1640 random coil
1660 β–pleated sheet structure
8 1550 Amide II (predominantly δ(N–H) coupled to ν(C–N)) sensitive to hydration
9 1470 δ(CH2) lipids, sensitive to hydration
10 1450 δ(CH3) lipids
11 1412 δ(CH2) lipids, α–methylene, sensitive to conformation of the linkage to the
glycerol, backbone
12 1300 Amide III, in phase combination of δs(N–H) and ν(C–N) and δ(CH2)
sensitive to secondary structure folding
13 1230 νsym(O–P–O) DNA backbone, sensitive to conformational changes
14 1172 νasym(O–P–O) A form RNA
15 1125 ν(P–O–C), ν(O–C), ν(C–C–O–C) ribose–DNA backbone
16 1086 νsym(O–P–O), DNA backbone, intensive of B to A transition
17 1060 ν(C–O) DNA backbone, νaym (O–P–O) A form RNA
18 1012 Furanose vibration, strongly enhanced in Z DNA
ν – stretching, νsym – symmetric stretching, νasym – asymmetric stretching, δ – bending, δs– scissoring (in–plane bending), δr rocking (out–of–plane bending)
Table 2.2 Raman spectral band assignments for single cells and isolated cellular nuclei.
Wavenumber [cm–1] Assignment
1 3060 ν(=CH) lipids [Schulz 2007]
2 3009 νasym(=C–H) lipids, fatty acids [Shetty 2006]
3 2965 νasym(CH3) [Shetty 2006]
4 2930 νasym(CH2) [Shetty 2006]
5 2886 νsym(CH3) [Shetty 2006]
6 2849 νsym(CH2) [Shetty 2006]
7 1657 ν(C=C) Amide, ν(C=O) carbonyl [Malini 2006, Kaminaka 2001,
Kamianka 2002]
• collagen assignment [Frank 1995, Viehoever 2003] • α–helix [Shetty 2006]
ν(C=C) cis, lipids, fatty acids [Shetty 2006, Krafft 2005]
8 1616 ν(C=C) phenylalanine, tyrosine [Notingher 2004] tryptophan (protein
assignment) [Huang 2003]
9 1581 ν(C–C) Pyrimidine ring, nucleic acids [Stone 2002, Stone 2004,
Naumann 1998]
δ(C=C), phenylalanine [Huang 2003]
10 1508 ring–breathing modes in the DNA bases: A, C [Chan 2006]
Fig 2.2 Raman spectra of cells, cellular nuclei, nucleic acids and nucleotides. 3200 3000 2800 1800 1600 1400 1200 1000 800 600 Nucleic Acids Proteins Lipids Thymine Uracil Cytosine Guanine Adenine Adenosine RNA DNA Nuclei (80 av.) Cell (100 av.) Nucleic Acids Proteins Lipids 2 8 49 3 0 6 0 3 0 0 9 Thymine Uracil Cytosine Guanine Adenine Adenosine RNA DNA Nuclei (50 av.) Cell (50 av.) R a m a n S ig n a l [ a .u ] Wavenumber [cm -1] 1 4 2 0 1 5 8 1 1 6 5 7 1 4 85 1 4 5 3 1 5 0 8 1 6 16 2 9 6 5 28 8 6 2 9 3 0 1 1 24 1 1 7 8 1 2 5 5 1 3 0 1 1 3 3 5 1 3 7 5 109 7 1 0 5 6 7 2 1 7 48 7 8 6 8 5 5 1 00 1 6 7 5
11 1485 ring–breathing modes in the DNA purine bases G, A [Chan 2006, Stone
2004]
12 1453 δ(CH2) [Kaminka 2002, Tan 2003, Lakshimi 2002, Malini 2006]
δ(CH2) in malignant tissues [Shafer–Peltier 2002]
def.(CH3) [Dukor 2002, Frank 1995]
def.(CH3) breast tissue [Frank 1995]
def.(C–H) lipids, amino acids side chains of the proteinsand carbohydrates) [Naumann 1998]
13 1420 δ(CH2) proteins, lipids [Lau 2003]
14 1375 δ(CH3) lipids [Kateinen 2007]
15 1335 δw(CH3), δw(CH2) collagen, nucleic acids [Huang 2003]
16 1301 δt(CH2), δw(CH2) lipids, fatty acids [Gniadecka 1997]
(α–helix) [Lakshimi 2002]
17 1255 νasym(O–P–O) originates from the phosphodiester groups of the nucleic
acid backbone and is sensitive to conformation change [Cheng 2005]
18 1178 C, G [Ruiz–Chica 2004]
19 1124 ν(C–C) skeletal of acyl backbone in lipid (trans–conformation) [Cheng
2005], (C–N), proteins, ν(C–C) lipids and proteins [Huang 2003]
20 1097 νsym(O–P–O) DNA, [Chiriboga 1998, Chan 2006]
21 1056 νsym(O–P–O) RNA chain, ν(C–C) lipids, ν(C–O), ν(C–C) carbohydrates
[Notingher 2004]
ν(C–C) skeletal [Huang 2005]
22 1001 (C–C) phenylalanine, collagen assignment, skeletal motion [Frank
1995, Chan 2006, Cheng 2005]
23 855 (C–O–C) skeletal mode of polysaccharides, pectin [Shetty 2006]
Proline, tyrosine [Huang 2003]
ν(C–C), proline δt(CCH), ring breathing, tyrosine (protein assignment
and polysaccharide) [Huang 2003]
δ(CCH) phenylalanine, olefinic (protein assignment and polysaccharide)
[Kateinen 2007]
24 786 ν(O–P–O), cytosine, uracil, thymine [Stone 2004]
pyrimidine ring–breathing mode [Farguharson 2005]
(C'5–O–P–O–C'3) phosphodiester bands in DNA [ Notingher 2004]
25 748 T, ring–breathing mode of DNA/RNA bases [Chan 2006, Binoy 2004]
symmetric breathing of tryptophan (protein assignment) [Huang 2003, Stone 2002, Cheng 2005]
26 721 (C–N) membrane phospholipid head/nucleotide peak [Stone 2002]
Symmetric stretch vibration of choline group
ν(CH3), characteristic for phospholipids [Krafft 2005]
ring breathing mode of DNA/RNA bases, A [Chan 2006] (C–S) proteins, δr(CH2 ) A [Stone 2004]
27 675 ring–breathing modes in the DNA bases G, T, tyrosine–G, backbone in
RNA[Stone 2004]
ν(C–S) stretching mode of cystine (collagen type I) [Deng 2005] ring–breathing modes in the DNA bases [Chan 2006]
ν – stretching, νsym– symmetric stretching, νasym – asymmetric stretching, δ – bending, δs – scissoring (in
Fig. 2.1 and Fig. 2.2 and the corresponding Tables 2.1 and 2.2 show that FTIR and Raman spectroscopy can provide a wealth of information about the chemical bonds in lipids, proteins and nucleic acids. However, analysis of nucleic acids especially following DNA radiation damage can be complicated because of strong absorptions from lipids and proteins. The DNA backbone gives a strong Raman and FTIR signal in
spectral range 1260 cm–1– 1050 cm–1, which is in the region that one would expect to
observe changes resulting from single and double strand breaks (SSB and DSB, respectively). It is expected that spectral changes resulting from base damage could be observed in a few spectral regions including: 1) decrease or shift in the nucleotide
conformational band at ~720 cm–1 confirming 6–4 lesions, 2) changes in bands
associated with the nuclear base structures, which appear at ~1480 cm–1 and 1510 cm–1,
3) changes in position of the base pairing vibrations between ~1720 cm–1– 1650 cm–1
where purine/pyrimidine dimers absorb and 4) changes in the base–stacking vibration
between 1720 cm–1– 1710 cm–1. All radiation dependent changes will be described in
detail in following paragraphs and Tables.
2.2 An analysis of radiation damage in DNA, nucleotides and
adenosine
In this thesis the influence of ionising and non–ionising radiation on DNA is described at various levels including: cellular population, single cells, cellular nuclei along with nucleic acids and their derivatives. The approach was to build up from the level of the molecule to the cell investigating the effects of ionising radiation at each step in the hope of gaining a systematic understanding of the molecular changes associated with radiation exposure.
2.2.1 Methodology
The methodology of spectra collection and data processing was the same for all used DNA components: thymine, cytosine, guanine, adenine, adenosine and DNA.
![Table 2.1 FTIR band assignments for spectra of single cells, cellular nuclei, nucleic acids and their components [Mantsch 1996, Kotler 2008, Baynay 2003].](https://thumb-eu.123doks.com/thumbv2/9liborg/3013794.4501/38.892.147.788.144.895/assignments-spectra-cellular-nucleic-components-mantsch-kotler-baynay.webp)
![Fig. 2.4 Products derived from T detected after interaction with free radicals, redrawn from [Sonntag 2006].](https://thumb-eu.123doks.com/thumbv2/9liborg/3013794.4501/43.892.195.743.128.423/fig-products-derived-detected-interaction-radicals-redrawn-sonntag.webp)