TRENDS IN SPORT SCIENCES Vol. 1(24) 27
TRENDS
in
Sport Sciences
2017; 1(24): 27-30 ISSN 2299-9590 Received: 13 May 2016 Accepted: 24 October 2016Corresponding author: a.golas@awf.katowice.pl
1 The Jerzy Kukuczka Academy of Physical Education, Department of Sports Training, Katowice, Poland
2 The Jerzy Kukuczka Academy of Physical Education, Department of Sports Training, Katowice, Poland
3 The Jerzy Kukuczka Academy of Physical Education, Human Performance Laboratory, Katowice Poland
ARTUR GOŁAŚ1, MICHAŁ KRZYSZTOFIK1, MIŁOSZ DROZD1, ROBERT ROCZNIOK1,
MARTA TREBERT2, TOMASZ ZAJĄC3, ADAM MASZCZYK1
Changes of internal structure of movement
in speed skating
ORIGINAL ARTICLE
Introduction
S
peed skating is a competitive form of ice skating inwhich the athletes race each other at distance from 500 to 10000 m. Types of speed skating are long track speed skating, short track speed skating, and marathon speed skating. In the Olympic Games, long-track speed skating is usually referred to as just “speed skating”, while short-track speed skating is known as “short track”. The results in this sport discipline depend on motor skills acquired through training, abilities of using them in sports technique action, emotional engagement and also, but to a lesser extent, tactics.
In contemporary sport, a high level of physical fitness is one of the dominant elements of success. The main factors that determine success in speed skating include technique and muscular strength of the lower limbs. Strength training programs are based on exercises performed under dynamic conditions involving both concentric and eccentric muscle contractions. The scientific literature from the last 20 years demonstrates that the adaptations obtained through this type of training include improvements in the following variables related to strength: a) neuromuscular system (increasing the transversal section of skeletal muscle as well as its contractile capacity); b) skeletal system (increasing bone mineral density); c) cardiovascular system (assisting in the regulation of lipid metabolism as well as improving stroke volume and heart output); d) metabolic profile (improving muscular sensitivity and increasing glucose consumption, as well as increasing insulin response); e) psychological (motivation, concentration, mental well-being) [1]. In speed skating the main components of specific fitness include acceleration, anaerobic sprint ability and explosive
Abstract
Speed skating is a competitive form of ice skating in which the athletes race each other at distances from 500 to 10000 m. In speed skating the main components of specific fitness include acceleration, anaerobic sprint ability and explosive power of the lower extremities. A specific starting pattern in speed skating affects the relationships between strength of individual muscle groups. The main aim of this study was to analyse the pattern of internal structure of specific speed skating movements depending on their velocity – % PSE. The study examined six female athletes from the Polish National Speed Skating Team. The results of muscle activity index (4/7 and 4/10 PES mean) revealed statistically significant differences for the GM (Z=2.36; p=0.017), A (Z=2.02; p=0.04) and BF (Z=2.20; p=0.027) muscles respectively. The same analysis was performed for differences between peak activities at intensities of 4/7 PES and 4/10 PES. The results revealed statistically significant differences for the TFL (Z=2.52; p=0.011) and A (Z=2.20; p=0.027) and BF (Z=2.36; p=0.017) muscles. The results obtained in this study show that the more effective use of Gluteus Medius (GM), Adductor (A), Biceps Femoris (BF) and Tensor Fasciae Latae (TFL) muscles substantially improves starting speed in speedskating.
TRENDS IN SPORT SCIENCES
28 March 2017
GOŁAŚ, KRZYSZTOFIK, DROZD, ROCZNIOK, TREBERT, ZAJĄC, MASZCZYK
power of the lower extremities. A specific starting pattern in speed skating affects the relationships between strength of individual muscle groups. There is very limited published scientific data concerning the internal structure of movements in speed skating. Interesting information can be obtained from the evaluation of muscle strength in the aspect of muscle force topography, understood as the contribution of individual muscle groups to a specific task [2, 3]. For example, a comparison of elite athletes involved in the same sport discipline at different speeds of movement, can help evaluate the differences between contributions of muscle force to maximum force. The increased velocity is naturally followed by an increased recruitment of motor units and higher excitation frequency in order to achieve the necessary force of contraction [4]. Based on the current knowledge, the main aim of this study was to analyse the pattern of internal structure of specific speed skating movements depending on their velocity – % PSE [5].
Methods
The study examined six female athletes from the Polish National Speed Skating Team (age 24±3 yrs, body mass 59±5.9 kg, height 165±7 cm). The main session consisted in the execution of 5 side movements on the slide board in both directions (length 200 cm width 60 cm). Subjects performed 3 sets of speed compatible with on the scale of perceived exertion (0=no effort; 10=maximum effort; PES) first the intensity of 4 out of 10, second with the intensity of 7 out of 10 and 7 out of 10 and last with the intensity of 10 out of 10 (maximal effort) individually for each of the subject. A 5-minute rest period was administered between the trials. An eight-channel Noraxon
TeleMyo 2400 system (Noraxon USA Inc., Scottsdale, AZ; 1500 Hz) was used for recording and analysis of biopotentials from the muscles. Activity was measured for eight muscles: Vastus Lateralis (VL), Vastus Medialis (VM), Adductor (A), Tensor Fasciae Latae (TFL), Gluteus Medius (GM), Biceps Femoris (BF), Gastrocnemius (G), and Tibialis Anterior (TA). The choice of muscles considered for analysis was made after consulting with coaches of the National Speed skating Team. Before placing the gel coated self-adhesive electrodes (Dri-Stick Silver circular sEMG Electrodes AE-131, NeuroDyne Medical, USA), the skin was shaved, abraded and washed with alcohol. The electrodes (11 mm contact diameter and a 2 cm center-to-center distance) were placed along the presumed direction of the underlying muscle fiber according to the recommendations by SENIAM [6]. The EMG signals were sampled at a rate of 1000 Hz. Signals were band pass filtered with a cut off frequency of 8 Hz and 450 Hz, after which the root-mean-square (RMS) was calculated. All the electrodes were located on the right side of the participant, regardless of whether this was the dominant side. The grounding electrode was placed on the connection with the VL muscle. The video recording was used for identification of the beginning and the end of the movement. After completion of all the tests, two five-second tests of static exercise were performed in order to normalize electromyographic records according to the SENIAM procedure [6, 7].
Results
Due to a lack of randomization in the sample, a nonparametric Wilcoxon’s matched pairs test for mean values of muscle activity was used. The results of
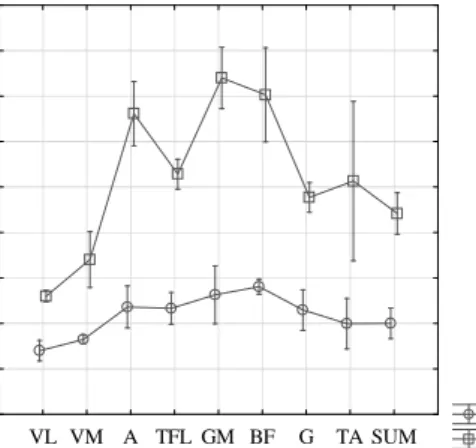
1 PES(4/7) - mean PES(4/10) - mean VL VM A TFL GM BF G TA SUM -20 0 20 40 60 80 100 120 140 160 M u sc u la r a ctiv ity 1 PES(4/7) - peak PES(4/10) - peak VL VM A TFL GM BF G TA SUM -20 0 20 40 60 80 100 120 140 160 M u sc u la r a ctiv ity
Figure 1. The differences between the activities at intensity
of (4/7 PES mean) and (4/10 PES mean) are expressed as the percentage of muscle activity index (differences between activities on the scale of perceived exertion (0=no effort; 10=maximum effort; PES))
Figure 2. The differences between the activities at the
intensity of (4/7 PES peak) and (4/10 PES peak) are expressed as percentage of muscle activity index (differences between activities on the scale of perceived exertion (0=no effort; 10=maximum effort; PES))
TRENDS IN SPORT SCIENCES
Vol. 1(24) 29
CHANGES OF INTERNAL STRUCTURE OF MOVEMENT IN SPEED SKATING
muscle activity index (4/7 and 4/10 PES mean) revealed statistically significant differences for the GM (Z=2.36; p=0.017) and A (Z=2.02; p=0.04) and BF (Z=2.20; p=0.027) muscles respectively (Figure 1). The same analysis was performed for differences between peak activities at intensities of 4/7 PES and 4/10 PES. The results revealed statistically significant differences for the TFL (Z=2.52; p=0.011) and A (Z=2.20; p=0.027) and BF (Z=2.36; p=0.017) muscles (Figure 2).
Discussion
Training to increase neuromuscular fitness has been shown to be effective at increasing athletic performance. Previous studies have found that the internal structure of movement activities changes depending on the external load [8, 9] and conditions in which the movement task is performed [10, 11]. Neuromuscular training is carried out by bearing an external resistance using internal strength, with multiple sources of resistance available, such as dumbbells, barbells, inert resistance or hydraulic resistance. EMG is a tool that can significantly contribute to the understanding of the effects of exercise order on muscular activity. Evaluation of bioelectrical muscle activity provides information about the causes of movement, which helps in understanding of their effects. This allows collecting data about muscle coordination patterns generated by the nervous system. None of the muscles shows mean and peak activity if the movement is performed at the intensity of 4/7 PES. This suggests that a specific pattern of muscle recruitment is maintained at different exertion intensity. However, the increase in speed (4/10 PES) causes a significant increase in the activity of individual muscles, demonstrating their main propulsive function in performing of 5 movements on the slide board (in both directions). This motor task is similar to the movement structure of speed skating. The mean values between the two muscle activity indexes (4/7 and 4/10 PES) revealed statistically significant differences for the GM, A and BF muscles which reflects its significant contribution to the increase in starting speed. Also the peak value of muscle activity between the two different muscle activity indexes (4/7 and 4/10 PES) revealed statistically significant differences for the TFL, A and BF muscles which reflects its significant contribution to the increase in starting speed. Higher activity of these muscles during competition most likely allow for generating faster speeds at particular distances in speed skating [12].
Changes in muscle activity with respect to various values of load have been documented in a vast array of studies. However, few studies have provided insight
into the muscle activity for specific motor tasks at different motion speeds. The EMG procedure used in our study represents a somehow innovative approach, but it is consistent with all the reasoning tendencies for this measurement methodology [13, 14].
In the literature, the increase in load (e.g. weight, speed, and rate) leads to modifications of muscle activity patterns during performance of various motor tasks. Changes in muscle activity reflect how the muscle forces act and it is the main cause (apart from gravitational forces) of movement of lower and upper limbs or sports equipment [9, 15]. For example, a study on the shoulder girdle demonstrated that different parts of muscles are activated in all shoulder movements, with one part that acts as a source (driving force) of propulsion and the other engaged in stabilization of the humerus on the articular facet the acetabulum [16]. According to Frost et al. [17] the difference in activity of the muscles of the shoulder girdle during comparison of work with free weights and using the exercise machine can be attributable to the increased stiffness in the shoulder joint, which eliminates the need for using the anterior and medial part of the deltoid muscle against the supination and adduction of the humerus [18, 19]. The change in the external load proposed by the authors of this study, resulting from the changes in application of the motion speed substantially affects the changes in the activity patterns and allows for the emphasis on the muscles that determine the effectiveness of the motor task. Lemmer et al. [20] indicated that women have a reduced capacity of maximum muscle strength production, and consequently show more PES in efforts that require higher interventions of studied muscle groups.
A methodological limitation of the study is the lack of possibilities for evaluation of the external structure of the movement (forces and moment of forces) and small sample of the study group, which substantially reduces the opportunities for interpretation of the results. The small size of the group is caused by the fact that the study examined the whole National Polish Speed skating Team, which was limited to 6 athletes. A comparison of these results with other national teams (e.g. German team) and connection of the internal structure (analysis of muscle activity) with the external structure (characterization of accelerations and velocity and movement in the space) will substantially enhance the research potential in this sport discipline [21].
Practical applications
Determination of the dominant muscles which allow for the increase in motion speed during the start performed
TRENDS IN SPORT SCIENCES
30 March 2017
GOŁAŚ, KRZYSZTOFIK, DROZD, ROCZNIOK, TREBERT, ZAJĄC, MASZCZYK
by elite speedskatetrs represents a valuable material to be used in coaching practice. The results obtained in the study show that the more effective use of the Gluteus Medius (GM), Adductor (A) and Biceps Femoris (BF), as well as the Tensor Fasciae Latae (TFL) muscles substantially improves the speed of the start in Speedskating. With the methodology adopted in the study, individual measurement of activity will allow for determination of the muscles that are most significant for propulsion in speedskating. The obtained results were used by the national coaches for planning strength and conditioning programs of the National Polish Speedskating Team.
Acknowledgments
The author’s research is funded by a grants of Ministry of Science and Higher Education of Poland (NRSA3 03953 and NRSA4 040 54).
References
1. Garber CE, Blissmer B, Deschenes M, et al. Quantity and quality of exercise for developing and maintaining cardiorespiratory, musculoskeletal, and neuromotor fitness in apparently healthy adults: guidance for prescribing exercise. Med Sci Sports Exerc. 2011; 43: 1334-1359.
2. Sotiropoulos K, Smilios I, Christou M, et al. Effects of warm-up on vertical jump performance and muscle electrical activity using half-squats at low and moderate intensity. J Sports Sci Med. 2010; 9: 326-331.
3. Qi L, Wakeling J, Grange S, et al. Changes in surface electromyography signals and kinetics associated with progression of fatigue at two speeds during wheelchair propulsion. J Rehabil Res Dev. 2012; 49: 23-34.
4. Van Damme BB, Stevens VK, Van Tiggelen DE, et al. Velocity of isokinetic trunk exercises influences back muscle recruitment patterns in healthy subjects. J Electromyogr Kines. 2013; 23: 378-386.
5. Lagally K, Robertson R. Construct validity of the OMNI resistance exercise scale. J Strength Cond Res. 2006; 20(2): 252-256.
6. Hermens HJ, Freriks B, Disselhorst-Klug C. et al. Development of recommendations for SEMG sensors and sensor placement procedures. J Electromyogr Kines. 2000; 10(5): 361-374.
7. Saeterbakken AH, Fimland MS. Electromyographic activity and 6RM strength in bench press on stable and unstable surfaces. J Strength Cond Res. 2013; 27(4): 1101-1107.
8. Wahl MJ, Behm DG. Not all instability training devices enhance muscle activation in highly resistance-trained
individuals. J Strength Cond Res. 2008; 22(4): 1360-1370.
9. Snarr RL, Esco MR, Witte EV, et al. Electromyographic activity of rectus abdominis during a suspension push-up compared to traditional exercises. J Exer Phys online. 2013; 16(3): 1-8.
10. Marshall PWM, Murphy BA. Increased deltoid and abdominal muscle activity during Swiss ball bench press. J Strength Cond Res. 2006; 20(4): 745-750.
11. Anderson GS, Gaetz M, Holzmann M, et al. Comparison of EMG activity during stable and unstable push-up protocols. Euro J Sport Sci. 2011; 13(1): 42-48.
12. Stastny P, Tufano JJ, Gołaś A, et al. Strengthening the gluteus medius using various bodyweight and resistance exercises. Strength Cond J. 2016; 38(3): 91-101.
13. Glass S, Armstrong T. Electromyographical activity of the pectoralis muscle during incline and decline bench press. J Strength Cond Res. 1997; 11: 163-167.
14. Santana JC, Vera-Garcia FJ, McGill SM. A kinetic and electromyographic comparison of the standing cable press and bench press. J Strength Cond Res. 2007; 21: 1271-1279.
15. Maszczyk A, Gołaś A, Czuba M, et al. EMG analysis and modelling of the flat bench press using artificial neural networks. South Afr J Res Sport, Phys Edu Recreation. 2016; 38(1): 95-103.
16. Baechle TR, Earle RW, Wathen D. Resistance training. In: Baechle TR, Earle RW, eds., Essentials of strength training and conditioning. Champaign, IL: Human Kinetics; 2008; 381-412.
17. Frost DM, Cronin JB, Newton RU. A comparison of the kinematics, kinetics and muscle activity between pneumatic and free weight resistance. Eur J of Appl Physiol. 2008; 104(6): 937-956.
18. Requena B, Zabala M, Ribas J, et al. Effect of post-tetanic potentiation of pectoralis and triceps muscles on bench press performance. J Strength Cond Res. 2005; 19: 622-627.
19. Robbins DW, Young WB, Behm DG. et al. The effect of a complex agonist and antagonist resistance training protocol on volume load, power output, electromyographic responses, and efficiency. J Strength Cond Res. 2010; 24(7): 1782-1789.
20. Lemmer T, Martel G, Hurlbut D, et al. Age and sex differentially affect regional changes in 1 repetition maximum strength. J Strength Cond Res. 2007; 21(3): 731-737.
21. Król H, Golas A, Sobota G. Complex analysis of movement in evaluation of flat bench press performance. Acta Bioeng Biom. 2010; 12: 93-98.