STUDIES IN PHYSICAL CULTURE AND TOURISM Vol. 16, No. 4, 2009
BEATA PLUTA, MARCIN ANDRZEJEWSKI, DARIUSZ POSIADAŁA University School of Physical Education, Poznań, Poland
A COMPARABLE ANALYSIS OF DIAGNOSTIC
AND CLASSIFICATION FEATURES OF PROFESSIONAL BASKETBALL PLAYERS
Key words: comparable analysis, diagnostic and classification features, database, basketball.
ABSTRACT
The aim of the study was to present a statistical analysis of two somatic features of basketball players, which determine their sport usefulness (body height – variable X, body weight – variable Y). These features vary across different domestic basketball leagues. Apart from the diagnostic features, there are also numerous classification features (e.g. age of players). Complete information about the players’ parameters was stored in a database (DB).
For the purpose of the present work and in order to compare various research results concerning basketball players from the American league (NBA) and the Polish league (POL), some variables and class ranges were chosen referring to the player’s position on a basketball court (P), date of birth (D) and domestic league (L). The above classification features (L, P, D) and diagnostic features X and Y allow many different one-way, two-way and three-way cross classifications, comprising an analysis of one or two of the features. The statistical one-dimensional analysis included descriptive statistics, frequency tabulation and Pareto chart. The statistical two-dimensional analysis embraced linear correlation coefficients between features X and Y and correlation scatter graphs. As many as 267 possible classifications were found, but only the ones of special interest were selected for analysis. The presented classification schemes contain the appropriate numerical data.
The statistical methods used for the analysis of subjects’ age, body height and body weight revealed significant differences between the American and Polish basketball players. The methodology of the used empirical data analysis can be applied to players of any other team games.
INTRODUCTION
The concept of sport potential in team games, primarily in basketball, has been subject to numerous research studies. Determination of the sport potential of basketball players and basketball teams is very useful in development of training methods. Sport potential is based on the selection of somatic features considered to be diagnostic, usually body weight and body height [5, 7, 8, 9, 11, 15, 19]. Apart from the somatic traits also
classification features are distinguished such as date of birth, position on the court, club membership, etc. The collection of these features makes it possible to construct a database (DB) consisting of fields of elementary information about basketball players [1, 10, 17, 18]. Such a database can be created by means of an MS Excel. Statistical analysis of basketball players should include descriptive statistics and tabular and graphic representation. Spreadsheets are very helpful in attaining the above tasks [18, 19]. A spreadsheet
Correspondence should be addressed to: Beata Pluta, University School of Physical Education, ul. Rybaki 19, 61-884 Poznań, e-mail: bpluta@tir.awf.poznan.pl
enables to create mathematical formulas and shows results of calculations in tabular forms. Thanks to its sorting and filtering functions various classify-cations and comparisons can be made. This present study describes the preparation of an MS Excel database of American league (NBA) and Polish league (POL) basketball players in the season of 2005/2006.
METHODS
The data for the study were taken from the Internet websites of the Polish Basketball League (www.plk.pl), Polish Basketball Association (www.pzkosz.pl), www.e-basket.pl, www.koszkadra.pl, www.polskikosz.pl, www.fiba.com, www.nba.com as well as from electronic versions of specialist
basketball magazines, e.g. Basket News, Super
Basket, Basketball, Basketball Digest. The length of
each database record depended on the complexity of the data, which was different for each basketball league in question. The records in the DB are as follows:
F1 F2 F3 F4 F5 F6 F7
F1 – ordinal number, F2 – player’s initials, F3 – domestic league, F4 – position on the court, F5 – year of birth,
F6, F7 – values of somatic features X and Y.
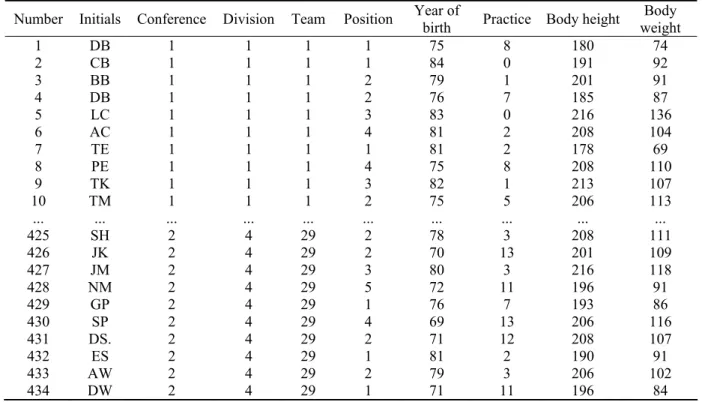
Table 1. Register data of the NBA players in the season of 2005/2006
Number Initials Conference Division Team Position Year of birth Practice Body height weight Body
1 DB 1 1 1 1 75 8 180 74 2 CB 1 1 1 1 84 0 191 92 3 BB 1 1 1 2 79 1 201 91 4 DB 1 1 1 2 76 7 185 87 5 LC 1 1 1 3 83 0 216 136 6 AC 1 1 1 4 81 2 208 104 7 TE 1 1 1 1 81 2 178 69 8 PE 1 1 1 4 75 8 208 110 9 TK 1 1 1 3 82 1 213 107 10 TM 1 1 1 2 75 5 206 113 ... ... ... ... ... ... ... ... ... ... 425 SH 2 4 29 2 78 3 208 111 426 JK 2 4 29 2 70 13 201 109 427 JM 2 4 29 3 80 3 216 118 428 NM 2 4 29 5 72 11 196 91 429 GP 2 4 29 1 76 7 193 86 430 SP 2 4 29 4 69 13 206 116 431 DS. 2 4 29 2 71 12 208 107 432 ES 2 4 29 1 81 2 190 91 433 AW 2 4 29 2 79 3 206 102 434 DW 2 4 29 1 71 11 196 84
Conference: 1 – East, 2 – West;
Division: 1 – Atlantic, 2 – Central, 3 – Southwest, 4 – Northwest, 5 – Pacific;
Position on the basketball court: 1 – point guard, 2 – shooting guard, 3 – center, 4 – small forward, 5 – power forward;
Teams: 1 – Boston Celtic, 2 – Miami Heat, 3 – New Jersey Nets, 4 – New York Knicks, 5 – Orlando Magic, 6 – Philadelphia 76ers, 7 – Washington Wizards, 8 – Atlanta Hawks, 9 – New Orleans Hornets, 10 – Chicago Bulls, 11 – Cleveland Cavaliers, 12 – Detroit Pistons, 13 – Indiana Pacers, 14 – Milwaukee Bucks, 15 – Toronto Raptors, 16 – Dallas Mavericks, 17 – Denver Nuggets, 18 – Houston Rockets, 19 – Minnesota Timberwolves, 20 – San Antonio Spurs, 21 – Utah Jazz, 22 – Memphis Grizzlies, 23 – Golden State Warriors, 24 – Los Angeles Clippers, 25 – Los Angeles Lakers, 26 – Phoenix Suns, 27 – Portland Trail Blazers, 28 – Sacramento Kings, 29 – Seattle Super Sonics.
In order to compare various research results concerning the basketball players from the American league (NBA) and Polish league (POL), the following variables were provided:
– domestic league: L1 – NBA, L2 – POL;
– position on the court: P1 – point guard, P2 –
shooting guard, P3 – centre, P4 – small forward,
P5 – power forward;
– age class (years of birth): D1 – before 1973,
D2 – between 1974 and 1978, D3 – between
1979 and 1983, D4 – after 1984;
The data on the NBA basketball players are presented in Table 1.
In order to to process the data from spreadsheets 1 and 2 they were copied to spreadsheet 3, which was used to enter the league status: 1 – NBA and 2 – POL. By means of the Excel sorting and filtering functions the initial classification analysis of the data from spreadsheet 3 was carried out (Tab. 2).
The following conclusions can be drawn on the basis of the presented data:
a) among the 653 examined basketball players, including 434 (68.3%) NBA players, there is almost a constant proportion of basketball players on court positions 1 (35.3%) and 2 (36.5%);
b) positions 4 and 5 have almost the same constant proportion of 5.8% and 6.2%, respectively; c) assuming that the proportion of the number
of basketball players in relation to their positions on court 1:2:3:4:5 is such as 35.3:36.5:16.2:5.8:6.2, the POL league differs substantially in this respect.
From the data from spreadsheet 3, it was possible to classify basketball players according to their year of birth. 28 age classes were distinguished – from 1962 to 1989, i.e. players aged 17 to 43 years. For each age class, the following quantities were assigned: number of players (n),
cumulative number of players (q), frequency (n%) and cumulative frequency (q%) (Tab. 3).
The obtained results show that the distribution of the frequency is different for each basketball league. Younger basketball players are dominant in the POL league.
The results of the analysis of one of the classification features are given in Table 4, which presents the data for the three most numerous age classes and for the total number of basketball players born before 1983.
In the case of the Polish league, a significant difference between the most numerous age classes can be noted (Fig. 1) as far as the age classes of basketball players born between 1985 and 1987 are concerned. Older basketball players predominate in the NBA league.
Figure 1 confirms the aforementioned conclusions. The curve of the cumulative frequency of the NBA players is different from the curve of the POL league.
Table 2. Frequency and percentage of basketball players by position on the court Position on the court
1 2 3 4 5 Total League n % n % n % n % n % n % NBA 142 32.7 152 35.0 74 17.1 32 7.4 34 7.8 434 68.3 POL 82 40.8 80 39.8 29 14.4 5 2.5 5 2.5 201 31.7 Total 224 35.3 232 36.5 103 16.2 37 5.8 39 6.2 635 100
Figure 1. Cumulative frequency of basketball players with regard to age group
RESULTS
Analysis of the empirical data referring to the age structure of basketball players
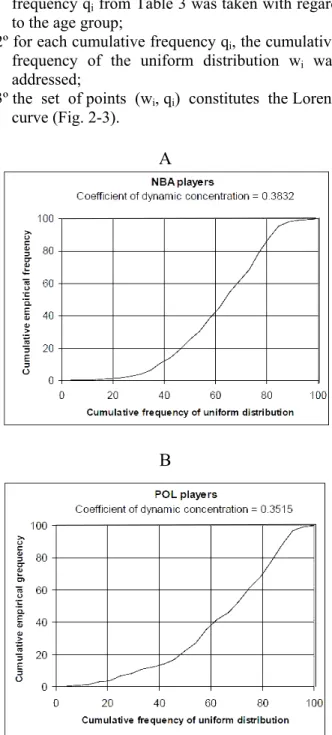
In the statistical analysis of dates of birth of the basketball players from the American and Polish leagues, the measure of concentration was
used. In this paper, the estimation of the intensity of concentration is presented graphically with the aid of the Lorenz curve of dynamic frequency distribu-tion of players (see e.g. [3]):
1º for each basketball league the cumulative frequency qi from Table 3 was taken with regard
to the age group;
2º for each cumulative frequency qi, the cumulative
frequency of the uniform distribution wi was
addressed;
3º the set of points (wi, qi) constitutes the Lorenz
curve (Fig. 2-3).
Table 3. Basketball players by year of birth
NBA POL Year of birth n q n % q % n q n % q % 1962 1 1 0.23 0.23 1963 0 1 0.00 0.23 1964 1 2 0.23 0.46 1965 1 3 0.23 0.69 1966 2 5 0.46 1.15 1 1 0.50 0.50 1967 3 8 0.69 1.84 1 2 0.50 1.00 1968 3 11 0.69 2.53 1 3 0.50 1.49 1969 7 18 1.61 4.15 3 6 1.49 2.99 1970 10 28 2.30 6.45 1 7 0.50 3.48 1971 20 48 4.61 11.06 6 13 2.99 6.47 1972 13 61 3.00 14.06 3 16 1.49 7.96 1973 24 85 5.53 19.59 6 22 2.99 10.95 1974 26 111 5.99 25.58 3 25 1.49 12.44 1975 21 132 4.84 30.41 3 28 1.49 13.93 1976 35
A
B
Figure 2. The Lorenz curves of dynamic distribution of NBA and POL players
167 8.06 38.48 6 34 2.99 16.92 1977 28 195 6.45 44.93 11 45 5.47 22.39 1978 41 236 9.45 54.38 10 55 4.98 27.36 1979 31 267 7.14 61.52 16 71 7.96 35.32 1980 31 298 7.14 68.66 13 84 6.47 41.79 1981 46 344 10.60 79.26 8 92 3.98 45.77 1982 38 382 8.76 88.02 14 106 6.97 52.74 1983 32 414 7.37 95.39 17 123 8.46 61.19 1984 13 427 3.00 98.39 14 137 6.97 68.16 1985 3 430 0.69 99.08 18 155 8.96 77.11 1986 3 433 0.69 99.77 21 176 10.45 87.56 1987 1 434 0.23 100.00 19 195 9.45 97.01 1988 4 199 1.99 99.00 1989 2 201 1.00 100.00 Total 434 x x x 201 x x x
Table 4. Most numerous age groups of basketball players
NBA POL NBA + POL
Year n % Year n % Year n % 1981 46 10.6 1986 21 10.45 1978 51 8.03 1978 41 9.45 1987 19 9.45 1981 54 8.50 1982 38 8.76 1985 18 8.96 1982 52 8.19 to 1983 414 95.39 to 1983 123 61.19 to 1983 537 84.6
The coefficient of dynamic concentration is an abstract measure. If it equals zero, there is no concentration; if it equals one there is total concentration. The shapes of the Lorenz curve for each league are different and so are the values of concentration coefficients.
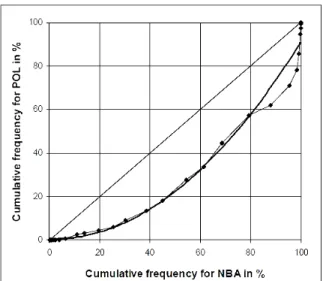
To enable a comparative analysis of the two populations of basketball players, the empirical and estimated Lorenz curve of dynamic location was applied (Fig. 3).
The POL players revealed the highest coefficient of determination. It confirms the similarity of frequency distribution of basketball players from Poland. For the NBA players it is the lowest coefficient value.
Construction of cross-classifications
The above classification features: L (field F3), P (field F4) and D (field F5) and the two diagnostic features: X and Y, enable to create the following possible one-way, two-way and three-way cross-classifications comprising the analysis of one or two features:
a) one-way classifications - total 33 (= 6+15+12): Li (X), Li (Y), Li(X,Y), i = 1, 2; Pj (X), Pj (Y),
Pj(X,Y), j = 1, 2, 3, 4, 5;
Dk (X), Dk (Y), Dk (X,Y), k = 1, 2, 3, 4;
b) two-way classifications - total 114 (= 30+24+60):
Li x Pj (X), Li x Pj (Y), Li x Pj (X,Y); i = 1, 2; j = 1,
..., 5;
Li x Dk (X), Li x Dk (Y), Li x Dk (X, Y); i = 1, 2;
k = 1, 2, 3, 4;
Figure 3. The Lorenz curve of dynamic numerical distribution of NBA and POL basketball players
Pj x Dk (X), Pj x Dk (Y), Pj x Dk (X, Y); j = 1, ..., 5;
k = 1, 2, 3, 4;
c) three-way classifications - total 120 (= 3⋅2⋅5⋅4) Li x Pj x Dk (X), Li x Pj x Dk (Y), Li x Pj x Dk (X,Y),
i = 1, 2, j = 1,..., 5, k = 1, 2, 3, 4.
A
B
Figure 4. Frequency histograms for body height and weight
There are as many as 267 possible classifications in the examined case, but only those of special interest were selected for analysis. The presented classification schemes contain the appropriate numerical data, composed for the purpose of statistical analysis, which include the analysis of features X and Y (one-dimensional analysis) and also analysis of two features (two-dimensional analysis).
The components of the one-dimensional analysis included: (i) descriptive statistics, (ii) frequency tabulation, (iii) Pareto chart. The two-dimensional analysis contained (i) correlation scatter, (ii) linear correlation between features X and Y.
Table 5. Descriptive statistics of Figure 4
Figure Le1) Lt Function R2
4 0.3939 0.0702 Y=0.0001x3–0.0195x2=1.4547x+1.6822 0.9976 Le1) – coefficient of concentration from the estimating curve, Lt – coefficient of concentration from the empirical data,
R2 – coefficient of determination
Analysis of selected cross-classifications with regard to somatic features of the basketball players
To illustrate the presented approach to comparative research, calculations for classify-cations: Li(X), Li(Y), i = 1, 2 were performed
(Table 6).
The analysis shows that the NBA players are superior to the POL players. This is evidenced by the location and variation measures. The same is relevant for the range in the case of the NBA players, which is twice higher than for the POL players. In the case of the two populations of players, there is an insignificant left-sided skewness.
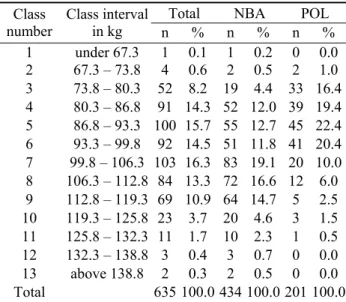
Tables 7 and 8 present the frequency tabulations of the basketball players for their body weight and height, respectively. The class intervals were constructed with regard to all 635 basketball players. The basketball players from the NBA and the POL leagues were assigned to these classes.
Figure 5. Scatter plot of somatic features of all the basketball players
The frequency distribution of body height in all basketball players remains within the range of 5-8. In the case of the NBA players, the frequency distribution is within the range of 7-8. This is different for the POL players – the extreme values of 9-12 are less numerous. In terms of body weight, frequency distribution of the NBA players for ranges 4-9 contains 86.9% of relative frequencies. A similar trend applies to the POL players for the ranges of 3-7 (88.6%). The next two histograms confirm the aforementioned observations.
Table 6. Numerical measures of players’ somatic features L1+L2 L1–NBA L2–POL Numerical measures X Y X Y X Y Min. 159 64 159 64 175 68 Max 231 155 231 155 214 126 Range 72 91 72 91 39 58 Median 201 98 203 102 197 90 Mean 199.77 98.41 201.3 101.5 196.4 91.7 Standard deviation 9.41 13.65 9.68 13.54 7.81 11.29 Variance coefficient 4.71 13.87 4.81 13.33 3.98 12.31 Skewness –0.26 0.33 –0.46 0.14 –0.20 0.67
Scatter plots were used to evaluate the extent of the correlation between the somatic features under the analysis [13, 14]. The first figure shows scatter plots for all the basketball players from the examined leagues.
The scatter plot reveals a concentration of the players in the wide area around the diagonal of the graph. There are also a few deviations from one or 394
both somatic features. The next two figures present the scatter plots of the NBA players only, one showing the total number of the players and the other takes into consideration the player’s position on the court. Figures 6 and 7 both show one distinct deviation (157; 62). For the basketball players on particular positions on the court, i.e. for classifications L1 x Pj (X,Y), i = 1, 2; j = 1, 2, 3, 4,
5, the linear correlation coefficients were calculated (Tab. 9).
Table 9 also presents correlations for L1 x Pj
(X, Y) and L2 x Pj (X, Y). The highest correlation
values are given for the NBA and the POL players. Next, the correlations of particular positions on the court were arranged appropriately.
Figure 6. Scatter plot for NBA basketball players
Figure 7. Scatter plot for NBA basketball players – position 1
Table 9. Linear correlation coefficient
Position on the court NBA POL P1 0.6859 0.5684 P2 0.2955 0.4718 P3 0.2981 0.0345 P4 0.0350 0.2088 P5 0.3210 0.2921 Total 0.8340 0.7314
Table 7. Frequency tabulation of basketball players for body height
Total NBA POL
Class number Class interval in cm n % n % n % 1 under 174.4 1 0.1 1 0.2 0 0.0 2 174.4 – 179.6 7 1.1 4 0.9 3 1.5 3 179.6 – 184.7 21 3.3 16 3.7 5 2.5 4 184.7 – 189.9 79 12.4 35 8.1 34 16.9 5 189.9 – 195.0 86 13.5 42 9.7 44 21.9 6 195.0 – 200.1 114 17.8 62 14.3 52 25.9 7 200.1 – 205.3 130 20.4 91 21.0 39 19.4 8 205.3 – 210.4 119 18.5 98 22.6 21 10.4 9 210.4 – 215.6 69 10.7 66 15.2 3 1.5 10 215.6 – 220.7 11 1.5 11 2.5 0 0.0 11 220.7 – 225.9 6 0.8 6 1.4 0 0.0 12 above 225.9 2 0.3 2 0.5 0 0.0 Total 635 100.0 434 100.0 201 100.0
Table 8. Frequency tabulation of basketball players for body weight
Total NBA POL Class number Class interval in kg n % n % n % 1 under 67.3 1 0.1 1 0.2 0 0.0 2 67.3 – 73.8 4 0.6 2 0.5 2 1.0 3 73.8 – 80.3 52 8.2 19 4.4 33 16.4 4 80.3 – 86.8 91 14.3 52 12.0 39 19.4 5 86.8 – 93.3 100 15.7 55 12.7 45 22.4 6 93.3 – 99.8 92 14.5 51 11.8 41 20.4 7 99.8 – 106.3 103 16.3 83 19.1 20 10.0 8 106.3 – 112.8 84 13.3 72 16.6 12 6.0 9 112.8 – 119.3 69 10.9 64 14.7 5 2.5 10 119.3 – 125.8 23 3.7 20 4.6 3 1.5 11 125.8 – 132.3 11 1.7 10 2.3 1 0.5 12 132.3 – 138.8 3 0.4 3 0.7 0 0.0 13 above 138.8 2 0.3 2 0.5 0 0.0 Total 635 100.0 434 100.0 201 100.0 395
DISCUSSION
Team games, including basketball, are one of the most appealing forms of sport competition. As a form of teamwork, a team game directs the attention of players to solve conflicts so that the opponent has got minimal possibilities to influence the result. A team game, understood as a social phenomenon, is characterized by situational dynamics and transparency; it releases extreme emotions and requires high-risk decisions which result from the necessity to react quickly and with high entropy [15, 16].
Many sport team games share similar characteristics such as team members, age of players, position on the court, specific somatic features, etc. That means they can be analysed according to one common scheme consisting of many records of basic information about the players stored in a database. Its capacity directly influences the quality of any statistical analysis.
Determining the sport potential of basketball players and basketball teams is very useful in development of training methods. It is based on the selection of diagnostic somatic features, usually body weight and body height [2, 6, 16, 20, 21]. Next to them, the group of classification features is distinguished, such as date of birth, position on the court, club membership, etc. The collection of these features enables to design a database (DB) consisting of fields of basic information about basketball players [11, 18].
The numerical data stored in databases containing information about players from particular leagues and basketball federations allow conducting a multidimensional quantitative and qualitative analysis. They provide a complex picture of the age structure of players as well as the dynamics of examined features in given time intervals. The information stored in computer databases concerns both factual and statistical knowledge; it can be permanent (e.g. membership) and dynamic in nature during the season.
The research problems presented herewith confirm the necessity to make comparisons of team sport game players. The presented comparisons between the two basketball federations in Poland and the USA reveal differences in the players’ age structure and court positions. Unfortunately, the structure is disadvantageous for Poland, where young players dominate in basketball and the teams lack experience. Unlike in the USA, long-lasting
professional sport careers are quite scarce in Poland. The statistical analysis also showed the dynamics of changes in the NBA basketball in comparison with Poland. Such an analysis makes it possible to answer various questions concerning the typology of selected somatic features among the contemporary basketball players.
The results presented in this work constitute a part of wider comparative research on different characteristics of players’ sport potential: position on the court, experience, values of standard game elements, and player’s efficiency (activeness, reliability, effectiveness and their value for the team). There have been a number of studies on the subject; however, they have involved basketball players as a whole team, without focusing on particular age groups [5, 6, 7, 8, 12, 14, 19, 20, 22].
Applying adequate quantitative methods in order to process data characterizing players’ performance during a game in an objective and analytic way sets a new range of research. It aims at improving computer simulation programmes which could provide new solutions to sport coaches in the future. The presented methods enable objectiviza-tion of the stored quantitative and qualitative data, followed by its wide-scale interpretation of formal description of player’s actions. Successful data management requires that it is structurally sorted and correctly applied, with regard to the dynamics of changes of information records.
To conclude, it can be stated that the statistical methods of numerical data analysis of the dates of birth used for the purpose of this research helped to indicate differences between the populations of American and Polish basketball players. The methods of empirical data analysis can be used to examine any number of groups of basketball players as well as to characterize groups of other athletes. The analysis should not involve only a single season; it can also be carried out on a wider scale (a few seasons), but the main impediment is the lack of resources to conduct such surveys or collect appropriate data. Not all domestic basketball leagues and federations have a regular survey programme or proper databases. The conclusions presented in the paper confirm the usefulness of an Excel database for the purpose of statistical analysis. The research problems presented herewith confirm the necessity to make comparisons of different team game players.
REFERENCES
[1] Balciunas M. et al., Computer software for the evaluation player’s performance during basketball game in real time, (in:) J. Bergier ed., Obserwacja i ocena działań zawodników w zespołowych grach sportowych (Observation and assessment of players’ performance in team sport games), Mono-graph no. 5, MTNGS, Wrocław, 2004, 21-26. [2] Bazanov B., Vohandu P., Haljand R., Trends in
offensive team activity in basketball, Education. Physical Training. Sport, 2006, vol. 2: 5-11.
[3] Bennett J., Statistics in Sport, Arnold Applications of Statistics, London 1998.
[4] Bose S., O’Sullivan F., A region-based segmenta-tion method for multichannel image data, Journal of the American Statistical Association, 1997, vol. 92: 92-106.
[5] Czerwiński J., Charakterystyka gry w piłkę ręczną na podstawie najnowszych badań, (Characteristics of handball in the light of the latest research) Human Movement, 2001, vol. 1: 99-105.
[6] Czerwiński J. ed., Trening i jego wpływ na efektywność walki sportowej w grach zespołowych (Training and its influence on sport competition effectiveness in team games), AWFiS Gdańsk, 2003.
[7] Dembiński J., Analysis of relationships determining basketball players’ efficiency, Human Movement, 2001, vol. 3: 123-128.
[8] Erčulj F. et al., An analysis of basketball players’ movements in the Slovenian Basketball League play-offs using the Sagit Tracking System, Facta Universitatis: Series Physical Education and Sport, 2008, vol. 6: 75-85.
[9] Gill P.S., Late-game reversals in professional basketball, football and hockey, The American Statistician, 2000, vol. 34: 94-99.
[10] Hernandez M., J. Database Design for Mere Mortals, London, Addison Wesley Longman, Inc. 1998.
[11] Ibanez S.J. et al., Software for the basketball player’s evaluation in real time, International Journal of Performance Analysis in Sport, 2003, vol. 3: 145-155.
[12] Jóźwiak J., Wagner W., Comparative statistical analysis of body height and weight of Polish and NBA professional basketball players in the 1995/96 season. 51st Session of the International Statistical
Institute, Papers from the third meeting of the Sports Statistics Committee, Istanbul 1997, 48-66.
[13] Kopocinski B., Mathematical modelling of results of a football league, Human Movement, 2001, vol. 3: 129-134.
[14] Lidor R., Correlational Relationships between Technical Variables and Final Placing of Basketball Teams, Challenges ahead for improving Sports Statistics, ISI, Beijing, 1995, 229-246.
[15] Naglak Z., Zespołowa gra sportowa (Team sport games), AWF Wrocław, 1994.
[16] Panfil R., Prakseologia gier sportowych (Praxeo-logy of sports games), AWF Wrocław, 2006.
[17] Perez M.A. et al., Software for planning sport training: basketball application, International Journal of Performance Analysis in Sport, 2003, vol. 3: 79-89.
[18] Pluta B., Kategoryzacja i monitoring koszykarskich akcji meczowych i ich analiza statystycznymi testami serii dla profesjonalnego zespołu żeńskiego (Categorizing and monitoring basketball matches’ actions and their analysis using runs tests for the professional women’s team) doctoral dissertation, AWF Poznań, 1996.
[19] Pluta B., Zastosowanie metody rangowania w ana-lizie porównawczej koszykarzy polskich i zagra-nicznych (Application of the rank method for the comparative analysis of Polish and foreign basketball players), (in:) J. Dembiński, Z. Naglak eds, Sprawność działania zawodników w grach sportowych (Players’ effectiveness in team sport games), Monograph no. 1, MTNGS, WTN Wro-cław, 2003, 25-34.
[20] Stonkus S., The retrospective attack structure ana-lysis of top basketball teams, Educations Physical Training Sport, Kowno 2002.
[21] Ważny Z., The system of training in professional sport today, SiT, Warszawa 1981.
[22] Ważny Z. (2001): Systemowe ujęcie procesu tre-ningu sportowego (Systemic view of professional training process), Trening (Training) 3: 172-184.