ASSESSMENT OF RISK AND LOOSES IN PRODUCTION
SYSTEM
Anna Burduk* and Sandra Sulik**
* Faculty of Mechanical Engineering, Wroclaw University of Science and Technology, Wroclaw, 50-370, Poland, Email: anna.burduk@pwr.edu.pl
** Faculty of Mechanical Engineering, Wroclaw University of Science and Technology, Wroclaw, 50-370, Poland, Email: 223035@student.pwr.edu.pl
Abstract The article describes the course of the production process of furniture for a system with a serial structure. A two-month analysis of the production system was carried out, queues at individual machines during production, total time of execution of orders, use of machines, average production capacity have been determinded, as well as the factors that affect the delay in production were identified. A layout of the production hall was also made. All defects on machines within 2 months were also noted. The documentation and analysis of these activities allowed us to assess the risks and losses and propose a way to reduce the risk in order to improve the company's production system.
Paper type: Case Study Published online: 31 July 2019
Vol. 9, No. 3, pp. 157–175
DOI: 10.21008/j.2083-4950.2019.9.3.1 ISSN 2083-4942 (Print)
ISSN 2083-4950 (Online)
© 2019 Poznan University of Technology. All rights reserved.
Keywords: Production risk, Risk assessment, looses assessment, risk elimination, FMEA
1. INTRODUCTION
The furniture industry in Poland is in a very good condition and is still develop-ing. Currently there are 26 thousand entities operating on the market. Most of the companies try to develop their own projects and brands, which results in thousands of new products. The furniture sector in Poland is characterized by high competi-tiveness and focuses mainly on exports amounting to as much as 90% of produc-tion. Poland is ranked 4th in terms of value and 2nd in terms of quantity of furni-ture production in the world. (KGMP, 2017, p. 15). To meet the requirements of the market, companies must constantly develop and introduce new, innovative solutions to their business, and above all, produce products of the highest quality and as fast as possible. To make this possible, companies must strive to stabilize their production systems.
The stability of production systems depends primarily on the existence and im-pact of risk factors. These factors are a fixed element of any production system, they appear randomly in that system, and their presence usually results in the pro-duction process being thrown out of balance. Therefore, identification of risk factors and assessment of their impact and appropriate risk management is a prerequisite for ensuring stability in the course of economic processes (Burduk, 2013, p. 95).
Risk is a concept with many meanings and therefore it is difficult to define. It is usually interpreted differently in scientific fields, which is why some authors are of the opinion that it is impossible to create a single, universal definition of risk (Karmańska, 2008, p. 21). Risk in the production system is defined as a combina-tion of the frequency or probability of occurrence of events that cause a hazard and the consequences of these events. Assessment of the risk in the production system can therefore be defined as an assessment of its reliability. The reliability of a pro-duction system is most often defined as the reliability of objects, which means the ability to hold up in a state that allows the required functions to be fulfilled under given conditions and in a given time interval, assuming that the required external means are provided. This means that the degree of reliability is the fulfilment of the objective or requirements which are defined as the "fulfilment of function require-ments" (Pacaiova, Sinay & Nagyova, 2013, p. 289).
The aim of the article is to assess the risk and looses in the process of furniture production for a serially structured system and try reducing it.
2. THE CONCEPT OF RISK
2.1. Different approaches to risk
The ambiguity of the concept of risk and the lack of a clear definition have led to different approaches to risk being found in the literature. The best known ap-proaches are American and German. The American approach treats risk not only as a possibility of incurring a loss, but also as a profit (Burduk, 2013, p. 96). On the other hand, German approach limits the notion of risk to a negative effect as a re-sult of a decision taken, thus treating risk as a danger of failure to achieve the ob-jective assumed when making a specific decision. Failure to achieve an obob-jective may be expressed both by the occurrence of a loss and a lower than assumed result. Because of the technical character of the production systems, the German ap-proach can be considered appropriate in the risk assessment for these systems. The expected production results must not exceed those allowed, for example, by con-straints related to the organisation of the production process or technology. As a result, many methods of risk analysis and assessment cannot be used in the risk assessment of production systems from an early level, i.e. the level of one- or two-pole risk-treatment. Figure 1 shows the differences in the American and Ger-man approaches to risk definition.
Fig. 1 Differences in the American and German approaches to risk definition (Burduk,
2013, p. 96)
2.2. Risk assessment methods
In scientific publications there are different classifications and naming for risk assessment and analysis methods, but most often there are two classes of methods (Kulińska, 2012, p. 31):
• a class of measurable methods – also known as quantitative methods, enabling the estimation of the size of risk and using numerical data,
• a class of verbal methods – also known as descriptive or general methods, enabling the knowledge of the nature of the risk occurring in the organization.
Because the management of the production process is operational and control of the production process requires the use of detailed figures on its progress, only measurable methods of the operational level can be taken into account in the risk assessment of the production systems. Figure 2 shows all groups of measurable methods, with detailed consideration of the operational level methods.
Fig. 2 Measurable methods of risk analysis and assessment (Burduk, 2013, p. 97)
The measurable methods proposed by the literature refer only to single issues, assuming appropriate conditions and factors, and also impose restrictions. After analyzing them, it can be concluded that in order to be able to assess the production risk in its real environment, it is necessary to simplify the issue so that it is possible
to apply this method. However, given the complexity of today's manufacturing companies, such an approach is not appropriate.
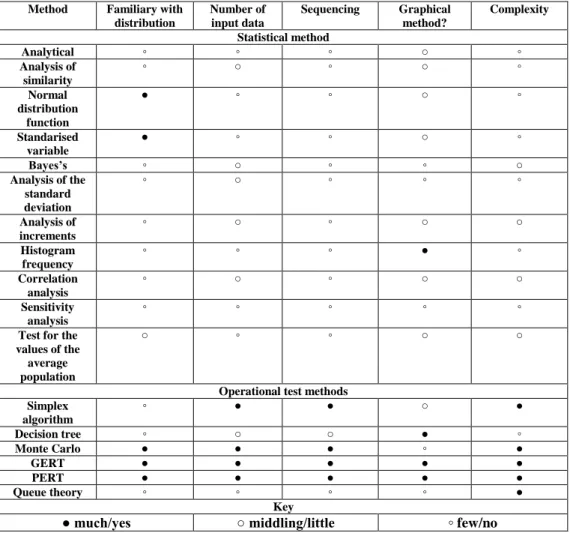
Table 1 Comparison of measurable methods of risk analysis and assessment according to
selected criteria (Burduk, 2013, p. 98) Method Familiary with
distribution Number of input data Sequencing Graphical method? Complexity Statistical method Analytical ◦ ◦ ◦ ○ ◦ Analysis of similarity ◦ ○ ◦ ○ ◦ Normal distribution function ● ◦ ◦ ○ ◦ Standarised variable ● ◦ ◦ ○ ◦ Bayes’s ◦ ○ ◦ ◦ ○ Analysis of the standard deviation ◦ ○ ◦ ◦ ◦ Analysis of increments ◦ ○ ◦ ○ ○ Histogram frequency ◦ ◦ ◦ ● ◦ Correlation analysis ◦ ○ ◦ ○ ○ Sensitivity analysis ◦ ◦ ◦ ◦ ◦
Test for the values of the
average population
○ ◦ ◦ ○ ○
Operational test methods Simplex algorithm ◦ ● ● ○ ● Decision tree ◦ ○ ○ ● ◦ Monte Carlo ● ● ● ◦ ● GERT ● ● ● ● ● PERT ● ● ● ● ● Queue theory ◦ ◦ ◦ ◦ ● Key
● much/yes ○ middling/little ◦ few/no
Table 1 shows a comparison of the quantitative methods of risk analysis and as-sessment that can be found most frequently in the literature. Comparative criteria have been selected to show their usefulness in solving practical problems (Burduk, 2013, p. 98).
2.3. Risk assessment of production processes using FMEA analysis
Analysis of causes and effects of FMEA defects is a method belonging to the group of quality control methods. Depending on the type, this method makes it possible to determine the area in the process where the greatest risk occurs – PFMEA or the most defective element in the product design – DFMEA. The knowledge and experience of employees is used here, thanks to which additional solutions are proposed to minimize the level of risk. The aim of the FMEA process is (Burduk, 2013, p. 99):
• identification of weak points and process variables on which control should be focused,
• application of measures to prevent the occurrence of weak spots in the processes,
• developing a list of potential threats, ranked according to their impact on the customer,
• improvement of unstable processes and ensuring its proper course.
In order to carry out an FMEA analysis, a special form should be developed in which data on the products or processes under analysis and potential defects, po-tential effects of defects, probability of occurrence (P), degree of risk (Z), detect-ability (Tr), number of risk priorities (RPN) and corrective actions will be entered. The next step in the analysis is to give numerical values to the degree of risk, de-tectability and probability in scale 1–10 (Burduk, 2013, p. 100).
The calculation of RPN provides an overview of the magnitude of the risk and serves as a reference point for further measures to be taken to minimize the risk. The RPN value is between 1 and 1000. In the case of a higher RPN value, the team must make efforts to reduce the risk through corrective actions. A high RPN value is therefore the equivalent of a high risk in the process. All possible defects should be ranked according to the increasing RPN value, and then the mistakes are recti-fied in this order. The last stage in the FMEA method is to carry out corrective actions in the area of the occurrence of the largest RNP.
Following the implementation of corrective measures, it is recommended to carry out an audit analysis of the FMEA. This analysis is carried out in order to check whether the effects of the corrective measures and the objectives set are in line with the actual area.
Thanks to the FMEA method it is possible to identify risk factors, assess their impact on the production system and determine the area with the highest level of risk. Due to its ease of use, it is becoming more and more common in teams of employees, serving to improve the quality of products and processes. Unfortu-nately, the amount of risk expressed by RPN is determined on the basis of indica-tors, the values of which are estimated intuitively based on the knowledge and ex-perience of people participating in the method. There is no guarantee that selecting other employees to analyze and assess the risk of the process will not produce completely different results. However, it provides a basis for further risk analysis.
2.4. Method for determining the size of risk for serially structured
sys-tems
The term reliability has many interpretations. However, the most common definition of reliability of objects in literature is "the ability of an object to remain in a state that allows it to fulfil the required functions under the given conditions and in the given time interval, assuming that the required external means are provided" (Burduk, 2013, p. 103).
The reliability theory itself considers states 0/1. Such an approach refers to technical objects, but it is not suitable for describing biotechnical objects or exploitation systems, and thus production systems.
The specificity of today's production systems, and in particular their complexity, allows them to be treated as operating systems and then reliability is one of the features measured by the degree of achievement of the set indicators, parameters and characteristics. On the other hand, production systems must operate in an environment that continuously affects and disrupts the system.
The reliability of production systems can be determined in a very flexible way, assuming, depending on the needs of analysis, that the size of any indicator, which the process according to the "user" should be characterized as "acting in accordance with the intentions of the user", is "consistent with the intentions of the user". The most frequently analysed indicators of the production process include the production time of a certain number of elements, efficiency and productivity.
Reliability issues refer to problems related to the functioning of technical facilities. This term very rarely refers to economic or economic systems. Since, according to system theory, a system may refer to both technical facilities and economic or economic facilities, it is justified to transfer the general theory of reliability to the management of production systems and to apply it in planning and risk assessment. In production systems, a certain technology does not allow to treat risk according to the American approach, but only as a possibility of occurrence of effects (profits) smaller than expected (German approach).
The transfer of the general theory of reliability to production systems can be achieved by treating Z unreliability as a synonym for R-risk:
R = Z
The risk (unreliability) of the system (e.g. production) interpreted in this way will be the probability that the system will not perform the functions for which it was designed or will mean the probability of losses occurring in it. There should be a true equation for such an interpretation:
This equation means that the probability that a system is in a reliable or unreliable state is 1. Therefore, it is also true:
R + Z = 1
hence:
R =1 – N
Risk analysis and assessment therefore makes it possible to determine the reliability of the system's operation and vice versa. A reliable approach to planning and risk assessment offers more possibilities and makes it easier to locate risk factors in the production system.
The unreliability (risk) or reliability of the system is also affected by its structure. When analysing a system, the most important thing is to define the relations between its elements. These relations will define the functioning and structure of the system and may be material, energetic, informational or temporary in nature. Feedbacks can be single or multi-parameter. Different relationships between elements can create different structures. The type of structure is primarily determined by the type of structure (Łuczak, 2009):
• number of elements,
• number of connections between elements, • the degree of differentiation of elements,
•
types of connections.Depending on the feedback between objects in the systems, including produ-ction systems, different types of structures can be distinguished. The type of coupling of individual objects in the system translates into its functioning, control and regulation. The analysis of the reliability structure of the system should be preceded by a division of the system into individual components – a decomposition of the system, reflecting the logical relations in the system, so that its individual parts are statistically independent and as large as possible. Depending on the type of coupling between objects in the system, the most common reliability structures are the structures (Burduk, 2013, p. 105):
• serial, • parallel, • series-parallel.
The system has a serial structure if all objects/subsystems have to be booted for its operation. This means that the system functions correctly if all its components also function correctly, and if any object/subsystem fails the whole system. In a serial structure, the coupling of two objects/ subsystems consists of converting the output vector of one object/subsystem into the input vector of another object/subsystem, but
it is not necessary for all components of the output vector of one system to become components of the input vector of another system.
Serial structure is the most common type of structure in production systems and processes. For example, failure of one machine in the manufacturing process causes malfunctioning or lack of the entire production system.
With this type of systems, the reliability of the system is the product of its objects, so with the increase in the number of objects in the system, its reliability decreases. System reliability Ns with a serial structure will be determined by the
equation:
NS = N1 • N2 • N3 • … • Nn
where N1, N2, N3, Nn – reliability of individual objects/subsystems of the system.
The total risk (Rc) of this system is:
where R1, R2, R3, Rn – risk in the individual facility/subsystems of the system.
For individual risk areas, the risk magnitude Ri shall be calculated as follows:
where
Si – means loss in the i-th area due to the existence of risk factors ri,
Wteoret – means the analyzed indicator (e.g. productivity, productivity, etc.)
theoretically achievable by the production system.
Losses of Si in particular areas depend on time losses caused by the extension of
the duration of the production process due to the risk factors present in them. In other words, the production system will achieve its objective, but will need more time to achieve it. Then the losses on the measurable objective of the production system, caused by the risk factors of the areas, will be as follows:
where:
– is time losses in individual areas due to risk factors,
T – is the unit of time or period for which the production system's target achievement is a representative period.
The total Rc risk for a system with n areas and a serial structure is therefore:
2.5. Method for determining the size of risk for parallel structured
sys-tems
According to classical theory, reliability is characterised by the fact that a sys-tem is in a fit condition if at least one of its objects is in it, which means that the correct functioning of one of its elements is sufficient for the proper functioning of the system. The reliability of such a system increases after increasing the number of parallel coupled objects.
The reliability of the Ns system, as shown in figure 6, will be determined by the
equation:
where N1, N2, N3, Nn are reliability of individual objects/subsystems of the system.
The total Rc risk of the system can be determined:
where R1, R2, R3, Rn are risk in the individual facility/subsystems of the system.
In production practice there are parallel structures, but the nature of the production process does not facilitate such an interpretation of the reliability structure. The classical theory of reliability considers states of 0/1 of technical equipment. This means that in the interpretation of the classical theory of reliability, a production system would be considered reliable if even one element would function properly. In production systems, such a situation occurs only in the
so-called reserve systems, i.e. with an excess of elements functioning in the system. In fact, systems with reserves are very rare, because the excess of elements (e.g. machines, employees, means of transport, etc.) means unused resources, which results in increased costs (Burduk, 2013, p. 108)
It is much more appropriate to develop a method for determining the risk for parallel production structures.
Treating the system structure in figures 7 and 8 as a parallel production structure, the risk formula for this system should be as follows:
where R1, R2, R3, Rn are risk in the individual facility/subsystems of the system.
Assuming the same markings as before, the individual risks Ri for n areas,
depending on the magnitude of losses Si incurred in these areas, are as follows:
In case the areas are different, it is necessary to determine the theoretical value of the analyzed indicator (Wteoret) for each of the areas with this type of structure.
Determining Wteoret values for each of the identified n areas, individual losses Si,
depending on the time losses caused by the occurrence of risk factors in particular areas, amount to (Burduk, 2013, p. 109):
where:
- means the theoretical value of the indicator in individual areas of the system,
- means the loss of time in individual areas caused by risk factors.
The total risk Rc for a system with n areas and a parallel production structure is:
In the case when the highlighted areas of the system are the same and have the
same value , that is:
Then the total risk formula of such a system will take the form:
3. CHARACTERISTICS OF THE SELECTED PRODUCTION
PROCESS
Selected furniture factory is a manufacturer of furniture and interior furnishings. The company specializes in the production of durable and ergonomic hotel, recep-tion, hospital and office furniture. Production process of that company is very simi-lar to the manufacturing processes of other manufacturing companies. As in any factory, it consist of: development of production technology, followed by manufac-turing, quality control of the finished products, transport to the customer and main-tenance of the machines.
The whole realization of the order begins with the development of the process technology. When the customer places an order, provides a technical drawing of the finished product, which he wants to obtain, or comes to the office of the com-pany and, together with the technologist, on the basis of the catalogue offered to him, in which there are several variants of furniture, discusses his individual needs, and then the technologist makes any possible corrections to the documentation held in the catalogue of products. Once the company has technical drawings of the fin-ished product, which will be produced, the development of a detailed technology begins. This is connected, for example, with the selection of an appropriate saw for cutting boards, but also with the selection of temperature, pressure and time of veneering of wood panels in the press.
Once the process technology has been developed, the manufacturing process begins, which begins with a cutting by saw. At an earlier stage, a choice was made as to whether it was a format saw or a panel saw. The format saw is equipped with an undercut, which means that the phenomenon of shredding of edges is eliminated when sawing wood. This saw is used to make cuts that require high precision. Small production batches are processed on it. To operate it, two workers are needed, one of them is responsible for fixing and supporting the board, the other one cuts it with a saw. The panel saw, on the other hand, offers high productivity and is suitable for medium-large production batches. The panel is placed by an employee on a table, after which the saw absorbed it and then cuts according to the dimensions programmed by the employee, i.e. a technical drawing which contains the dimensions of the panel to be cut and the cutting lines to be made.
The next stage of the process is veneering the panels with veneer using a press. The press is heated (to a temperature depending on the type of glue used), the ap-propriate pressure gauge is set (up to 40 MPa, depending on the thickness of the board) and the pressing time. Then, using a gun, the glue is applied to the panels and veneer (with a preset viscosity and density), and then it is placed in the press. During this operation, special care must be taken to ensure that the direction of the fibres of the adjacent layers is different. If the veneer is not positioned correctly, visible scratches will appear. When the panels and veneer are placed in the press, the lower table presses the panel and veneer against the upper, stationary table be-cause of the appropriate pressure generated by the hydraulic unit in the middle of the press frame, which causes the veneer to stick together. The glued plates are removed and placed vertically on the stand, to cool down and dry out to prevent warping. The aim is to make the surface of the wood visually more attractive, but also to increase the stability of its shape and dimensions.
After veneering, the plates are placed on the CNC machine. By means of a pro-gram, a technical drawing of the plate, which we want to obtain after processing, is entered into the machine. In the machine the milling cutters are also replaced with those selected earlier by the technologist. The plate is placed on the base on the machine table, and then it is absorbed by powerful pumps. The required formats, profiles on their surfaces and edges are milled. Holes are also drilled.
From the CNC machine the plates are transported to the grinder in order to re-move all kinds of defects that occur during processing. The thickness of the plate is set on the grinder and then it is measured with a sensor. Technical data are also entered. The next step is to place the plate in the machine and its grinding takes place. The accuracy of this machining is 0.05 mm.
The plate is then sent to a quality control station. By means of callipers, mi-crometers, crevice meters or gauges, all external and internal dimensions of prod-ucts are checked here, roughness is measured with a profile meter. Visual inspec-tion is also carried out. Particular atteninspec-tion is paid to the most frequent errors oc-curring during production – their possible occurrence must be excluded in the products being inspected. The plates are also thoroughly cleaned so that they are
perfectly smooth and free of impurities. If a defect is noticed, the board is further processed (usually manual) to remove it. If the defect cannot be eliminated, the wood is used as fuel.
The next stage of the production process is varnishing the material in the paint shop. It is made by hand. It begins with painting hard to reach places and then var-nishing one side of a given panel. The product is placed on racks until it dries and then the action is repeated on each side. Two layers of lacquer are applied to the panels in order to achieve a good decorative and protective effect. After the works are finished, the painting tools are washed.
After drying, the plates are put in the finishing stand, where they are polished with a rotary polisher to give them a very high gloss, but also to correct your var-nish, such as small scratches. From there, they are transported to the quality control station, where each product is checked again visually for any scratches and other defects, and if they occur, they are removed manually. Then, the product is trans-ported to the assembly station, where it is completed and assembled. Assembly is usually carried out manually, using tools. After assembling the finished product, it is transported to the packaging stand, where it is packed and protected with film, corrugated paper and cardboard against damage that may occur during transport. The resulting finished product in the form of parcels is transported by means of a forklift truck to the finished product warehouse, from where it is transported to the customer as soon as possible (maximum 3–4 days).
The last, necessary stage of the whole process is the maintenance of the ma-chines. The machines are maintained every Friday after the second shift at 10 p.m. The oil is changed and the machines are checked for possible damage. Every two months, used filters, bearings, etc. are replaced in the machines, which allows for continuous operation of machines capable of use, and the risk of their failure is reduced. Workstations are cleaned and tidied up by employees after each shift (the plant operates in two shifts: 6–14 and 14–22).
4. PROBLEMS DETECTED IN THE PRODUCTION PROCESS
The observation of the production process lasted 2 months. During this period failures at production stands and their duration were recorded, the duration of proc-essing at these stands as well as the time of transport of products between them were also measured. The layout of the production hall was prepared and the dis-tances between individual workstations were measured. There were also noted defects that occur during processing on individual machines. All the activities made it possible to select a few main problems that company has to deal with dur-ing the production process. All these problems have a huge impact on increasdur-ing the production risk.
The first problem is the defects in wood that occur during the production proc-ess. A CNC machine causes most of these defects. Defects also occur on saw. These are usually deep scratches or cracks, as well as cavities. Within 2 months, during the analysis as many as 322 defects were recorded on the machines, during the manufacturing process. As many as 257 of them were caused by a CNC ma-chine, 52 defects were created on a saw.
The next problem noticeable during the production process is human error. These errors include failure to detect a defect at a quality control or finishing sta-tion by an employee, incorrect input of processing data into a CNC machine, the use of bad paint during furniture painting, the use of a bad component during as-sembly on an asas-sembly stand, as well as a bad way of protecting the finished prod-uct during packaging.
The third problem is no transportation to transfer semiproducts to the next workstation. This problem mainly concerns transport from the quality control sta-tion and packing stand, because the quantity of transport is accurately counted and does not foresee the detection of a defect by the employee, which means a longer duration of quality control or corrections. This problem also occurs on the grinder, because the products in which the defect was detected during the process needs processing on a grinder, so their transport was not foreseen either. When this prob-lem occurs, the employee has to wait for a free means of transport.
The next problem is the failure of machines, which concern saw, hydraulic shelf press and grinder. This is probably due to the age and wear of these machines. In the course of 2 months of analysis, 276 machine failures were recorded. These failures did not last long and were quickly remedied by machine operators, but they certainly increase the production risk. 45 breakdowns occurred on the grinder, 92 breakdowns occurred on the saw and 138 breakdowns were recorded on the hydraulic shelf press.
The last problem detected during the observation of the production process con-cerns the lack of a component for the assembly of the finished product and was noticed at the assembly station. This situation took place many times and was re-lated to mistakenly bad preparation of metal elements used for assembly. The em-ployee had to go to the metal parts warehouse to get an appropriate component.
5. RISK AND LOOSES ASSESSMENT
In order to calculate risk indicators for individual production sites, the reports generated at the end of each day during the two-month process observation were analysed. The number of downtimes was determined and how long they lasted. In addition, it was noted what the failures causing downtime were about. The system's production capacity, total order processing time, use of machines, queues were also defined. Each of these factors has been taken into account in further calculations.
Due to the fact that the company produces furniture according to the customer's wishes, the results obtained should be treated as an indication.
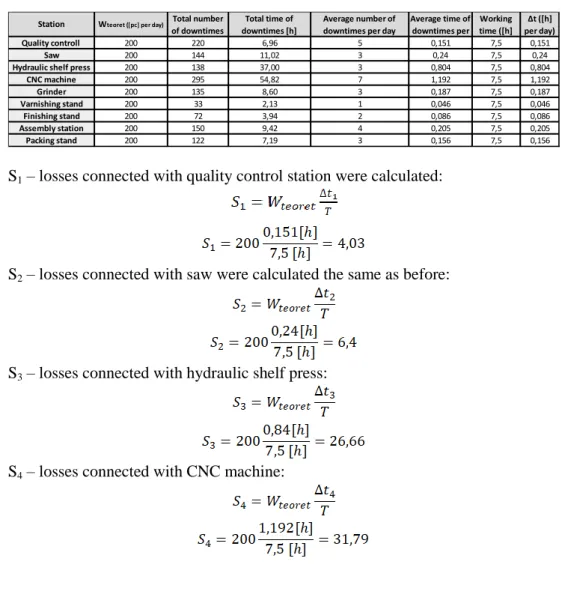
On the basis of the data obtained, the average production capacity was calcu-lated. This value was taken as Wteoret. Then the sum of working time (T) and separately the sum of downtime (∆t) was calculated. In the final stage, all values were substituted to the formula and converted to a value expressed as a percentage. The table 2 shows the data used for the calculation of risk for the individual ma-chines. It is worth recalling that the risk considered is that production will not be performed on time.
Table 2 Data used for calculation of risk for the individual machines
Quality controll 200 220 6,96 5 0,151 7,5 0,151
Saw 200 144 11,02 3 0,24 7,5 0,24
Hydraulic shelf press 200 138 37,00 3 0,804 7,5 0,804
CNC machine 200 295 54,82 7 1,192 7,5 1,192 Grinder 200 135 8,60 3 0,187 7,5 0,187 Varnishing stand 200 33 2,13 1 0,046 7,5 0,046 Finishing stand 200 72 3,94 2 0,086 7,5 0,086 Assembly station 200 150 9,42 4 0,205 7,5 0,205 Packing stand 200 122 7,19 3 0,156 7,5 0,156 Working time ([h] ∆t ([h] per day) Total number of downtimes
Station Wteoret ([pc] per day) Total time of
downtimes [h]
Average number of downtimes per day
Average time of downtimes per
S1 – losses connected with quality control station were calculated:
S2 – losses connected with saw were calculated the same as before:
S3 – losses connected with hydraulic shelf press:
S5 – losses connected with grinder:
S6 – losses connected with varnishing stand:
S7 – losses connected with finishing stand:
S8 – losses connected with assembly station:
S9 – losses connected with packing stand:
Formula was used to calculate the total risk Rc for a system with a serial
structure and with 11 areas.
As the product is sent to the quality control station three times during processing, this is taken into account in the following calculations as if it were 3 separate stations. Therefore, from 9 workstations used in the course of processing, it was found that the risk is calculated for a system with 11 areas.
The risk of around 0.44 seems to be a decent result, especially in terms of a small enterprise producing to order. Of course, the result, although satisfactory, may encourage changes and aim to reduce the overall risk.
6. CONCLUSION
The industry is constantly developing, factories are growing, new ones are also being created. Currently, the competition on the market is huge. Companies must strive to reduce the risk related to their production processes in order not to lose customers due to failure to deliver orders on time, but also to acquire new ones.
On the basis of the described company, it is clearly visible how many factors in-fluence the entire production process. In the thesis 2-month-long analysis of the production system was carried out, queues at individual machines during produc-tion, total time of execution of orders, use of machines, average production capac-ity have been determinded, as well as the factors that affect the delay in production were identified. A layout of the production hall was also made. All defects in wood on the machines within 2 months were noted too. All this activities made it possi-ble to assess the risk.
The result obtained after the calculation is satisfactory, but it is possible to im-prove it. The human error problem can be minimized by using the Poka-Yoke method. The number of human errors recorded at all positions within 2 months was as high as 380. Most of these errors could be rectified in a very short period of time, but using Poka-Yoke can primarily contribute to reducing the financial losses that caused these errors, as well as to reducing the production risk. The problem of bad components can be solved in the same way.
The problem of no transportation to transport can be easily solved by purchas-ing 1 additional forklift, which would be used to transport the finished product
from the packing station to the warehouse, and 2 pallet trucks, which would be used for transport between the quality control station and the next station and be-tween grinder and varnishing stand. The cost of this type of transport is not high and will allow the company to carry out the production orders on time.
Defects occurring during the process in wood, as well as machine failures are caused by wear and tear of these machines. In order to reduce the production risks associated with this, it is possible to inspect and maintain machines more often, replace their subsystems with new ones, or eventually consider replacing defective machines and machines that often fail with new ones.
REFERENCES
Bizon-Górecka J., (2001), Inżynieria niezawodności i ryzyka w zarządzaniu przedsiębior-stwem, Oficyna Wydawnicza Ośrodka Postępu Organizacyjnego, Bydgoszcz. Burduk A. & Chlebus E., (2009), Evaluation of the Risk in Production Systems with a
Pa-rallel Reliability Structure, Eksploatacja i Niezawodność – Maintenance and Reliabi-lity, No.2.
Burduk A. & Chlebus E., (2009), Methods of Risk Evaluation in Manufacturing Systems, Archives of Civil and Mechanical Engineering, Vol. 9, No. 3.
Burduk A., (2010), An Attempt to Adapt Serial Reliability Structures for the Needs of Analyses and Assessment of the Risk in Production Systems, Eksploatacja i Niezawodność – Maintenance and Reliability, No.3.
Burduk A., (2011), Methods of Production Risk Assessment, Wydawnictwo PRINTPAP, Łódź.
Karmańska A., (2008), Ryzyko w rachunkowości, Difin, Warszawa.
Kulińska E., (2012), Selected tools for risk analysis in logistics process. Arch. Transp. XXIV(1), pp. 27–41.
Łuczak J., (2009), Risk assessment methods – ISO/IEC 27001 information security management system’s key element. Sci. J. Marit. Univ. Szczecin 19(91), 65.
Pacaiova H., Sinay J. & Nagyova A., (2017), Development of GRAM – a risk measurement tool using risk based thinking principles. Measurement 100, pp. 288–289.