STUDIES IN PHYSICAL CULTURE AND TOURISM Vol. 16, No. 4, 2009
PETER O’DONOGHUE
University of Wales Institute Cardiff, Wales
RELATIVE AGE IN ELITE TENNIS
Key words: longitudinal research, age profiles, gender.
ABSTRACT
There is a skewed birth month distribution of Grand Slam tennis players with more players than expected being born in the first half of the year. The current investigation found that (a) female players in Grand Slam tournaments were younger than male players, (b) the birth month distribution of Grand Slam players was not as skewed in 2009 as it was in 2002-03, (c) the skewed birth month distribution increased as female players became seniors but decreased as male players became seniors, (d) male players born in the second half of the year played Grand Slam tennis to an older age than male players born in the first half of the year, and (e) female players born in the second half of the year increased the number of Grand Slam tournaments they played between 2006 and 2009 more than female players born in the first half of the year.
INTRODUCTION
In junior sport, participants are grouped into cohorts separated by cut-off dates; for example, the International Tennis Federation (ITF) uses a cut-off date of 1st January for the ITF junior tour. Players born in the first six months of the year have a relative age advantage over those born in the second six months. This leads to attrition of late born players who may be perceived by themselves and others as having less talent than they actually have. This in turn leads to a skewed birth month distribution of senior players with more senior players having been born in the first half of the year than the second half of the year. Such skewed birth month patterns have been found in ice hockey [3], professional soccer [12], major league baseball [13], Grand Slam singles tennis [2, 4, 6] and netball [8] with more participants being born in the first six months of the junior competition year than in the second six months.
If one assumes that some senior players who had been born in the first half of the junior competition year are not as talented as they were perceived to be when they were younger then these players may decline within senior world rankings and end their careers early. If one also assumes that some senior players who had been born in the second half of the junior competition year are more talented than they were perceived to be when they were younger then these players may rise within senior world rankings and prolong their careers. The fortunes of players who were born in different parts of the junior competition year have not been followed through their senior careers and so the author has commenced a 25 year study of players born after 1984. This study commenced in 2002 when the players were still junior players and changes in the ITF junior tour rankings were compared between players born in the first and second halves of the year between 2003 and 2005 [10]. The current paper reports on the next four
Correspondence should be addressed to: Peter O’Donoghue, Cardiff School of Sport, University of Wales Institute Cardiff, Cyncoed Campus, Cardiff, Wales, CF23 6XD, UK, fax: +44 29 20416768, e-mail: podonoghue@uwic.ac.uk
years of the players’ developments between 2006 and 2009 and also examines other trends in birth date distribution of tennis players. This paper reports on a series of five studies of tennis players’ birth months and associations with participation and success in high level tennis. The paper also reports on a sixth study that investigates the experiences of players in other sports to demonstrate how qualitative research can be used to investigate the lived experiences of player born in different parts of the year.
Study 1: Birth month distribution of ITF junior tour players
This study used players who achieved any ranking points on the ITF junior tour in 2008 and for comparison also used players who achieved any ranking points on the ITF junior tour in 2003. There ages of junior tour players span six years; events of the 2009 ITF junior tour can be entered by players born between 1st January 1991 and 31st December 1996. The data were gathered from the official website of the ITF junior tour
Table 1. Number of ITF junior players born at different times who earned ranking points in 2008
Year of Birth Q1 Q2 Q3 Q4 Total χ23 p
End of 2003 Female 1985 57 (26.3%) 64 (29.5%) 45 (20.7%) 51 (23.5%) 217 4.0 0.262 1986 93 (27.1%) 91 (26.5%) 87 (25.4%) 72 (21.0%) 343 3.6 0.312 1987 114 (28.7%) 110 (27.7%) 102 (25.7%) 71 (17.9%) 397 12.3 0.007 1988 105 (33.5%) 84 (26.8%) 79 (25.2%) 45 (14.4%) 313 24.9 <0.001 1989 70 (39.8%) 38 (21.6%) 40 (22.7%) 28 (15.9%) 176 23.4 <0.001 1990 22 (37.3%) 16 (27.1%) 12 (20.3%) 9 (15.3%) 59 6.8 0.080 All 461 (30.6%) 403 (26.8%) 365 (24.3%) 276 (18.3%) 1505 52.0 <0.001 Male 1985 144 (32.8%) 115 (26.2%) 94 (21.4%) 86 (19.6%) 439 19.9 <0.001 1986 166 (33.3%) 123 (24.6%) 119 (23.8%) 91 (18.2%) 499 24.7 <0.001 1987 123 (31.6%) 121 (31.1%) 84 (21.6%) 61 (15.7%) 389 29.5 <0.001 1988 72 (37.9%) 50 (26.3%) 40 (21.1%) 28 (14.7%) 190 23.0 <0.001 1989 26 (44.1%) 17 (28.8%) 11 (18.6%) 5 (8.5%) 59 16.9 <0.001 1990 3 (25.0%) 3 (25.0%) 5 (41.7%) 1 (8.3%) 12 2.6 0.449 All 534 (33.6%) 429 (27.0%) 353 (22.2%) 272 (17.1%) 1588 100.4 <0.001 End of 2008 Female 1990 48 (22.4%) 54 (25.2%) 58 (27.1%) 54 (25.2%) 214 0.7 0.857 1991 113 (25.1%) 117 (26.0%) 106 (23.6%) 114 (25.3%) 450 0.7 0.868 1992 148 (29.2%) 137 (27.1%) 118 (23.3%) 103 (20.4%) 506 10.6 0.014 1993 109 (30.5%) 94 (26.3%) 97 (27.2%) 57 (16.0%) 357 17.8 <0.001 1994 78 (40.0%) 39 (20.0%) 50 (25.6%) 28 (14.4%) 195 29.4 <0.001 1995 34 (54.8%) 22 (35.5%) 5 (8.1%) 1 (1.6%) 62 46.5 <0.001 All 530 (29.7%) 463 (26.0%) 434 (24.3%) 357 (20.0%) 1784 38.3 <0.001 Male 1990 119 (26.7%) 113 (25.4%) 112 (25.2%) 101 (22.7%) 445 1.9 0.597 1991 198 (32.6%) 169 (27.8%) 147 (24.2%) 94 (15.5%) 608 40.3 <0.001 1992 167 (36.6%) 124 (27.2%) 95 (20.8%) 70 (15.4%) 456 48.1 <0.001 1993 89 (43.4%) 55 (26.8%) 36 (17.6%) 25 (12.2%) 205 47.8 <0.001 1994 19 (35.2%) 19 (35.2%) 11 (20.4%) 5 (9.3%) 54 10.6 0.014 1995 5 (62.5%) 3 (37.5%) 0 (0.0%) 0 (0.0%) 8 9.2 0.027 All 597 (33.6%) 483 (27.2%) 401 (22.6%) 295 (16.6%) 1776 117.4 <0.001 380
(www.itftennis.com/juniors accessed 31st Decem-ber 2003 and 31st December 2008). The birth dates of players were used to group players by year and quarter year of birth; Q1 was January to March, Q2 was April to June, Q3 was July to September and Q4 October to December. A series of chi square goodness of fit tests were used to compare the observed distributions of players with an expected distribution of players based on an assumption that equal numbers of people are born each day of the calendar year. Table 1 summarises the data revealing different changes in birth month patterns for female and male players between 2003 and 2008. The distribution of birth quarters for the oldest four years of female players has become less skewed between 2003 and 2008. The distribution of birth quarters for oldest year of male players has also become less skewed between 2003 and 2008, but the next 3 years of players has become more skewed over the same period.
Study 2: Birth month distribution of elite players
This investigation used the same definitions for elite junior and senior players as a study of tennis done in 2002-03 [6]. An elite junior player is
a player who has achieved at least 120 ranking points for singles in the ITF junior tour at the end of the year. An elite senior player is a player who has participated in a singles event at a Grand Slam tennis tournament. The current investigation used junior player data from the same sources as Study 1 and used senior player data from the official websites of the four Grand Slam tournaments in 2009 (www.ausopen.org, www.frenchopen.org, www.wimbledon.org and www.usopen.org all accessed on 2nd September 2009). Table 2 shows the results of the 2002-03 study [6] together with the results for current investigation. The 2002-03 study [6] found that the percentage of female players born in the first half of the year increased from 55.5% for juniors to 60.6% for seniors while for males it decreased from 63.2% for juniors to 57.4% for seniors. The current investigation found similar results with the percentage of female players born in the first half of the year increasing from a non-significant 53.1% for juniors to a significant 58.5% for seniors. The percentage of males born in the first half of the year decreased from a significant 61.8% for juniors to a non-significant 51.8% for seniors. There has been
Table 2. Season of birth of elite junior and senior players in 2002/2003 (Edgar and O’Donoghue, 2005) and 2008-09 Season of Birth Gender Q1 Q2 Q3 Q4 Total χ 2 3 p 2002-03 Junior Female 74 (30.9%) 59 (24.6%) 66 (27.6%) 40 (16.7%) 239 11.1 0.011 Male 79 (33.3%) 71 (29.9%) 51 (21.5%) 36 (15.1%) 237 20.2 <0.001 Total 153 (32.1%) 130 (27.3%) 117 (24.6%) 76 (16.0%) 476 27.9 <0.001 Senior Female 70 (33.1%) 58 (27.5%) 47 (22.3%) 36 (17.1%) 211 12.9 0.004 Male 68 (28.7%) 68 (28.7%) 60 (25.3%) 41 (17.3%) 237 8.7 0.033 Total 138 (30.8%) 126 (28.1%) 107 (23.9%) 77 (17.2%) 448 20.3 <0.001 2008-09 Junior Female 98 (28.9%) 78 (24.2%) 80 (24.8%) 71 (22.0%) 322 3.6 0.307 Male 118 (37.0%) 79 (24.8%) 69 (21.6%) 53 (16.6%) 319 30.4 <0.001 Total 211 (32.9%) 157 (24.5%) 149 (23.2%) 124 (19.3%) 641 27.2 <0.001 Senior Female 53 (29.0%) 54 (29.5%) 47 (25.7%) 29 (15.8%) 183 9.2 0.026 Male 46 (23.8%) 54 (28.0%) 51 (26.4%) 42 (21.8%) 193 1.8 0.614 Total 99 (26.3%) 108 (28.7%) 98 (26.1%) 71 (18.9%) 376 8.6 0.035 381
speculation that this could be due to relative age having predominantly psychological effects for female players and physical effects for male players [6]. Negative experiences and perceptions of limited talent for late female born players are possible attrition motives that would result in late born female players withdrawing from elite tennis before reaching senior age groups. The physical advantages enjoyed by early born male players would only be experienced during junior age groups. Once male players are fully matured senior players, the physical advantages associated with relative age will be lost and some early born male players will fall in the World rankings.
Study 3: Changes in junior players rankings over a 3 year period
The first three years of a 25 year longitudinal study of tennis players born in the first and second halves of the year have been reported [10]. Data from the ITF junior rankings were gathered at the end of 2003, 2004 and 2005. Players born in 1985 and 1986 were not eligible to compete in ITF junior tour events in 2005, while very few 1989 and 1990 born players competed in ITF tour events in 2003. Therefore, previous research concentrated on players born in 1987 and 1988 [10]. The analysis of world rankings over the three years only used players who were ranked in all three years. This reduced the number of 1987-88 born females from 1,361 to 290 and the number of 1987-88 born males from 1,710 to 325. This can be criticised because the non-parametric techniques used would have allowed unranked players to be given an equal ranking below that of any ranked player. Therefore,
the current investigation analyses changes in the ITF junior rankings of 1987-88 born players from 2003 to 2008 including data for players who were ranked in any of the three years. This meant that all 1,361 female players and all 1,710 male players could be included in the analysis. Bonferroni adjusted Wilcoxon signed ranks tests were used to compare players’ rankings between pairs of years using p values of under 0.017 to indicate significant changes in rankings.
Table 3 shows the end of year ITF junior rankings for the median, upper and lower quartile players. The female players, whether born in the first or second half of the year, rose in the rankings from 2003 to 2004 but declined in the rankings from 2004 to 2005. This might be explained by many 18 year old females choosing to compete in senior professional tournaments when they were still eligible to compete in the junior tour. The trend in male players born in the first half of the year differed from that of male players born in the second half of the year. Those born in the first half of the year rose in the rankings from 2003 to 2004 but then declined slightly between 2004 and 2005. However, the male players born in the second half of the year made a significant improvement in their world ranking between 2004 and 2005 gaining 230 places on average. This might be explained by reducing physical advantages being enjoyed by players born in the first half of the junior competition year as they get older. An alternative explanation is that more players born in the first half of the year will move into senior competition before the age of 18 than those born in the second half of the year.
Table 3. ITF junior rankings for 1987-88 born players who achieved ranking points in any year from 2003 to 2005 Born in first half of year Born in second half of year
2003 2004 2005 2003 2004 2005
Female
L. Quartile 623 546.5 882 765 586 889
Median 1326 1196 ^ 1977 ^$ Unranked 1347 ^ 1816 $ U. Quartile Unranked Unranked Unranked Unranked Unranked Unranked Male
L. Quartile 1079 603 595 1343 755 607
Median Unranked 1343 ^ 1355 ^ Unranked 1525 ^ 1295 ^$ U. Quartile Unranked Unranked Unranked Unranked Unranked 2096 ^ Wilcoxon test revealed significantly different to 2003 (p < 0.017)
$ Wilcoxon test revealed significantly different to 2004 (p < 0.017) 382
Study 4: Age profile of Grand Slam singles players
The results of the previous studies were considered and hypotheses for further studies were generated through a process of inductive reasoning. If players born in different halves of the year experience different fortunes in their senior careers, this could cause players to qualify for senior Grand Slam single tournaments at different times in their careers. A further possibility arises from players born in the first half of the year being perceived as having greater talent than they actually have and players born in the second half of the year being perceived to have less talent than they actually have. Once these players become senior players, genuinely talented players who were born in the second half of the year may rise in the senior rankings while some players born in the first half of the year may decline in the senior rankings as a result of having less talent. This could encourage players born in the second half of the year to prolong their careers to a greater extent than those born in the first half of the year. Therefore, the purpose of this fourth study was to compare the age profile of players participating in Grand Slam tournaments in 2009.
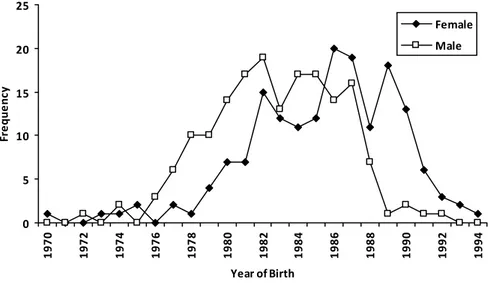
Figure 1 shows the year of birth of any female and male players who participated in at least one Grand Slam singles event in 2009. The median
year of birth for the female players was 1986 which a Mann Whitney U test revealed was significantly later than 1983 when the median male player was born. Despite this, the oldest player who participated in any singles event was a female player who was born in 1970.
The median female player’s year of birth was 1986 for both those players born in the first and the second halves of the year with a Mann Whitney U test revealing no significant difference between these two sets of female players (p = 0.887). However, the male players born in the first half of the year had a median year of birth of 1984 which was significantly younger than the 1982 for male players born in the second half of the year (p = 0.041). This cannot be explained purely by male players born in the first half of the year qualifying for Grand Slam tennis tournaments at younger ages than those born in the second half of the year. There were 64 out of 124 male players born in 1985 or later who had been born in the second half of the year (51.6%) compared with only 29 out of 69 of the players born before 1985 (42.0%). This suggests that male players born in the second half of the year participate in Grand Slam singles events until an older age than male players born in the first half of the year. Indeed, 23 of the oldest 36 male players (born before 1980) were born in the second half of the year.
0 5 10 15 20 25 1970 1972 1974 1976 1978 1980 1982 1984 1986 1988 1990 1992 1994 Year of Birth Fr e que nc y Female Male
Figure 1. Year of birth of Grand Slam singles players in 2009
Study 5: Success of players born in different halves of the year
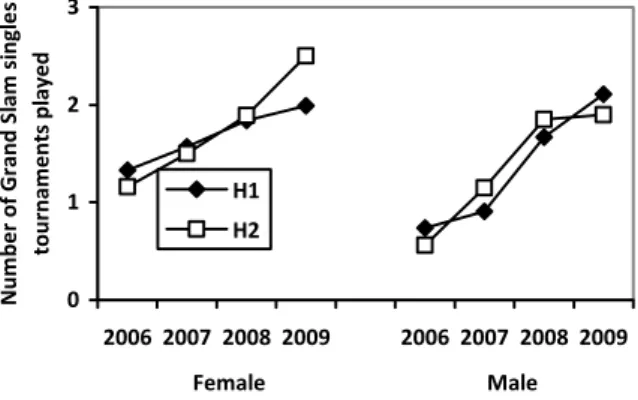
The first 3 years of the author’s 25 year study of tennis players’ careers reported on the junior careers of 1987-88 born players between 2003 and 2005. These players have since moved into senior age groups and their progress as seniors during the next four years of the 25 year study is analysed in the current study. A broad indicator of success used in the current study was the number of Grand Slam singles tournaments played in a year by a player. The number of 1987-88 born players participating in Grand Slam singles tournaments peaked at 41 at Wimbledon in 2009. This was considered to be a low number of players and, therefore, all players born on or after the 1st January 1985 are now being included in the 25 year longitudinal study. There were 142 female players born on the 1st January 1985 or after who have competed in at least one Grand Slam singles tournament between 2006 and 2009; 86 of these players were born in the first half of the year and the remaining 56 were born in the second half. There were 85 male players born on the 1st January 1985 or after who have competed in least one Grand Slam singles tournament between 2006 and 2009; 46 of these players were born in the first half of the year and the remaining 39 were born in the second half. Figure 2 shows the number of Grand Slam singles tournaments played per year by different players. The number of Grand Slam singles tournaments played by females born in the second half of the year increased more between 2006 and 2009 than it did for females born in the
first half of the year. A Mann Whitney U test revealed that in 2009 the number of Grand Slam singles tournaments played by female players born in the second half of the year was significantly greater than that for female players born in the first half of the year (p = 0.042). However, it should be noted that there were only 56 of the 142 female players analysed who were born in the second half of the year. The number of Grand Slam singles tournaments played by male players increased from 2006 and 2009 with no significant difference between the number of tournaments played by players born in the first and second halves of the year (p > 0.05).
Study 6: Experience of games players born in different halves of the junior competition year
This study is comprised of two under-graduate research projects into the experiences of games players born in different halves of the school years [5, 11]. Previous research into relative age effect in sport has typically been quantitative in nature reducing each player to a very small set of variables such as month of birth, gender and level of play. The results of these quantitative studies have led authors to speculate about the psycholo-gical and physical impact of relative age effect as well as discussing implications for talent development and coaching. However, the author is unaware of any published study that has analysed the experiences of players born in different parts of the junior competition year in any detail. Therefore, the purpose of this sixth study is to describe the experiences of players born in different halves of the junior competition year using qualitative research methods. Most people’s first experience of games is within school sport and, therefore, the junior competition year is effectively the academic school year. One study conducted 13 interviews with international netball players [5]; 6 of the players had been born in the first half of the school year and 7 of the players had been born in the second half. The other study was a mixed methods investigation using quantitative techniques to find that the 74 out of a sample of 128 club hockey players who were born in the first half of the school year was significantly greater than expected (p = 0.035) [11]. This quantitative study was followed up with an interview study of 8 of the players; 4 were born in the first half of the school year and 4 were born in the second half. Both of these interview studies used interview guides based
0 1 2 3 2006 2007 2008 2009 2006 2007 2008 2009 Female Male Num b e r of Gra n d Sl am si ngl e s tournam e nts pl ayed H1 H2
Figure 2. The number of Grand Slam singles tournaments played per year by players born on or after 1st January 1985 (H1 players were born in the first half of year and H2 players were born in the second half of the year)
on four themes; participation motives, attrition motives, selection experiences and support networks.
The interviews were recorded and transcribed verbatim allowing analysis according to the themes of interest. Different coloured highlighter pens were used to represent each theme with evidence within each transcript relating to each theme being highlighted in the appropriate colour. During this process, a fifth theme emerged during the field hockey investigation which was inappropriate support [11]. Once each interview transcript had been analysed with respect to the themes, the complete set of transcripts was analysed on a theme by theme basis. Therefore, all of the interview transcripts within each study were firstly analysed using just the meaningful text highlighted for the theme of “participation motives”. This allowed patterns within the data to be recognized and an initial theory to emerge. The transcripts were reconsidered during a process of negative case selection to ensure that the emerging theory was consistent with the interview data. This process was repeated for each theme of interest with the critical stage being the comparison of findings between those players born in the first half of the school year and those players born in the second half.
There were more similarities than differences between players born in different halves of the school year in both studies. For the majority of the players in each study, participation originated in school and was influenced by peers and parents. Perception of ability was a crucial reason for participation; all of the participants identified themselves as being the one of the best players in their school. The participation motives changed as the players’ career progressed. Before the age of 15 years, the key motives included fun, enjoyment and playing because all their friends were playing. However, these altered between the ages of 15 and 18 years with importance being given to achieve-ment, winning, competition and selection for a higher team or representing the county.
Whether the players intended to continue participating in their sport or not, negative experiences that were encountered during selection, training and competition were the main reason for discontinuation or thoughts of discontinuation. A consistent issue was conflicting relationships between players and coaches. The data in both studies suggested that coaching style had
implications for attrition. Other problems reported included lack of feedback and perceptions of unfair treatment. This suggested that a negative coach-athlete relationship is a key factor in discon-tinuation. Time demands of training, matches, travel and the difficulty of balancing sport, education and social life lifestyle were experienced by the players. Location was related to the commitment required, with some participants having to travel to regional and national centres in order to train and compete once they were selected for higher level squads.
All players recognised the importance of the selection process within their sport. Before the age of 15 years, players were selected to play for their school. However, the participants identified different selection procedures at the different stages of their careers. Before the age of 15, the participants were not always selected. The players believed that selection was based on commitment to training rather than on ability. After the age of 18 years, the participants perceived selection to be based on ability, skill and talent to a greater extent than before the age of 18 years. The participants reported the importance of being known and previous selections. The effect of deselection that was experienced by a few participants was particularly negative.
The issue of support was reported within all participants’ transcripts. Family support included finance, transport, as well as emotional support. The type of support provided by the family between 15 and 18 years was different to that when the player reached 18 years. However, the experiences within both sets of players showed variability in the support experienced beyond the age of 18 years. Commitment and support provided by peers was also important. The effect of having a positive coach-athlete relationship was crucial in developing as a hockey player. This was evident throughout both studies. Opportunities to play, facilities and resources were also reported as important.
Inappropriate types of support have been reported as potential withdrawal motives. Many comments relating to inappropriate support could also be interpreted as attrition motives and it was often difficult to decide which theme to categorise comments within. Lack of feedback was reported by participants born in both halves of the junior competition year. Problems were reported after squad selections when some participants were not
provided with feedback on occasions when they had not been selected.
There were more similarities than differences found in the experiences of players born in different halves of the junior competition year. There were, however, some differences in the experiences of the two groups of hockey players that could be attributed to a relative age effect [11]. Physical advantage (size and strength) before the age of 18 and particularly before the age of 15 was a factor in how players perceived themselves. The participants born in the first half of the junior competition year tended to report that they were stronger at younger age groups while the participants born in the second half of the junior competition year reported that they were smaller and not among the strongest players. However one participant born in the second half of the junior competition year reported some advantages they experienced at younger age groups. Under the theme of selection, negative experiences related to relative age were reported, for example, perceptions that coaches believing it is essential to play the older players over the younger players. On the other hand, one participant born in the second half of the junior competition year reported benefits of playing with older people. Relative age is associated with biological age, although there are some who mature earlier or later than others born at the same time. Indeed, one of the early born participants in the current investigation may have been a late maturing player for her age.
The most interesting contrast between players born in the two halves of the school year was found in the netball study [5]. It was actually the players who were born early in the school year who experienced the most attrition motives. These players were perceived to be talented at an earlier age than the late born players. This led to their selection for regional and national age group squads, which resulted in a need for a great deal of commitment and travel. A further issue that was reported by these players was that they were selected for squads that contained older players and they found it difficult to integrate with the other players. This possibly occurred because the national governing body uses a cut-off date of 1st January, whereas school competition uses a cut-off date of 1st September.
These two studies showed that relative age effect is a secondary talent and participation factor [14] and that there is an important role for
qualitative research in the investigation of relative age effect in sport. Further research should apply qualitative research techniques to the study of relative age in tennis.
DISCUSSION
The current paper has reported on the continuing progress of a 25 year study of tennis players’ careers that commenced in 2003. Although the study will not be completed until 2027, there are already some interesting observations that can be made about the careers of tennis players born in different parts of the year.
The birth month distribution of players who participated in senior Grand Slam tournaments in 2009 is more uniform than it was in 2002-03 [6]. Indeed, the proportion of male players who were born in the first half of the year is not significantly different to the expected distribution based on a uniform birth rate for each day of the calendar year. This might be explained by the efforts made by the International Tennis Federation, national governing bodies and coaches to identify genuinely talented players accounting for physical maturation of young players. The relative age effect in tennis has been known since early investigations [4] and talent development research has recognised the role of physical maturity during the development of young players [1, 7]. However, there is still a greater percentage of female players who were born in the first half of the year participating in Grand Slam singles tournaments than expected and so greater efforts are needed to reduce the attrition of talented young female tennis players who were born in the second half of the year.
Changes in a 1984-1989 born players’ ITF junior rankings over a three year period reveal that female players’ rankings peaked in 2004 before declining in 2005. This may be explained by female players choosing to compete in senior tournaments before the age of 18. Indeed the current investi-gation of 2009 Grand Slam participants revealed that there were 14 female players who were born in 1991 or afterwards who were eligible to continue participating in ITF junior tour events. Over the three years from 2003 to 2005, the rankings of male and female players born in the second half of the year improved more than that of players born in the first half of the year. This might be explained by a greater number of players born in the first half of 386
the year moving into senior competition while they are still eligible to compete as juniors than would be the case for players born in the second half of the year. An alternative explanation is that as players get older, the physical disadvantages experienced by players born late in the year reduce resulting in them rising in the junior rankings as they approach the age of 18 years.
Previous research has found a gender/age group interaction on the distribution of birth months of elite tennis players with the percentage of elite players born in the first half of the year increasing as females moved from junior competition to senior competition while it decreased as male players moved from junior competition to senior com-petition [6]. This gender/age group interaction has also been found within the current investigation of elite players of the ITF junior tour in 2008 and senior Grand Slam singles participants in 2009. Girls mature earlier than boys [9] and may be better prepared for senior tennis before the age of 18. The current study found that 14 female players competed in senior Grand Slam singles events before the age of 18 compared to 4 male players. Only two of these female players and one of the male players were born in the second half of the year. This could reduce the skewed birth date distribution of elite junior female players and increase the skewed birth date distribution of elite senior female players. An alternative explanation for the gender/age-group interaction is that the physical impact of relative age effect may be greater for boys than it is for girls leading to a higher proportion of elite junior male players being born in the first half of the calendar year (61.8%) than elite junior females (53.1%). As male players get older, the relative age effect will decrease leading to senior players born in the second half of the year rising in the rankings and as a result reducing the proportion of elite senior male players born in the first half of the year. The psychological impact of the relative age effect may be more severe for young female players than it is for young male players. Qualitative research studies have revealed that females in team sports experience attrition motives during adolescent years [5, 11]. If female tennis players who were born late in the year withdraw from the sport as a result of negative experiences of competition and selection then there would be an increase in the percentage of eventual senior female players who had been born in the first half of the year.
The current investigation has also provided evidence that players born in the second half of the year can enjoy greater success than those born in the first half of the year. For example, female players born in the second half of the year qualified for fewer senior Grand Slam singles tournaments in 2006 but significantly more senior Grand Slam singles tournaments in 2009 than female players born in the first half of the year. Another example of the success of late born players is that male players born in the second half of the year compete in senior Grand Slam singles tournaments until an older age than those born in the first half of the year. Efforts should be made to identify and support genuinely talented tennis players who have the potential to be successful as fully mature senior players. If such players can continue participating as senior players, they will no longer experience a relative age disadvantage and can improve their World ranking and their chance of success in Grand Slam singles tournaments.
In conclusion, the current investigation has revealed different patterns in the participation and performance of tennis players born in different halves of the year. This report has come 7 years into a 25 year study and future research will report on the continued progress of the tennis players under investigation. Future research should also use complementary qualitative research to investigate the experiences of tennis players born in different parts of the year to give greater understanding of the relative age effect.
REFERENCES
[1] Abbott A., Collins D., Eliminating the dichotomy between theory and practice in talent identification and development: considering the role of psycho-logy, Journal of Sports Sciences, 2004, 22: 395-408. [2] Baxter-Jones A.D.G., Growth and development of young athletes: should competition be age related?, Sports Medicine, 1995, 20: 59-64.
[3] Boucher J.L., Mutimer B.T.P., The relative age phenomenon in sport: replication and extension with ice-hockey players, Research Quarterly for Exercise and Sport, 1994, 65: 377-381.
[4] Dudink A., Birth date and sporting success, Nature, 2004, 368: 592.
[5] Edwards L., Relative age in netball: a qualitative investigation, B.Sc Hons Dissertation, University of Wales Institute Cardiff, 2007.
[6] Edgar S., O’Donoghue P.G., Season of birth distribution of elite tennis players, Journal of Sports Sciences, 2005, 23: 1013-1020.
[7] Helsen W.F., Hodges N.J., Van Winckel J., Starkes J.L., The roles of talent, physical precocity and practice in the development of soccer expertise, Journal of Sports Sciences, 2000, 18: 751-736. [8] Joll A., O’Donoghue P.G., Relative age distribution
of Welsh netball players, International Journal of Coaching Science, 2007, 1: 3-30.
[9] Malina R.M., Growth, exercise, fitness and later outcomes, (in:) C. Bouchard and R.M. Malina, eds, Exercise, fitness and health: a consensus of current knowledge, Champaign, Ill., Human Kinetics 1990, pp. 637-653.
[10] O’Donoghue P.G., Season-of-birth effects on elite junior tennis players’ world rankings, (in:) A. Lees, D. Cabello and G. Torres, eds, Science and Racket Sports IV, London: Routledge 2009, 275-281.
[11] Perham S., Relative age in club level field hockey: a quantitative and qualitative investigation, B.Sc Hons Dissertation, University of Wales Institute Cardiff, 2008.
[12] Simmons C., Paull G.C., Season-of-birth bias in association football, Journal of Sports Sciences, 2001, 19: 677-686.
[13] Thompson A., Barnsley R., Stebelsky G., Born to play ball: the relative age effect and major league baseball, Sociology of Sport Journal, 1991, 8: 146-151.
[14] Wattie N., Baker J., Cobley S., Montelpare W.J., A historical examination of relative age effects in Canadian hockey players, International Journal of Sport Psychology, 2007, 38: 178-186.