TRENDS
in
Sport Sciences
2015; 3(22): 145-152 ISSN 2299-9590Changes in lactate, pyruvate and glucose levels in field
hockey players under different training and match stimuli
TOMASZ PODGÓRSKI1, JACEK ADRIAN2, ALEKSANDRA NOWAK3
Abstract
Introduction. Lactate, pyruvate and glucose levels are the most common biochemical markers used for controlling training loads and physical efficiency of athletes. Each stage of a field hockey training cycle requires activation of a different metabolite responsible for physical exercise. Aim of Study. The aim of the study was to determine the biochemical response of field hockey players to different types of exercise in a training cycle in comparison to a real match. Material and Methods. Ten male university team field hockey players took part in the study. The players were examined six times during an annual training cycle. The examination consisted of the following tests: treadmill test (twice), 13 km running, interval training, spinning, and a real field hockey match. During the tests pre- and post-exercise capillary blood from a fingertip was collected to determine the lactate (La), pyruvate (Pa) and glucose levels using enzyme methods. Furthermore, bioelectrical impedance analysis (BIA) was carried out four times during the annual training cycle. Results. Each exercise test increased the La and Pa concentrations, however, the glucose level was raised only during the treadmill tests. The 13 km running test and interval training results were statistically different. The most essential changes of La and Pa concentrations were noted between the treadmill tests and the match. Conclusions. The aim of field hockey training is to prepare players to meet match requirements. The analysis of players’ metabolic responses to different kinds of training indicates that a match effort is similar to 13 km running and physiologically close to interval training. KEYWORDS: biochemistry, training process, aerobic exercise, anaerobic exercise.
Received: 12 May 2015 Accepted: 15 August 2015
Corresponding author: podgorski@awf.poznan.pl
1 University School of Physical Education, Department
of Biochemistry, Poznań, Poland
2 University School of Physical Education, Department of Team
Sports Games, Poznań, Poland
3 University of Life Science in Poznań, Physical Culture Center,
Poznań, Poland
What is already known on this topic?
There have been many studies on the impact of individual exercise tests on field hockey players, but so far no study results have not been compared with different training procedures and real match competition. Little has been known about metabolic response to these kinds of exercise in field hockey players during an annual training cycle.
Introduction
L
actic acid (LA) concentration is a frequently used marker of intensity of anaerobic changes [1]. This metabolite is a direct product of the glucose transformation called glycolysis. Ten reactions of this metabolic pathway, both aerobic and anaerobic, take place in the cytosol. Pyruvic acid (PA) – a product of the last reaction of the pathway – is transported directly to a mitochondrion, where it is changed into acetylo-CoA by way of decarboxylation oxydation and then joins the Krebs cycle. In case of insufficient oxygen supply, which is caused by intense physicalexercise, pyruvic acid is converted into lactic acid in the cytosol with the lactate dehydrogenase enzyme (EC 1.1.1.27). Only two ATP molecules are delivered by way of anaerobic transformation, compared to 36 molecules of ATP in aerobic energy metabolism. The anaerobic transformation of glucose plays several essential roles in the human body in spite of its lower effectiveness in comparison with aerobic metabolism. The dissociation of lactic acid leads to a temporary diminution of pH in the contracted muscle cells [2, 3]. Hydrogen ions reduce muscular power and change the reception of sensor feelings [4]. The reaction of the transformation from pyruvic acid into lactic acid prevents nicotinamide adenine dinucleotide (NADH+H+) from accumulating in the myocyte. It is
caused by the transformation of NADH+H+ into an
oxidized form of NAD+, which enables glycolysis in
anaerobic conditions. The lactic acid produced this way is excreted directly from the muscle cells into the bloodstream where it is picked up by the liver and transformed into glucose during gluconeogenesis [5]. The lactic acid concentration should decrease during properly-conducted training. It would show adaptation changes which tend to increase resistance to muscle weakness and more effective exploitation of energy from the glucose transformation. The relation of lactic acid to pyruvic acid concentration in the blood provides valuable information about the speed of lactic acid transformation during gluconeogenesis [6, 7]. Field hockey is an endurance-speed team sport. Field hockey players have to display high levels of motor abilities because the game requires multiple repeated physical efforts not only of high intensity but also of changeable duration. The energy for muscle during field hockey exercise comes from aerobic and anaerobic metabolism. The new field hockey rules permit countless substitutions of players during a match. This increases the speed of the game and prevents the players from fatigue [8].
A field hockey player usually covers a distance of 9 to 11 km during a single match. The players are forced to make quick runs over a few-meter distance in different time intervals. For example, a player starts running to the ball and runs no longer than 1.0 s, with the ball or changing a position with or without an opponent. The most typical exercise type among field hockey players is running over short distances of about 20 meters [9]. A biometric distribution of a player’s physical effort types during a field hockey match is: walking 46.5%,
jogging 40.5%, striding 4.1%, sprinting 1.5% and standing 7.4% [10]. The latest changes in field hockey rules (self-passes and multiple substitutions) have caused an acceleration of the game and increased the effective time of play. The average time of players’ participation in a game has been reduced to 57.20, 49.25, and 44.34 minutes for full-backs, midfielders and strikers, respectively. On the other hand, the average distance made by all players on a team has not changed; however, the proportions of different types of physical efforts have changed during a match. The numbers of the running and sprinting efforts have also significantly increased during a match [11].
The aim of training in field hockey is to develop players’ technical, tactical, motor and psychological abilities. Each player should be physically well-prepared to be able to meet the demands of the competitive and training seasons. General physical fitness is the most important component in physical preparation of field hockey players, which constitutes the basis for further development of tactical and technical skills. It is also the basis for development of strength and speed-endurance, i.e. the main and most characteristic motor ability in field hockey [12, 13].
The motor preparation of field hockey players involves endurance (aerobic) training, speed (anaerobic) training, and strength training. The three types of training have different characteristics, increase players’ VO2max, reduce lactate concentration in muscles and in blood, and increase acidification tolerance. The training process is to make the players meet field hockey demands during the match.
The aim of the study was to determine the biochemical response of field hockey players to different types of efforts in a training cycle and in real match conditions. Material and Methods
Participants
Ten male field hockey players from a university team (AZS AWF Poznań), excluding goalkeepers, took part in the study. Each participant was informed about of the goals of the study and gave their informed consent to participate, as required by the Bioethics Committee of the Poznań University of Medical Sciences in Poznań, Poland.
The study was carried out during an annual training cycle consisting of a training preparation stage and a competitive stage. Adequate training loads where used
at each stage. Aerobic loads were used in the 1st and
the 2nd training period of the preparation stage. Mixed
loads with anaerobic elements were used in the 2nd
and the 3rd training periods. Supporting training units
were applied at the competitive stage (1st period). Also
dynamic, speed and technical–tactical training units were used.
The players undertook six tests (T1-T6) during the training cycle (Figure 1):
T1 (treadmill test 1) 5th February 2014
T2 (13 km running) 24th February 2014
T3 (interval training) 3rd March 2014
T4 (spinning) 1st April 2014
T5 (a match) 13th April 2014
T6 (treadmill test 2) 6th May 2014
1. Treadmill test 1,2 T1/T6 5th February/
/6th May 2014
The aim of the research was to examine players’ general fitness determined directly by the volume of maximum oxygen uptake. The ventilatory anaerobic threshold was estimated. The players underwent a standard research procedure in order to assess their
general fitness. The test was carried out on a motorized
treadmill. At the start, the treadmill speed was 8.7 km/h and was increased for 0.7 km/h every minute to determine the lactate threshold (LT), VO2max, and response to exercise. The test was completed when the player reached the maximum load, maximum heart rate (HRmax), lacked oxygen supply, or refused to continue the test. LT and VO2max were the markers of players’ fitness (data not shown).
2. 13 km running 24th February 2014
The aerobic training test – a 13 km continuous run was performed on an athletic track after a 15 minute warm up at an individual heart rate. The mean heart rate of the field hockey players was 178.78 ± 1.25 bpm.
3. Interval training test 3rd March 2014
The players performed the interval training test after a 20 minute warm up. It consisted of eight series of runs on the athletic track (10/50s, 20/40s, 30/30s, 40/20s, 50/10s) at 90-100% of their capacity during each series. A two-minute slow jog was performed between the series. 4. Training (indoor cycling) 1st April 2014
The test (indoor cycling) was carried out with changeable loads (80-90% of hrmax) in three main positions on the bike.
5. The match (5:3) 13th April 2014
A national championship match was played between AZS AWF Poznań and UKh Start Gniezno. AZS AWF won 5:3. The match consisted of two halves, 35 minutes each, with unlimited substitutions of players. Procedures
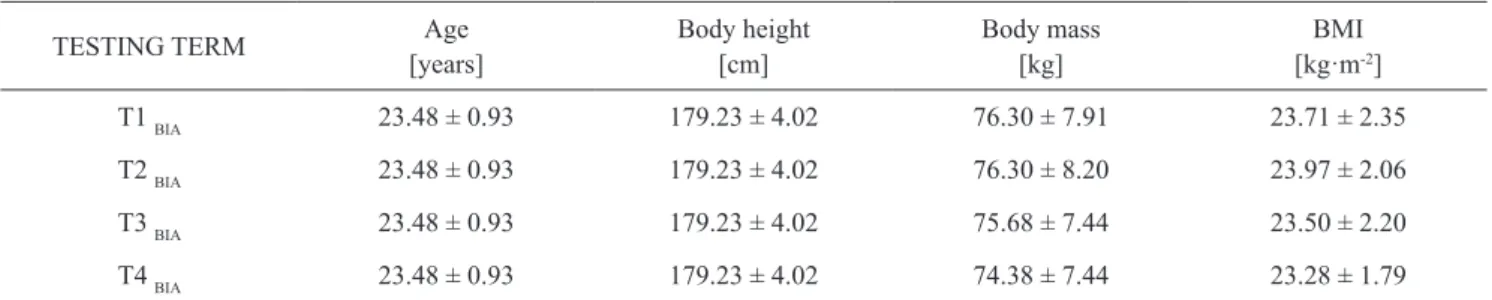
Anthropometric measurements (body height and body mass) were performed four times (Figure 1) with the use of an analytical balance WPT 60/150 O (Radwag®,
Poland) and a TANITA MC-780 (Japan) bioelectrical impedance analysis (BIA) system to calculate the players’ body mass index (BMI). The anthropometric parameters are shown in Table 1. The measurements Table 1. Anthropometric measurements (mean ± Sd) of field hockey players under study
TESTING TERM [years]Age Body height[cm] Body mass[kg] [kg·mBMI -2]
T1 BIA 23.48 ± 0.93 179.23 ± 4.02 76.30 ± 7.91 23.71 ± 2.35
T2 BIA 23.48 ± 0.93 179.23 ± 4.02 76.30 ± 8.20 23.97 ± 2.06
T3 BIA 23.48 ± 0.93 179.23 ± 4.02 75.68 ± 7.44 23.50 ± 2.20
T4 BIA 23.48 ± 0.93 179.23 ± 4.02 74.38 ± 7.44 23.28 ± 1.79
Figure 1. Fitness testing terms (T1-T6) and anthropometric measurements with BIA method in field hockey players under study
were taken on an empty stomach, from 8 a.m. to 2 p.m. The training loads were monitored and HR measured with a Polar TEAM2 system (Finland).
Blood Sampling
The biological material was collected by professional laboratory staff. All the cleaning and care rules were strictly followed during the time of blood collection. Capillary blood was collected from a fingertip of the non-dominant hand using a disposable lancet-spike (Medlance® Red, HTL-Zone, Germany) with a 1.5 mm
blade and 2.0 mm penetration depth. The material volume of 50 µl was collected into a neutral (without anticoagulant) glass capillary (Vitrex, Medlab, Poland). During each experiment capillary blood was collected twice: before exercise and three minutes after its completion. Biochemical Analyses
The blood samples were deproteinized in 0.6 mol·l-1
of perchloric acid (HCLO4). After centrifuging (4000g/10min/4°C) the supernatant was isolated. The enzymatic marking of lactate (La) and pyruvate (Pa) concentrations was based on methodology proposed by Maughan [14]. Lactate is converted to pyruvate during a reaction with an oxidized form of nicotinamide adenine dinucleotide (NAD+) and lactate
dehydrogenase (EC 1.1.1.27) in a glycine-hydrazine buffer (pH = 9.0). A spectrophotometric measurement was carried out with a multi-mode microplate reader (Synergy 2 SIAFrT, BioTek, USA) at maximum absorption λ = 340 nm, after one-hour incubation in ambient temperature.
Pyruvate is converted to lactate during a reaction with a reduced form of nicotinamide adenine dinucleotide (NADH+H+) and lactate dehydrogenase (EC 1.1.1.27)
in a phosphate buffer (ph = 7.0). A fluorometric measurement was made with a multi-mode microplate reader (Synergy 2 SIAFrT, BioTek, USA) at excitation wavelengths λ = 360/40 nm and emission wavelengths of 460/40 nm, after one-hour incubation in ambient temperature.
Glucose concentration was detected with a PZ Cormay test (liquick Cor-GlUCoSe 60, catalogue no 2-201,
Poland). Spectrophotometric measurement was made on a multi-mode microplate reader (Synergy 2 SIAFRT, BioTek, USA) at maximum absorption λ = 540 nm, after ten-minute incubation in ambient temperature. Statistical Analysis
The results were presented as means and standard deviation (SD) using the Statistica 10.0 software package (StatSoft. Inc., the USA). The differences between pre- and post-exercise measurements of biochemical parameters (carried out six times during the experiment) were determined with the Wilcoxon test. The level of statistical significance for all analyses was set at 95.0% (p < 0.05).
Results
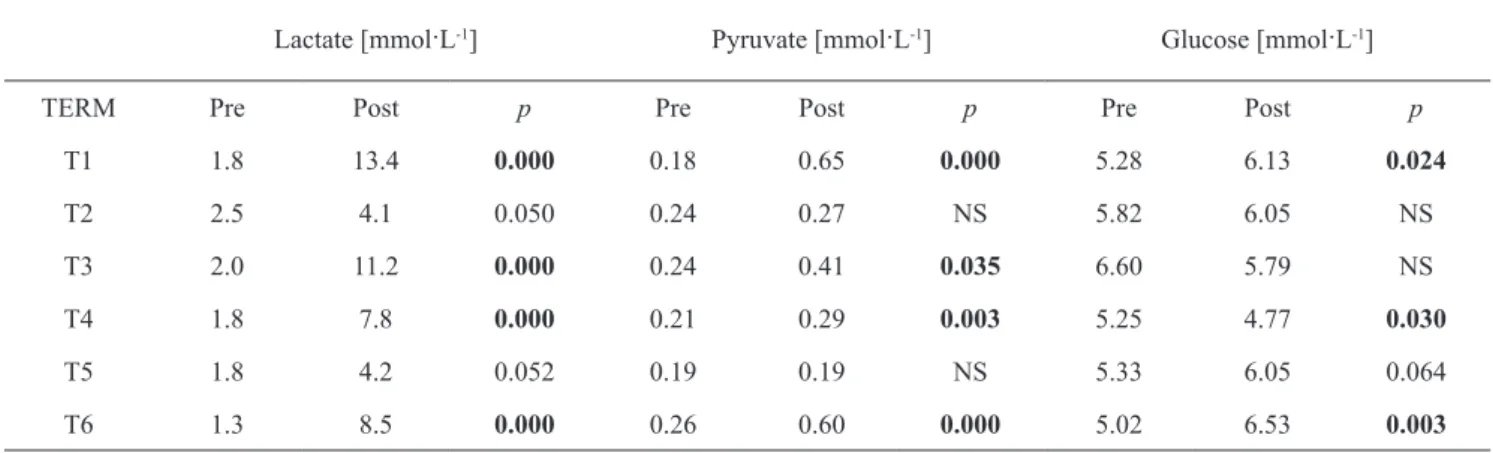
The changes of the lactate, pyruvate and glucose blood concentrations blood in field hockey players before and after the exercise test, at six different times of the experiment are presented in Table 2.
Table 2. Pre- and post-exercise concentrations of lactate, pyruvate and glucose (mean ± Sd) in field hockey players
lactate [mmol·l-1] Pyruvate [mmol·l-1] Glucose [mmol·l-1]
TERM Pre Post p Pre Post p Pre Post p
T1 1.8 13.4 0.000 0.18 0.65 0.000 5.28 6.13 0.024 T2 2.5 4.1 0.050 0.24 0.27 NS 5.82 6.05 NS T3 2.0 11.2 0.000 0.24 0.41 0.035 6.60 5.79 NS T4 1.8 7.8 0.000 0.21 0.29 0.003 5.25 4.77 0.030 T5 1.8 4.2 0.052 0.19 0.19 NS 5.33 6.05 0.064 T6 1.3 8.5 0.000 0.26 0.60 0.000 5.02 6.53 0.003
Lactate (p) T2 T3 T4 T5 T6 T1 0.000 NS 0.001 0.000 0.021 T2 0.000 0.012 NS 0.001 T3 NS 0.000 NS T4 0.060 NS T5 0.005 nS – not significant
Figure 2. differences of lactate concentration (mean ± Sd) in six pre- and post-exercise testing terms carried out during the experiment. The relations between the measurement terms are shown in the Table 2
Pyruvate (p) T2 T3 T4 T5 T6 T1 0.000 0.003 0.000 0.000 NS T2 NS NS NS 0.000 T3 NS NS NS T4 NS 0.001 T5 0.000 nS – not significant
Figure 3. differences in pyruvate concentration (mean ± Sd) in six pre- and post-exercise testing terms carried out during the experiment. The relations between the measurement terms are shown in the Table 2
Figure 4. differences of glucose concentration (mean ± Sd) in six pre- and post-exercise testing terms carried out during the experiment. The relations between the measurement terms are shown in the Table 2
Glucose (p) T2 T3 T4 T5 T6 T1 NS 0.057 NS NS NS T2 NS NS NS NS T3 NS 0.099 0.009 T4 NS NS T5 NS nS – not significant The lowest pre- and post-exercise difference in lactate
concentration was found during the 13 km running training test (T2); while the highest one was observed during the 1st test on the motorized treadmill (T1) (Figure 2).
The pyruvate concentration in blood is presented in Figure 3. It shows the increases of post-exercise concentration of this metabolite for 255.3% in T1,
14.5% in T2, 68.1% in T3, 39.2% in T4, 2.9% in T5, and 129.0% in T6.
In the third part of the research a decrease of post-exercise glucose concentration was observed. However, in the other parts an increase was noticed. The crucial statistical differences in the six tests of the study turned out to be between T6 and T3, T6 and T4 (Figure 4).
Discussion
The course of metabolic processes in players during training is similar to that during a sports match. Athletes’ motor preparation involves endurance (aerobic) training, speed (anaerobic) training, and strength training. The physical preparation of field hockey players is of slightly different character in terms of training types and stages. General endurance training is the basis of aerobic motor preparation (continuous running). Such exercises are to reduce the lactate concentration in muscles and plasma, and increase the lactate threshold. They allow players to perform more effective work without fatigue signs created by lactic acid in working muscles. A similar training process is used by football players [15]. The increase in aerobic endurance has a huge effect on the number of covered kilometers and performed sprints during a football match. It also affects the number of football players’ contacts with the ball. Similar results were found for field hockey players [11].
Field hockey players should be prepared to perform physical efforts of high intensity during the entire match [16]. Studies confirm that the efforts should not exceed the lactate threshold. This can be achieved by multiple substitutions during the match made by the coach [11]. The statistics on the last Olympic Games show that the world’s top field hockey teams use about 60 substitutions per match. Such intensity of the game has a direct influence on players’ motor preparation. Speed training units involving anaerobic exercises used in field hockey players’ preparation exceed the lactate threshold. They increases players’ tolerance to very high lactate concentrations in muscles and blood, and raise the lactate threshold of individual players [17, 18].
The use of mixed training units (interval, endurance-speed, speed) should adapt players to tolerate fatigue, which is caused by lactate accumulation. The increase in lactate can be the result of the playing intensity or excessively long participation in the game [19].
Biochemical markers in biological fluids are used to control the training level [20]. Physical exercise has a direct influence on releasing the metabolites by working muscles, especially the lactic acid which leads to post-exercise metabolic acidosis [21]. Control of the lactate concentration in blood may show the direction of adaptation changes and even allow predicting the shape of athletes’ motor abilities [22]. Research carried out on football players, whose energy input is similar to that
of hockey players, shows that the lactate concentration after a match rises to 9 mmol/L or, in some cases even to 10 mmol/L [23]. The same relationship was observed in the present study. The lactate concentration after a match (T5) was 10.9 mmol/l in one case. Significant differences between players were observed during the T5 testing term, which resulted from players’ individual motor preparation and commitment to the match. The conditions of exercise test should be taken into consideration while interpreting the level of acidification caused by the lactate increase. Kunduracioglu et al. [27] noted that a treadmill test brought about a lower lactate concentration than an outdoors test in spite of the same heart rate levels in both test. A counterproductive trend was observed in the present study: post-exercise LA concentrations after treadmill tests were significantly higher than after the match (T5). difficulties in standardization of physical exercise intensity on a natural surface may be the reason for the differences.
Bishop and Spencer [25] showed that the rise of lactate concentration in some cases after intensive physical exercise was accompanied by lowering the pH level and buffering capacity. Strzelczyk et al. [26] claim that the estimation of lactate concentration during an annual training period yields valuable information about the preparation and efficiency level of field hockey players. Pyruvate is a biochemical index which shows the speed of metabolic reprocessing in muscles during physical exercise. Pyruvate, like lactate, is detected by the liver and converted to glucose in gluconeogenesis [27]. The most efficient intercept of pyruvate is observed during competitive matches, which was proven in our research (T5). It also turned out that the biggest growth of pyruvate concentration takes place during both treadmill tests (T1 & T6). It may be a result of differences in players’ movements during the run on the treadmill track (steady) and during the match (full movement range). The research shows that at a low training load lactate and pyruvate concentrations increase proportionally. The lactic acid level decreases after two minutes, contrary to pyruvic acid which grows immediately in the restitution period, even up to five minutes after completing the exercise [28]. It is probably the result of a higher lactate dehydrogenase (LDH) activity in the muscles of highly trained athletes. This enzyme leads to faster lactate oxidation and temporary growth of concentrations of pyruvate and hydrogen ions [29].
An increase in metabolite concentration was revealed only in one case during the measurements. It is due to the body’s reaction to the load and the onset of glycogen decomposition in muscles and liver during glycolysis. Adrenaline, which is excreted during physical exercise is the main catalyst in this process [30]. The increase of glucose concentration during the match (T5) indicated its huge demand. The process of glycogen depletion is more intensive during a competitive game than during training. Conclusions
The aim of field hockey training is to prepare players to meet the demands of a match. Analyses of metabolic response to different kinds of training targets show that a match effort is similar to a 13 km running effort (blood lactate and pyruvate concentrations), and physiologically to interval training (heart rate).
What this study adds?
The measurement of biochemical parameters in athletes is very important to control their sport efficiency. The most common analyzed metabolite is blood lactate which informs about the state of athlete’s adaptability to a given sport discipline. Some types of exercise tests should be, in fact, exclusively aimed at providing real efforts during matches. The aim of the study was to verify which training methods were the most helpful to improve field hockey players’ capabilities. Analyzing blood lactate, pyruvate and glucose concentrations by different exercise tests and matches showed that no exercise test involved a similar metabolic response to a physical effort during a real match.
Acknowledgments
The research was supported by grant NRSA2 04052 “development of University Sports in Poland” from the Polish Ministry of Science and Higher Education.
References
1. Banister EW, Allen ME, Mekjavic IB, Singh AK, Legge B, Mutch BJC. The time course of ammonia and lactate accumulation in blood during bicycle exercise. Eur J Appl Physiol Occup Physiol. 1983; 51(3): 195-202. 2. Nummela A, Vuorimaa T, Rusko H. Changes in force
production, blood lactate and EMG activity in the 400-m sprint. J Sports Sci. 1992; 10(3): 217-228.
3. Kristensen M, Albertsen J, Rentsch M, Juel C. Lactate and force production in skeletal muscle. J Physiol. 2005; 562(Pt 2): 521-526.
4. Cheung K, Hume PA, Maxwell L. Delayed onset muscle soreness: treatment strategies and performance factors. Sports Med. 2003; 33(2): 145-164.
5. Juel C, Halestrap AP. Lactate transport in skeletal muscle – role and regulation of the monocarboxylate transporter. J Physiol. 1999; 517(3): 633-642.
6. Scheele K, Herzog W, Ritthaler G, Wirth A, Weicker H. Metabolic adaptation to prolonged exercise. Eur J Appl Physiol Occup Physiol. 1979; 41(2): 101-108.
7. Hoff J, Svendsen LH, Helgerud J. Lactate production and elimination in ice hockey players during an elite series match. Corpus, Psyche & Societas. 2001; 8(1-2): 45-55. 8. Podgórski T, Pawlak M. A half century of scientific
research in field hockey. human Movement. 2011; 12(2): 108-123.
9. Konarski J. Characteristics of chosen parameters of external and internal loads in eastern European high level field hockey players. J hum Sport exerc. 2010; 5(1): 43-58.
10. Spencer M, Lawrence S, Rechichi C, Bishop D, Dawson B, Goodman C. Time-motion analysis of elite field hockey, with special reference to repeated-sprint activity. J Sports Sci. 2004; 22(9): 843-850.
11. Jennings D, Cormack SJ, Coutts AJ, Aughey RJ. GPS analysis of an international field hockey tournament. Int J Sports Physiol Perform. 2012; 7(3): 224-231. 12. Adrian J. Charakterystyka hokeja na trawie
(Characteristics of field hockey). In: Sozański h, Czerwiński Z, eds., Współczesne koncepcje szkolenia w zespołowych grach zespołowych (Modern ideas of team sports training, Gdańsk 2004.
13. Konarski J, Matuszyński M, Strzelczyk r. different team defense tactics during a field hockey match. Stud Phys Cult Tour. 2006; 13(Suppl.): 145-147.
14. Maughan RJ. A simple, rapid method for the determination of glucose, lactate, pyruvate, alanine, 3-hydroxybutyrate and acetoacetate on a single 20-mul blood sample. Clin Chim Acta. 1982; 122(2): 231-240. 15. helgerud J, engen lC, Wisloff U, hoff J. Aerobic
endurance training improves soccer performance. Med Sci Sports Exerc. 2001; 33(11): 1925-1931.
16. Castagna C, Abt G, D’Ottavio S. The relationship between selected blood lactate thresholds and match performance in elite soccer referees. J Strength Cond Res. 2002; 16(4): 623-627.
17. Stegmann H, Kindermann W, Schnabel A. Lactate kinetics and individual anaerobic threshold. Int J Sports Med. 1981; 2(3): 160-165.
18. Baldari C, Guidetti L. A simple method for individual anaerobic threshold as predictor of max lactate steady state. Med Sci Sports Exerc. 2000; 32(10): 1798-1802. 19. Aslan A, Acikada C, Güvenç A, Gören H, Hazir T,
Özkara A. Metabolic demands of match performance in young soccer players. J Sports Sci Med. 2012; 11(1): 170-179.
20. Ahlborg G, Felig P, Hagenfeldt L, Hendler R, Wahren J. Substrate turnover during prolonged exercise in man. Splanchnic and leg metabolism of glucose, free fatty acids, and amino acids. J Clin Invest. 1974; 53(4): 1080-1090.
21. Gollnick PD, Bayly WM, Hodgson DR. Exercise intensity, training, diet, and lactate concentration in muscle and blood. Med Sci Sports Exerc. 1986; 18(3): 334-340.
22. Andrzejewski M, Domaszewska K, Chmura J, rychlewski T, Kubalewska M. Influence of speed training loads on the activity of creatine kinase and lactic dehydrogenase and the concentration of oxypurines in blood samples of young football players. Pol J Sports Med. 2008; 3(6); 149-158.
23. Bangsbo J. Energy demands in competitive soccer. J Sports Sci. 1994; 12(Spec No.): S5-S12.
24. Kunduracioglu B, Guner r, Ulkar B, erdogan A. Can heart rate values obtained from laboratory and field lactate tests be used interchangeably to prescribe exercise intensity for soccer players? Adv Ther. 2007; 24(4): 890-902.
25. Bishop D, Spencer M. Determinants of repeated-sprint ability in well-trained team-sport athletes and endurance-trained athletes. J Sports Med Phys Fitness. 2004; 44(1): 1-7.
26. Strzelczyk R, Konarski J, Karpowicz K, Janowski J. Changes in the main abilities of field hockey players during the preparatory period leading up to the main competition. Gymnica. 2001; 31(2): 17-21.
27. Rowell LB, Kraning KK 2nd, Evans TO, Kennedy JW, Blackmon JR, Kusumi F. Splanchnic removal of lactate and pyruvate during prolonged exercise in man. J Appl Physiol. 1966; 21(6): 1773-1783.
28. Wasserman K, Beaver WL, Davis JA, Pu JZ, Heber D, Whipp BJ. Lactate, pyruvate, and lactate-to-pyruvate ratio during exercise and recovery. J Appl Physiol. 1985; 59(3): 935-940.
29. Putman CT, Jones NL, Lands LC, Bragg TM, Hollidge-Horvat MG, Heigenhauser GJ. Skeletal muscle pyruvate dehydrogenase activity during maximal exercise in humans. Am J Physiol. 1995; 269(3 Pt 1): E458-468. 30. Watt MJ, Howlett KF, Febbraio MA, Spriet LL,
Hargreaves M. Adrenaline increases skeletal muscle glycogenolysis, pyruvate dehydrogenase activation and carbohydrate oxidation during moderate exercise in humans. J Physiol. 2001; 534(Pt 1): 269-278.

![Recenzja [Roman Kubicki] rozprawy doktorskiej "Obrazy dialektyczne : czyli między przeciwieństwami w sztuce"](data:image/gif;base64,R0lGODlhAQABAIAAAP///wAAACH5BAEAAAAALAAAAAABAAEAAAICRAEAOw==)