Korekta językowa: Maryla Błońska, Małgorzata Pająk, Lidia Pernak, Zbigniew Pyszka, Beata Siczek, Dominika Świech
Skład i łamanie: Małgorzata Pająk Projekt okładki: Marcin Szadkowski ©Copyright: Społeczna Akademia Nauk
ISSN 2543-8190
Wersja elektroniczna publikacji jest wersją podstawową, dostępną na stronie: piz.san.edu.pl
Andrzej Bujak, Katarzyna Topolska, Katarzyna Kolasińska-Morawska | Wstęp ... 6 Część I. Zrównoważone zarządzanie łańcuchami dostaw
Katarzyna Nikorowicz-Zatorska | Analysis and Use of the Concept of Noise Zoning Plan (NZP) for the Lodz Airport. A Case Study ... 9 Damian Ostrowski, Agnieszka Piasecka-Głuszak | Zaangażowanie pracowników w realizację metody 5S w przedsiębiorstwie produkcyjnym – wyniki badań ankietowych ... 25 Joanna Kott, Andrzej Bujak, Marek Kott | Gospodarka 4.0 a elektroenergetyka ... 43 Ewa Płaczek | Logistyka w erze Industry 4.0 ... 55 Aleksandra Radziszewska | Logistics Customer Service Quality in the Context
of Omni-channel Strategy ... 67 Maciej Stajniak, Sylwia Konecka, Paweł Romanow | Planowanie sprzedaży i operacji w logistyce przedsiębiorstw wg metody S&OP ... 77 Maciej Urbaniak | Wymagania stawiane dostawcom związane z wdrażaniem systemowego zarządzania środowiskiem i energią ... 87 Tomasz Jałowiec | Perspektywiczne kierunki badań w logistyce wojskowej ... 103 Marzena Kramarz | Personalizacja produktów w sieci dystrybucji wyrobów hutniczych – kontekst zakłóceń ... 115 Krzysztof Łobos, Elżbieta Stańczyk | Czy warto zarządzać nowocześnie? Wpływ wybranych zmiennych z obszaru zarządzania na rozwój polskich przedsiębiorstw
klasy MŚP ... 131 Rafał Matwiejczuk | Przesłanki tworzenia przewagi konkurencyjnej w oparciu o strategiczny profil logistycznych potencjałów sukcesu przedsiębiorstwa ...143 Anna Górczyńska, Grzegorz Lichocik, Adam Sadowski | Environmental Performance of Road Transport Systems. Case Study of Logistics Operator ... 153 Karolina Lubieniecka-Kocoń, Katarzyna Wąsowska | IT and ICT Tools in Managing Transport in An Emergency Situation ... 165 Mariusz Topolski, Katarzyna Topolska | Modelowanie problemów decyzyjnych systemów transportowych ... 175 Jacek Jagodziński, Damian Ostrowski | Staż pracy pracowników administracyjnych a znajomość wybranych narzędzi koncepcji Lean Manufacturing na przykładzie
przedsiębiorstwa produkcyjnego z branży transportowej ... 189 Anna Orzeł | International Road Transport in the Outsourcing Aspect on the Example of Poland ... 205
Aleksander Szlachta | Zarządzanie bezpieczeństwem systemu logistycznego w świetle norm międzynarodowych ... 247 Jacek Szołtysek | Czy koncepcja zarządzania logistycznego w czasie nowych możliwości jest odporna na zmiany? ... 261 Sebastian Twaróg, Jacek Szołtysek | Komponenty skuteczności w zarządzaniu łańcuchami dostaw krwi w Polsce ... 275 Jędrzej Jachira, Andrzej Bujak | Zarządzanie dywersyfikacją dostaw energii na
przykładzie projektów PCI ... 289 Jędrzej Jachira | Prawne aspekty zarządzania ryzykiem podatkowym w przedsiębiorstwie ... 299 Część III Perspektywiczne kierunki badań w logistyce miast
Piotr Banaszyk | Cele i kryteria decyzyjne logistyki miasta w świetle teorii szczęścia ... 313 Anna Brdulak, Grażyna Chaberek-Karwacka | Kultura organizacyjna start-upów jako narzędzie rozwoju zrównoważonego miast ... 325 Sabina Kauf | Logistyka publiczna jako wyraz smart governance ... 339 Urszula Motowidlak | Analiza kosztów i korzyści jako jeden z obowiązków
implementacji ustawy o elektromobilności i paliwach alternatywnych w komunikacji miejskiej w Polsce ... 351 Katarzyna Topolska, Mariusz Topolski | Rola instrumentów zarządzania przewozami pasażerskimi w transporcie miejskim ... 363 Hanna Ziętara | Społeczno-przestrzenne funkcje gastronomii w przestrzeniach
miejskich ... 375 Beata Milewska, Dariusz Milewski | A Sustainable Supply Chain in Clothing
Wstęp
Dzisiejszy rynek i oczekiwania klientów zmieniają się tak szybko, że wiele rozwiązań i kon-cepcji logistycznych uległo dezaktualizacji lub wymaga radykalnych zmian. Skuteczna lo-gistyka na dzisiejszym coraz bardziej skomplikowanym i konkurencyjnym rynku generu-je potrzebę zastosowania wielu nowych, innowacyjnych rozwiązań, koncepcji i działań. Konieczne jest zastosowania technologii, które zapewnią widoczność w całym łańcuchu dostaw, reagowania w czasie rzeczywistym, wdrożenia koncepcji typu End-to-End i in-nych, a przede wszystkim wszelkich rozwiązań, które pozwolą skutecznie odpowiadać na oczekiwania współczesnego klienta. Poszczególnej firmy, jak i cala logistyka, muszą posiąść umiejętność rozumienia i reagowania na wydarzenia globalne i, w zależności od specyfiki realizowanych działań, wykorzystywać właściwą kombinację technologii.
Współczesny rozwój technologiczny i budowane na jego podstawie koncepcje, takie jak: Industry 4.0, Logistyka 4.0, transformacja cyfrowa i inne, radykalnie zmieniają spo-sób tworzenia wartości i spospo-sób konkurowania. Zmienił się i nadal się zmienia spospo-sób podejmowania decyzji i współdziałania, który w coraz większym stopniu będzie podle-gał procesom cyfryzacji i automatyzacji. Technologia zmienia komunikację zewnętrzną i wewnętrzną przedsiębiorstw, proces produkcji oraz przeobraża oczekiwania klientów. Tempo i skala tych zmian powoduje konieczność przeprowadzenie wielu analiz i badań, których celem jest wskazanie najlepszych rozwiązań oraz sposobów ich imple-mentacji. Wiele współczesnych organizacji logistycznych nie wie jak wdrażać konkretne rozwiązania i w jakiej kolejności, a także jak budować systemy oraz relacje w cyfrowym świecie. Pokazuje to, że w procesie podejmowania strategicznych decyzji w firmach lo-gistycznych, kluczowym elementem staje się szeroka wiedza na temat możliwych roz-wiązań organizacyjnych czy też technologicznych.
Odpowiedzią na przedstawiony problem są artykuły zamieszczone w tym opraco-waniu. Ich różnorodne spojrzenie na problemy nurtujące współczesną, jak i perspekty-wiczną logistykę jest nie tylko inspirującym, ale też ciekawym i uzasadnionym naukowo ujęciem wspomnianych wcześniej problemów. Zamieszczone materiały są odpowiedzią na często definiowane przez praktyków pytanie: Co powinienem wiedzieć zanim zdecy-duje się wdrożyć dane rozwiązanie czy technologie w swojej firmie?
Zakres obszarów tematycznych w logistyce podlega nieustannej dynamizacji zmian, a zarazem nabiera istotnego znaczenia dla procesów logistycznych. Instrumenty, meto-dy i modele logistyczne przenikają struktury funkcjonalne przedsiębiorstw, doprowa-dzając do integracji wszystkich działań w celu efektywnego realizowania zadań w pro-cesach logistycznych. Najważniejszym dla obszaru oddziaływania logistyki jest proces
przepływu materiałowego oraz towarzysząca im informacja. Złożoność wszystkich proce-sów logistycznych determinuje konieczność ścisłej koordynacji wielu zadań i dążenie do efektywnego zarządzania procesami. Obszary procesów logistycznych są nieustanną pod-stawą rozważań dla wielu specjalistów, naukowców i praktyków. Teoretycy, jak i praktycy nieustannie wymieniają swoje doświadczenia, przeprowadzają badania i dyskutują nad znaczeniem, skutecznością i efektywnością logistyki stojącej wobec wyzwań przyszłości.
Oddajemy czytelnikowi monografię prezentującą szerokie spektrum aspektów dzia-łań logistycznych, które wskazuje na interdyscyplinarność logistyki. Publikacja ta jest efek-tem pracy naukowców, jak i praktyków z wielu ośrodków naukowych. Artykuły składające się na niniejszą monografię przedstawiają czytelnikowi zagadnienia logistyki miejskiej, logistyki przedsiębiorstw, systemów transportowych oraz zagadnienia z zarządzania lo-gistycznego. Wiedza, którą zawiera to opracowanie nie tylko przybliża i porządkuje wiele istotnych dla logistyki zagadnień, ale również stanowi przyczynek do dalszych badań lub implantacji prezentowanych rozwiązań w praktyce. Doceniając wysiłek twórców prezen-towanych materiałów, pamiętać należy, że stanowią one ich autorskie spojrzenie.
Prezentowany materiał ukazuje zagadnienia, mogące stanowić podstawę do dal-szych dyskusji oraz prezentuje praktyczne aspekty ich zastosowań w procesach logi-stycznych. Redaktorzy monografii bardzo dziękują wszystkich Autorom za naukowy wkład oraz tematy do rozważań w kolejnych publikacjach.
Zrównoważone zarządzanie
łańcuchami dostaw
Katarzyna Nikorowicz-Zatorska |
k.zatorska@wsosp.plWyższa Szkoła Oficerska Sił Powietrznych w Dęblinie, Wydział Bezpieczeństwa Narodowego i Logistyki, Instytut Logistyki i Organizacji Transportu
Analysis and Use of the Concept of Noise Zoning Plan
(NZP) for the Lodz Airport. A Case Study
Abstract: Recently the aviation industry is growing faster than it was forecasted. Most of
Polish airport have their origins at the beginning of the 20th century and most of them were constructed for military purposes. Over the time the airports were developed within the given area without anticipating the limited urban space. Presently, the spatial development of most of the airports is heavily hindered due to dynamic expansion of urban develop-ment. It has reached the point when both the airport and the city limit the territorial expan-sion of each other. To ensure the sustainable development the new approach needs to be adopted. The Lodz Airport is located in the suburban part of the city within 10 minutes wal-king distance to reach the nearest housings. The low number of aircraft operations silences the cohabitation problem. Nevertheless, the resolution of this problem cannot be put on hold any longer, mainly because of the fact that redesign of the urban space is a time and cost consuming process. The study of possible solutions for the Lodz Airport, recommen-ded by ICAO, indicate the Brazilian Noise Zoning Plan as the most realistic and possible to adapt. The article presents the analysis of the NZP concept adaptation for the Lodz Airport.
Key words: airport, airport development, land-use management, noise zoning plan The place and the role of an airport on the market in the modern world has changed. Air-ports are no longer the places where planes just land and take off. The increasing need for the fully operating airport in main Polish cities has recently become urgent. However, air-port development process, apart from the promise of economic and cultural growth, brings many inconveniences to local communities, such as pollution, noise emission, and the gro-und traffic. Each of these factors is equally important for human health and sustainable de-velopment of the city. Nevertheless, the noise factor seems to be the most often commonly discussed as the most visible disadvantage of the airport presence in the urban structure.
ICAO, as a world leading organization in terms of the aviation industry, recommen-ded the infrastructural solutions to reduce the impact of the noise factor, as well as the pollution, for the population living in the vicinity of the airport.
Among the solutions recommended by ICAO, published in Airport Planning Manual Part 2. Land use and environmental control, the noise planning zone (NPZ) seems to be the most useful.
The present paper will discuss the adoption of NPZ model for the Lodz Airport. The calculation has been carried out and the real contour of the basic noise zoning plan will be presented, as well the development prospect for the Lodz Airport.
ICAO guidance for airport planning and land use
International Civil Aviation Organization (ICAO), as the most important and the most in-fluential non-government organization, dictates trends for the world aviation commu-nity. Created in 2002 The European Aviation Safety Agency (EASA) has less operational experience then ICAO and basically, it mimics ICAO’s in its activities and research. Enough to state that essentially EASA is secondary to ICAO regarding the majority of the aviation industry. However, Poland as a European Union (EU) member is obliged to follow EASA as well as ICAO guidance.
Based on the ICAO’s recommendation, research and studies, respective countries pass their aviation laws and organize the aviation infrastructure. In many cases the delay is sig-nificant which causes the technological and operational gaps for the whole flying industry. Aviation became a significant branch of industry during the nineties of the last cen-tury. Before that time, most of the flying activities were considered as sport or luxury [Regan 2010]. The beginning of the 21st century brought a qualitative change for general aviation which became more popular and available for bigger part of the developed co-untries population [EASA 2003]. The technological revolution of the nineties resulted in mass production of less expensive jet engines which were quieter, more economical and had the wider reach range [Camastral 2014]. Globalization also impacted middle-class minds – people became more curious about the world and ready to explore it [Whe-eler 2005]. Demand and supply for air services were growing in parallel. The increase in the number of air operations tightened the sky area, thereupon airline operators were forced to unite in order to equally divide the skyspace and avoid the danger of financial losses [Upham et al. 2003]. ICAO published for the first time in 1999 Airport Planning Ma-nual Part 2. Land use and environmental control where the issue of land management for the aviation activities was stressed in the most distinctive way. The purpose of this manual is to provide guidance material on land-use planning in the vicinity of airports
and on environmental control regarding airport development and operations. Original-ly, the Special Meeting on Aircraft Noise in the Vicinity of Aerodromes held in 1969 was the base for the ICAO’s issue development. It incorporates guidance material on airport environmental aspects as recommended by the Eight Air Navigation Conference from 1974 [ICAO 2002].
In 2002 ICAO issued the third edition of the mentioned document which already re-quires being updated. The main purpose of this document is to ensure the safety of aircraft operations by pointing the leads for airports and town planners.
Best practices to be applied
The most problematic part of airport planning process is to find a proper location which will accommodate the safety reasons with local population needs. Noise produced by airplanes is widely discussed as the most annoying factor for surrounding population [Fidell & Silvati 1991]. Various research studies show that among many hazards and in-conveniences related to airport vicinity, the most commonly discussed is the noise factor. Furthermore, the population is mostly unaware that exposition to noise produced by aircraft is also related to higher blood pressure, heart rate variability and affects sleep quality [Aydin & Kaltenbach 2007; Brook et al. 2010; Babisch & Van Kamp 2009; Huss et al. 2010]. The ground movement is also often ignored as a major component occurring in the area of the airport [Schwab et al. 1985; Short et al. 2014; Weiszer, Chen & Stewart 2015]. The air pollution argument became recently more significant among the others [Evrard 2016; Hudda & Fruin 2016; Masiol & Harrison 2014], however, it takes the second position on the list, after the noise factor.
To better understand aviation industry characteristics in function of airport localiza-tion, ICAO developed the idea of noise zoning plan (NZP). The purpose of this calcula-tion is to ensure the compatibility of the urban and airport planning processes [Cohen & Coughlin 2008].
This model of area planning seems to be the easiest to apply in the already deve-loped and inhabited area. In the function of time, current property functions could be gradually modified by extinguishing local area facilities development and provoke an outflow of population to other city locations. Even if it is a time-consuming process, it seems to be more natural, realistic and less capital-intensive method.
In order to calculate and precisely define noise contours for Basic Noise Zoning (BNZ) the parameters and dimensions outlined in the Tables 2 and 3 must be applied.
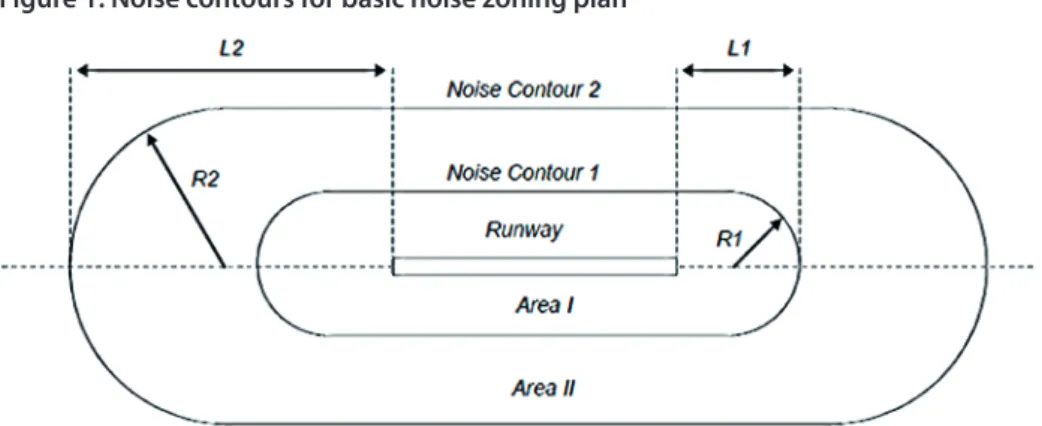
Figure 1. Noise contours for basic noise zoning plan
Source: ICAO 2002: A1 – 7
The central point of this concept is the runway which determines the size of who-le BNZ figure. Construction of the runway determines types of aircraft operating on it, assuming a yearly number of flying operations and the potential development of the airport [Nallinger 1962; Brandt 1962]. It also affects the surrounding landscape and the soil use by adopting technological solutions to adjust it or improve it [Goldman et al. 2013; Goodman et al. 2002; Douglas & Lawson 2003]. A runway is surrounded by two rings: Area I and Area II. Mostly, these two areas cross the physical borders of the airport and cover the surrounding areas. ICAO recommends land use types for Area I and Area II, which is discussed in Table 1.
Table 1. Land use restrictions for noise zoning
Areas defined by
noise contours Basic noise zoning plan Specific noise zoning plan
Area I
Only agricultural and industrial uses and outdoor recreational activities are permitted
Housing and public facilities (schools or hospitals) are not permitted
Industrial buildings must be insulated
Industrial and certain commercial buildings may be permitted if buildings are insulated
Outdoor recreational activities are permitted
Areas defined by
noise contours Basic noise zoning plan Specific noise zoning plan
Area II
Housing and public facilities (schools or hospitals) are not permitted
Public facilities (schools or hospitals) are not permitted
Agricultural, commercial and industrial use are considered adequate and acceptable
Housing may be permitted in certain cases and only if noise reduction can be ensured by adequate sound insulation Industrial and commercial use is permitted if offices have adequaate soundproofing Source: own study based on ICAO 2002: A1 – 6
Land use restrictions for noise zoning by ICAO coincide with the catalog of advantages and disadvantages regarding the localization of the property in the airport vicinity presen-ted above and give a clear idea what type of properties can be locapresen-ted in the vicinity of the airport. However, in the case of BNZ, they took shape of outlines. Adopting the BNZ model requires following these specific recommendations to get the desired effect.
Another variable in BNZ model are the values of L1, L2, R1, and R2 (see Figure 1) which depend on a category of a runway and the density of scheduled traffic and size of aircraft. Table 2. Runway categories for noise zoning plans
Category Runway purpose Air traffic density description 1 Runway for high-density scheduled traffic
of large aircraft
Density of scheduled traffic of large aircrafts is equal to or higher than 6 000 annual movements or night operations exceed two movements
2 Runway for medium-density scheduled traffic of large aircraft
Density of scheduled traffic of large aircrafts is lower than 6 000 annual movements and night operations do not exceed two movements
Density of scheduled traffic of large aircrafts is equal to or higher than 3 600 and lower than 6 000 annual movements; no night operations
3 Runway for low-density scheduled traffic of large aircraft
Density of scheduled traffic of large aircrafts is lower than 3 600 annual movements and no night operations
Category Runway purpose Air traffic density description 4 Runway for high-density scheduled traffic
of medium aircraft
Density of scheduled traffic of medium aircrafts is equal to or higher than 2 000 annual movements or night operations exceed four movements
5 Runway for low-density scheduled traffic of medium aircraft
Density of scheduled traffic of medium aircrafts is lower than 2 000 annual movements or night operations do not exceed four movements
6 Runway for non-scheduled traffic of small aircraft
Any density of non-scheduled traffic of small aircraft
Source: own study based on ICAO 2002: A1-6 – A1-7
The modeling of airport operations has advanced significantly over the past 30 years. However, lack of integration between “landside” elements of the airport (passenger ter-minal, baggage handling, and ground access) and of “airside” elements (runways, taxi-ways, aprons, aircraft stands, etc.) still can be observed and provokes miscalculations of airport operations and their efficiency. Ultimately, managers and planners order changes in one part of the airport without understanding the implications of these changes for the other part [Andreatta et al. 1999]. Airport performance comes down to two aspects: congestion process and costs. At present, productive efficiency measurement comes to selecting an airport’s optimal sequence of runway configurations and determining the optimal balance of arrivals and departures to be served at any moment [Forsyth 2007; Bertsimas, Frankovich & Odoni 2011].
To optimize the productive efficiency of the airport and to accommodate it with re-spect for local population needs, the values of L1, L2, R1, and R2 have been established, see Table 3.
Table 3. Airport noise contours for basic noise zoning plan in Brazil
Noise contour Runway category L1 (m) L2 (m) R1 (m) R2 (m) Area I 2 1 500 - 240 -3 and 4 500 - 180 -5 and 6 300 - 100 -Area II 2 - 2 500 - 600 3 and 4 - 1 200 - 400 5 and 6 - 500 - 200
Among many examples presented by ICAO, the Brazilian solution seems to be the most relevant for Polish urban planning processes. It takes into consideration the cate-gory type of runway according to the number of scheduled aircraft operations [Isenberg, Payne, & Muia 2017]. Knowing, that most of the Polish airports are rebuilt and moderni-zed (on the base of the already existing mostly military or sports airport), it seems to be more justified from the economic point of view to transforming the airports surrounding in a longer period of time: slowly but consistently. Size adjustment of the basic noise zoning plan in accordance with the purpose of use and economic growth of the region guarantee a harmonious local development.
On the other side, local authorities can help minimize the size of the population af-fected by aircraft noise by introducing more restrictive land-use zoning around airports. This policy was applied with success in Germany. Local government in Hamburg prohi-bited the construction of new homes in areas that are exposed to high levels of airport noise [Niemeier 2013]. The same solution was introduced in few states in USA (Boeing n.d.). In Paris, near the Charles de Gaulle Airport in France, some form of noise disclosure requirement was adopted in real estate transactions [Gillen 2008].
The system of penalties and incentives may find use in this case. Airport managers can encourage aircraft operators to take additional steps to reduce noise emissions, over and above the established noise abatement measures. This solution was adopted by Se-atac Airport in Seattle and Vancouver International Airport. In both cases, airport mana-gement boards have prepared unique incentives programs, where a reward or publicity was provided to the airline company that operates the quietest fleet mix and complies with noise abatement procedures [Vader 2007].
The opposite approach was taken by many of the European countries. Countries such as France, Germany, Spain, Italy and the United Kingdom (UK) penalize airlines that operate noisier aircraft by charging higher fees for them to use the airport (Boeing n.d.).
Another example of managing the aircraft noise was presented by operators of air-ports in Paris, Frankfurt, Narita, and Chicago where the facilities generate extreme noise for the surrounding populations: they invested in insulation programs for neighboring residential and public building [Padova 2013]. The practice of home purchase or reloca-tion was also implemented in Germany and the UK [Vader 2007].
According to the observed practice in Polish aviation system, the basic solution was worked out under the shape of special zones in the vicinity of the busiest airports. Not all of 14 of Polish controlled airports have a protection zone around the airport. So far only civil airports in Gdańsk, Poznań, and Warsaw are surrounded by special protection zones.
As it was discussed in the previous part of this paper, the biggest inconvenience for the environment of the local community is noise emission [Cohen & Coughlin 2008].
Responding to the growing wave of local residents dissatisfaction and in order to work out a common consensus in that matter, the areas of limited use were created under the Act of 27 April 2007 on environmental protection law [Journal of Laws of 2013, pos. 1232 as amended].
Limited Area of Use (OOU in Polish) is created under art. 135 of the above-mentio-ned act and constitute an act of local law. The resolution comes into force after fourteen days of its publication. It specifies area boundaries, land use restrictions, technical requi-rements for buildings and the way in which areas are used.
In addition, article 135 of the environmental protection law provides: ‘If the ecologi-cal review or project environmental impact assessment required by the Act of 3 October 2008 on the provision of environmental information and its protection, society partici-pation in environmental protection and environmental impact assessments or post-ana-lysis shows that, despite the adoption of available technical solutions, technological and organizational standards cannot be complied outside the plant or another facility as; wa-ste water treatment plants, municipal wawa-ste disposal sites, composting yards, transport routes, airports, power lines and power plants, radiocommunication, radionavigation and radiolocation facilities, the limited area of use should be created’.
Restrictions on the use of real estate are different for individual OOUs. However, in the area of limited use, it is forbidden to build new hospitals, nursing homes, and buildings for a permanent or temporary stay of children and youth. It is forbidden to build single-family houses or to change the building’s functions. Newly designed buildings are required to have the adequate acoustic insulation of the walls [Czajka-Marchlewicz 2014].
The procedure to claim the compensation for damage caused by the establishment of a limited area of use is described in the art. 129 of Law on environmental protection in connection with art. 136 paragraph 2 of the same law act. On this point, the Supreme Court also ruled in its judgment of 25 February 2009, II CSK 546/08, Biul. SN No. 7/2009, MoP No. 12/2010.
Due to the location of the property in the OOU, the landlord may apply for a redemp-tion of the property, compensaa redemp-tion for the loss of value of the property (due to restric-tions on their use and restricrestric-tions on their extension) or claims for improvement of the acoustic comfort of the occupied building [Czajka-Marchlewicz 2014].
In practice, only one airport in Lodz province – Lask Military Airport – is covered by the OOU zone pursuant to Resolution No. XXIX / 379/16 of the Lodz Regional Parliament due to the fact that military aircraft produce much more noise than passenger plane, which is far beyond the established noise limits. An OUU zone has also been created for the S8 expressway which runs near the Lodz Airport.
Despite that, it is a modest solution for the Polish aviation industry and it does not fully apply the modern technology, it can be considered as a milestone for reconciliation between the airplane and public space. The solutions presented above should be consi-dered as workarounds and the more holistic protection system should be applied to the areas in the vicinity of the airports. The NZP is a real example how the local authorities can shape the airport surroundings in order to provide more sustainable development for the airport cities.
NZP for Lodz Airport
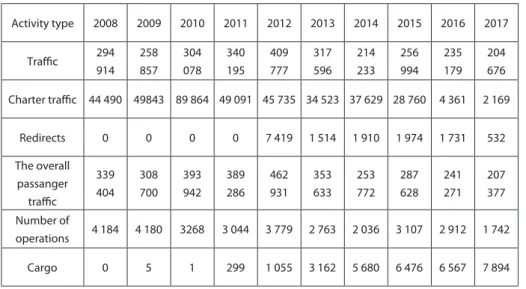
Regarding the ICAO calculations, Lodz Airport with its latest statistics of number of ope-rations equals to 1 476 in 2017 has runway category 4, according to the NPZ concept. Table 4. Lodz Airport Statistics in 2017
Activity type 2008 2009 2010 2011 2012 2013 2014 2015 2016 2017 Traffic 294 914 258 857 304 078 340 195 409 777 317 596 214 233 256 994 235 179 204 676 Charter traffic 44 490 49843 89 864 49 091 45 735 34 523 37 629 28 760 4 361 2 169 Redirects 0 0 0 0 7 419 1 514 1 910 1 974 1 731 532 The overall passanger traffic 339 404 308 700 393 942 389 286 462 931 353 633 253 772 287 628 241 271 207 377 Number of operations 4 184 4 180 3268 3 044 3 779 2 763 2 036 3 107 2 912 1 742 Cargo 0 5 1 299 1 055 3 162 5 680 6 476 6 567 7 894
Source: Lodz Airport Statistics, www.lotnisko.lodz.pl.
It is worth mentioning that currently, Lodz Airport operates two regulars carriers, that is Ryanair and Lufthansa. Summer seasons bring more charter traffic. At present, the weekly number of Ryanair and Lufthansa operations equals 36 (The Lodz Airport website), which was deliberately hidden in its official statistics. These 18 landings and 18 takes-offs are not a fixed data because the flying timetable varies depending on the time of year. Ryanair operates only with large aircraft (type: Boeing 737-800 ). The remaining part of the number of operations are charter flights, and mostly, training flights which
are operated with small aircraft (type: Cessna, Diamond, Tecnam, Piper). At the Lodz Air-port headquarters there are two flying schools: Bartolini Air and Aeroklub Lodzki who are the main users of the airport. For comparison: Boeing 737 consumes around 500 liters of fuel per hour while Cessna only 24 liters per hour. Accurate calculations do not matter in this case – noise factor, ground movement or air pollution determinant have a very low impact for Lodz.
Technologically, Lodz airport is very modern and was designed to host a much larger number of aircrafts, however, the surrounding area is not adapted to withstand more busy air traffic.
As it was stated in the previous part of this paper, Lodz Airport, according to the run-way categories for noise zoning plans, at present has runthe run-way category 4.
Using the parameters presented in Table 3, the dimension of the noise zoning plan for Lodz Airport can be calculated. Knowing that the length of the runway equals 2500 m, it is possible to determinate precisely the values for L1, L2, R1, and R2. The exact calcu-lations are presented in Table 5. The Area I with the L1 equals to 500 m and R1 equals to 180 m should have 3500 m in length and 360 m wide. The Area II with the L2 equals to 1200 m and R2 equals to 400 m should have 4900 m in length and 800 m wide.
Table 5. The calculation of the NZP dimensions for the Lodz Airport
Length of the figure Width of the figure
Area I 2 x L1 + Runway = 2 x 500 m + 2500 m = 3500 m 2 x R1 m = 2 x 180 m = 360 m Area II 2 x L2 + Runway = 2 x 1200 m + 2500 m = 4900 m 2 x R2 m = 2 x 400 m = 800 m Source: own study.
For the average estimates of the present number of aircrafts operations and the cal-culation presented in Table 5, the airport noise contours for basic noise zoning plan in Lodz should be adopted as it is presented in the Figure 2.
Figure 2. Airport noise contours for basic noise zoning planning in Lodz
Source: www.skyscrapercity.com.
Red marked area on the above map represents Area I and yellow color shows Area II of Airport noise contours for basic noise zoning plan in Lodz. The purple color points the approach for landing. Triangle with exclamation mark shows the main intersection in Lodz: Włókniarzy and Mickiewicza avenues, which might be considered as human acti-vity cluster due to a large number of vehicles present there on daily basis. Subsequent points indicate respectively flying obstacles:
1. Arch-see 2. BRE Tower
3. Land elevation Rudzka Gora
4. Power plant EC – 4 (presence of industrial chimneys) 5. Power plant EC – 2 (presence of industrial chimneys) 6. Residential area Retkinia (skyscrapers)
In the case of Lodz Airport a curious situation can be observed: basic noise zoning plan covers the residential area of two satellite cities (Konstantynów Lódzki and Pabia-nice) and the biggest housing area in Lodz-Retkinia district. This situation contradicts international standards and Polish law in the matter of airport location. However, the low number of aircraft operations is endurable for the local community and the risk of major air incident is statistically insignificant.
Findings
Firstly, it needs to be highlighted that it is impossible to find the solution which will be universal for all type of airports. Every single concept has to be adjusted to the local needs and reality.
The noise contours are based on mathematical models and do not represent the real boundary of the annoyance. For this reason, the presence of the forest in Area I or Area II could be considered as a sound barrier, while the presence of ant type of reservoirs could work as a sound amplifier which will shift the boundaries of NZP figure.
Secondly, the model has its origins in 1982 and has been already updated a few times in 1984, 1986 and for the last time in 1995 [Neto 2010]. Nevertheless, the progressing development of the aviation industry requires more often actualizations.
This model has been established for more than 550 Brazilian airports. The Depart-ment of Civil Aviation (ANAC) developed the NPZnet, a computer system tool which is accessible for everyone who has access to an internet browser. The NPZnet shows the status of the areas located around the airports. In practice, the Brazilian ANAC is respon-sible to determine the function of the areas in the vicinity of the airport before being approved by the local authorities.
A user can see the noise contours plotted on the map. It gives an opportunity to re-cognize the position of the given estate in function of the location of the airport, which might help to recognize the restrictions imposed on the area. The NZPnet guides users on further steps that need to be undertaken when submitting the development plan to local authorities. This program also provides the information regarding area develop-ment possibilities, as well as restrictions on building insulation requiredevelop-ments. This infor-matics tool introduced in Brazil should increase the awareness of the local population of the restrictions regarding the presence of the airport. In Lodz, there are no acoustic maps pointing to the noisiest areas of the city.
The local population is mostly unaware of the factual values of the noise emission ge-nerated by the operating aircrafts. It rather comes to two categories describing the airport presence: annoying or acceptable. It seems like real estate buyers do not enumerate the
presence of the airport in the vicinity of their future estate as the leading factor in the decision-making process. Since 1993, many new buildings were constructed and inhabi-ted in the Lodz Airport area.
On the other side, the existence of restrictions on land use around airports generates several conflicts of interest. Mostly, local population does not enthusiastically follow the changes in the urban planning process. Rather, they keep aside and ignore the situa-tion [Aghajani 2016; Neto 2010].
In the case of Lodz Airport, the number of aircraft operation is too low to arouse the protests of the local population. However, the airport management is actively seeking for aircraft operation development opportunities. The airport is perceived as a landscape element rather than a dynamically developing enterprise. As long as it does not increase its operations, the local communities will not be overmuch bothered by its presence.
It can be assumed that the local population will not object to the airport opera-tion of Lodz Airport as long as the airport will keep the number of the operaopera-tions at current or similar to the current levels. In this situation, none of the costly improve-ments are needed. However, the dynamics of the aviation market are not stable and the changes are usually abrupt. The proper size of the changes is difficult to estimate in advance. Knowing the development pattern of the aviation industry it is possible to say that anticipating future events is the only right way to proceed. At present, the NZP can be developed over a longer period of time, due to advanced urbanization processes in the vicinity of the Lodz Airport. With this approach, it can be concluded that only the wise and long-term planning can protect the local communities from pollution and noise emission.
References
Aghajani Y., Abbaspour M., Mohammadi A., Aghajani D., Ahmadi A. (2016), Resilient cities, a key solution to safeguard the environment, “Scientia Iranica”, 23(5), pp. 2067–2076.
Andreatta G., Brunetta L., Odoni A.R., Righi L., Stamatopoulos M.A., Zografos K.G. (1999),
A set of approximate and compatible models for airport strategic planning on airside and on landsi-de, “Air Traffic Control Quarterly”, 7(4), pp. 291–317.
Aydin Y., Kaltenbach M. (2007), Noise perception, heart rate and blood pressure in relation to aircraft noise in the vicinity of the Frankfurt airport, “Clinical Research in Cardiology”, 96(6),
Babisch W., Van Kamp I. (2009), Exposure-response relationship of the association between aircraft noise and the risk of hypertension, “Noise and Health”, 11(44), p. 161.
Bertsimas D., Frankovich M., Odoni A. (2011), Optimal selection of airport runway
configura-tions, “Operations Research”, 59(6), pp. 1407–1419.
Boeing (n.d.), Commercial Airplanes: Airport Noise and Emissions Regulations [online], http://www. boeing.com/commercial/noise/, access: 30.10.2017.
Brandt J.E. (1962), Airfield runway construction and design, U.S. Patent No 3,061,245, 1962,
Publi-cation number: US3061245 A, European ClassifiPubli-cation: B64F1/00.
Brook R.D., Rajagopalan S., Pope C.A., Brook J.R., Bhatnagar A., Diez-Roux A.V., Pe-ters A. (2010), Particulate matter air pollution and cardiovascular disease, “Circulation”, 121(21),
pp. 2331–2378.
Camastral M.R. (2014), Business Continuity Management in Airports: Securing Continuity in the Face of Crisis, PhD dissertation, unpublished, Queensland University of Technology.
Cohen J.P., Coughlin C.C. (2008), Spatial hedonic models of airport noise, proximity, and housing prices, “Journal of Regional Science”, 48.5.
Czajka-Marchlewicz B., 07.04.14, Za ustanowienie obszaru ograniczonego użytkowania należy się rekompensata [online],
http://www.budownictwo.abc.com.pl/czytaj/-/artykul/za-ustanowie-nie-obszaru-ograniczonego-uzytkowania-nalezy-sie-rekompensata, access: 7.09.2017. Douglas I., Lawson N. (2003), Airport construction: materials use and geomorphic change,
“Jour-nal of Air Transport Management”, 9(3), pp. 177–185.
Evrard A.S., Bouaoun L., Lefevre M., Champelovier P., Lambert J., Laumon B. (2016), Does air pollution modify the impact of aircraft noise on mortality from cardiovascular disease? Results of an ecological study in France, In TAP 2016, 21st International Transport and Air Pollution Conference,
pp. 6-p.
Fidell S., Silvati L. (1991), An assessment of the effect of residential acoustic insulation on
preva-lence of annoyance in an airport community, “The Journal of the Acoustical Society of America”,
Forsyth P. (2007), Models of airport performance [in:] D.A. Hensher, K.J. Button (eds.), Handbook
of Transport Modelling: 2nd Edition, Emerald Group Publishing Limited, Bingley, UK, pp. 715–727.
Gillen D. (2008), Airport governance and regulation: The evolution over three decades of aviation
system reform, Workshop on Transport Economics: ‘Models of Airport Ownership and
Governan-ce’, October 2008, FEDEA-Abertis.
Goldman R., Team I.C.U.S.C. (2013), A-CDM in New York KJFK runway construction and impact on
operations, presentation made at the Advanced ATM Techniques Symposium and Workshops in
November 2013, New York.
Goodman S.P., Bekheet W., Hassan Y., El Halim A.A. (2002, May), Rapid in-situ shear testing of
asphalt pavements for runway construction quality control and assurance, Proceedings 2002 FAA
airport technology transfer conference in May 2002, Atlantic City.
Hudda N., Fruin S.A. (2016), International airport impacts to air quality: size and related pro-perties of large increases in ultrafine particle number concentrations, “Environmental science &
technology”, 50(7), pp. 3362–3370.
Huss A., Spoerri A., Egger M., Röösli M., Swiss National Cohort Study Group (2010), Aircraft noise, air pollution, and mortality from myocardial infarction, “Epidemiology”, 21(6), pp. 829–836. International Civil Aviation Organization (2002), Airport Planning Manual Part 2. Land use and
environmental control. Doc 9184, Third Edition. Available from: https://www.icao.int/Meetings/
EnvironmentalWorkshops/Documents/Env-Seminars-Lima-Mexico/Lima/12b_ICAO_Airport-PlanningManual-pt2.pdf [accessed: 10.09.2017]
Isenberg N., Payne B., Muia M. (2017), General Aviation Land Use Planning, presentation made
at Purdue Road School in 2017, Purdue University.
Lodz Airport website, http://www.airport.lodz.pl/pl/statystyki.html, access: 18.10.2017.
Masiol M., Harrison R.M. (2014), Aircraft engine exhaust emissions and other airport-related contributions to ambient air pollution: a review, “Atmospheric Environment”, 95, pp. 409–455.
Nallinger F.K.H. (1962), Runway construction, U.S. Patent No. 3,023,986. Washington, DC: U.S.
Niemeier H.M. (2013), Expanding airport capacity under constraints in large urban areas: The Ger-man experience, “International Transport Forum Discussion Paper”, 2013-4.
Neto A.G. (2010), Análise do ruído aeronáutico no entorno do aeroporto de São José dos Campos,
doctoral dissertation presented at Universidade de Taubaté, Taubaté, São Paulo, Brasil.
Padova A. (2013), Aircraft Noise Management in Canada, Library of Parliament.
Regan P. (2010), The relationships between entrepreneurial orientation, organization structure and
ownership in the European airport industry, University College Dublin Press, Blackrock.
Schwab C.E., Rost D.P., Hackenberg W., Holcombe P. (1985), Method and apparatus for monito-ring vehicle ground movement in the vicinity of an airport, U.S. Patent No. 4,516,125, Washington,
DC: U.S. Patent and Trademark Office.
Short N., LeBlanc A.M., Sladen W., Oldenborger G., Mathon-Dufour V., Brisco B. (2014), RA-DARSAT-2 D-InSAR for ground displacement in permafrost terrain, validation from Iqaluit Airport, Baffin Island, Canada, Remote Sensing of Environment, 141, pp. 40–51.
The skyscraper city, http://www.skyscrapercity.com/showthread.php?t=453606&page=17, ac-cess: 10.09.2017.
Upham P., Thomas C., Gillingwater D., Raper D. (2003), Environmental capacity and airport operations: current issues and future prospects, “Journal of Air Transport Management”, 9(3),
pp. 145–151.
Weiszer M., Chen J., Stewart P. (2015, September), Preference-based evolutionary algorithm for airport runway scheduling and ground movement optimization, conference materials from
Intel-ligent Transportation Systems (ITSC), 2015 IEEE 18th International Conference on September 2015, pp. 2078–2083.
Vader R. (2007), Noise Annoyance Mitigation at Airports by Non-Acoustic Measures: Inventory
and Initial Analysis, report prepared for Air Traffic Control, Vader Management, Netherlands,
Amsterdam.
Wheeler J. (2005), An independent review of airport security and policing for the government of Australia, Department of Communications, Canbeera.
Damian Ostrowski |
damian.ostrowski@wsb.wroclaw.pl Wyższa Szkoła Bankowa, Wydział Finansów i ZarządzaniaAgnieszka Piasecka-Głuszak
Uniwersytet Ekonomiczny we Wrocławiu
Zaangażowanie pracowników w realizację metody 5S
w przedsiębiorstwie produkcyjnym – wyniki badań
ankietowych
Employee Engagement in The Implementation
of The 5S Method in Production Enterprises –
Research Results
Abstract: The 5S method allows you to organize well and keep the workstation in every
sphere of the organization’s operations. It influences, on the one hand, better and constant quality, clarification of work instructions, elimination of unnecessary activities, reduces unnecessary movements, increases employee productivity, work safety and, on the other hand, affects customer satisfaction. The aim of the article is to present the results of a survey on the level of knowledge, involvement of production and administrative employees in the practical implementation of the 5S method in a production enterprise. The study consists of two parts: theoretical and empirical. The first presents the concept, characteristics of the 5S method, main benefits. The second part – empirical presents the results of surveys, which identified the employees’ approach to the method used in their organization 5, which al-lows to achieve many benefits.
Key words: 5S, kaizen, improvement, enterprises
Wprowadzenie
Metoda 5S jest to metoda kontroli wizualnej, która polega na stworzeniu, utrzymaniu, odpowiedniej organizacji i ciągłym doskonaleniu stanowiska pracy, tak aby było ono
czyste, uporządkowane i odpowiednio zorganizowane. Nie ma znaczenia, jaki jest cha-rakter pracy. 5S dotyczy zarówno pracowników administracyjnych – praca biurowa, jak i pracowników produkcyjnych – praca fizyczna. Wprowadzenie zasad funkcjonowania organizacji opartych na 5S nie wymaga długiego czasu, a może dać olbrzymie korzyści. Przestrzeganie metody 5S w miejscu pracy gwarantuje odpowiednią organizację, która między innymi wpływa na: redukcję kosztów, zapobiega powstawaniu strat i ubytków, ułatwia pracę, zapewnia wysoką jakość, większą wydajność zarówno pracowników, jak i maszyn, wyższy poziom bezpieczeństwa i higieny pracy poprzez eliminowanie wypadków, poprawia samopoczucie pracowników, promuje dobre kontakty między pracownikami różnych działów, a co najważniejsze, pozwala zauważyć marnotrawstwa i daje niezbędne podstawy do dalszego doskonalenia.
Celem artykułu jest przedstawienie wyników badań ankietowych na temat stopnia znajomości metody 5S i zaangażowania pracowników produkcyjnych i administracyj-nych w praktyczną jej realizację w przedsiębiorstwie produkcyjnym. Opracowanie skła-da się z dwóch części: teoretycznej i empirycznej. Pierwsza przedstawia pojęcie, charak-terystykę metody 5S, główne korzyści i przykłady. Druga część – empiryczna, prezentuje wyniki badań ankietowych, które zidentyfikowały podejście pracowników do wykorzy-stywanej w ich organizacji metody 5S.
Pojęcie i etapy metody 5S
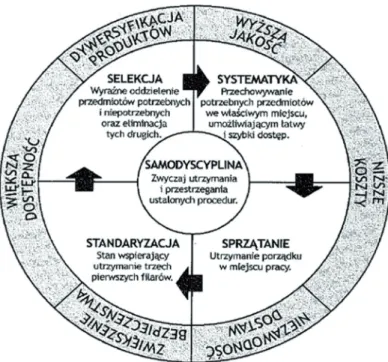
Nazwa metody 5S pochodzi od pięciu japońskich słów rozpoczynających się od litery „s”. Wszystkie elementy tworzą spójną całość i mogą być stosowane w ujęciu całościo-wym [Karaszewski 2005, s. 213], ale proces wdrażania całościo-wymaga zachowania kolejności poszczególnych elementów (rysunek 1). Jeżeli przedsiębiorstwo będzie odbiegało od metodyki wprowadzania, od zasad postępowania to niestety system ten może spotkać się z porażką. Kolejność wymusza w pewien sposób „odchudzanie”, a następnie utrzyma-nie w czystości i sprawności miejsce pracy. Dopiero bieżące stosowautrzyma-nie tworzy warunki, w których mogą powstać dobre usprawnienia techniczno-organizacyjne (kaizen) [Aluch-na, Płoszajski 2008, s. 169]. Trzy pierwsze S służą przede wszystkim wprowadzeniu, zaś kolejne służą utrzymywaniu, jak i poprawianiu obowiązujących standardów na lepsze według filozofii ciągłego doskonalenia – kaizen.
Rysunek 1. Struktura 5S
Źródło: [Kornicki, Kubik 2008, s. 14].
Pierwszy etap metody 5S to selekcja. Obejmuje ona po prostu sprzątanie tzw. śmieci oraz pozbywanie się bałaganu i niepotrzebnych przedmiotów [Kanri 2010, s. 255], zapasów, które są źródłem marnotrawstwa. Etap ten polega na wyselekcjonowa-niu i ocenie wszystkich rzeczy, urządzeń pod kątem ich przydatności na danym stano-wisku pracy czy w danym dziale przedsiębiorstwa, a następnie wyeliminowanie tych, które uznane zostają za niepotrzebne, nieprzydatne czy zbędne. Przedmioty dobrze wyselekcjonowane łatwo można będzie odnaleźć, nie tracąc czasu na codzienne po-szukiwania. Techniką stosowaną jest przeprowadzenie tak jakby inwentaryzacji posia-danych rzeczy i oznaczenie czerwonymi kartkami wszystkiego, co jest nieprzydatne, co przeszkadza bądź jest zbędne w danym momencie. Tak oznaczone przedmioty (su-rowce, materiały, produkty uboczne, przeterminowane) muszą zostać usunięte ze sta-nowiska pracy (działu). Działania te stosowane mogą być również w biurze. Wówczas pozwalają na usuwanie wszystkich widocznych rzeczy na biurku, nieużywanych do-kumentów, ale także pozwalają zrobić porządek w zaśmieconym komputerze, w któ-rym należy usunąć przestarzałe oprogramowanie, nieużywane pliki. Efektami takiego podejścia jest m.in. redukcja kosztów poprzez zmniejszenie zapasów, a także znaczne
usprawnienie stanowiska pracy poprzez lepsze wykorzystanie jego powierzchni, za-pobieganie zagubieniu przedmiotów czy ważnych dokumentów, uzyskanie większej powierzchni do pracy i lepszej ergonomii.
Drugi etap to systematyka (seiton), która jest niejako konsekwencją selekcji. Jest to ina-czej dobra organizacja przestrzeni pracownika, polegająca na ułożeniu rzeczy w sposób sy-stematyczny i właściwie uporządkowany. Wszystkie potrzebne przedmioty powinny zostać ułożone według przydatności w oznaczonym miejscu, tak aby pracownik miał do nich szybki i łatwy dostęp. Jeżeli są często używane, to muszą znajdować się w zasięgu ręki, jeżeli nie, to powinny mieć stałe, znane każdemu zainteresowanemu pracownikowi i dobrze oznaczo-ne miejsce. Taka organizacja pracy dzięki zastosowaniu w tym przypadku przede wszyst-kim technik wizualnych pozwala na większą wydajność pracowników dzięki skróceniu cza-su poszukiwania potrzebnych przedmiotów, przyczynia się tym samym do szybszego np. przezbrojenia maszyn czy w razie awarii szybszej jej naprawy. Każdy pracownik, np. dzięki tablicy cieni, wie, gdzie należy odłożyć dany przyrząd, gdzie należy go szukać, w jakim miej-scu znajduje się dany dokument. Ponadto jasno określone drogi dla pieszych, czy wózków widłowych w hali produkcyjnej przedsiębiorstwa poprawiają bezpieczeństwo pracy.
Cel trzeciego etapu, tj. sprzątania, stanowi przede wszystkim utrzymanie porząd-ku i czystości na stanowisporząd-ku pracy, a tym samym ochrona produktu, urządzeń, maszyn przed wszelkimi zanieczyszczeniami, brudem czy pyłem. Sprzątanie powinno się od-bywać codziennie, przez kilka minut, nie należy czekać, aż się zrobi większy bałagan. W każdym dniu, przeglądając, czyszcząc, malując, konserwując czy odnawiając urządze-nia, maszyny, narzędzia, można szybko wykryć wszelkie błędy bądź nieprawidłowości, które można usunąć na czas. Takie rozwiązanie pozwala zapobiec późniejszym, często kosztowniejszym problemom. Efektem tego etapu może być większe bezpieczeństwo, wyższa i stała jakość poprzez wyeliminowanie złych produktów, narzędzi, urządzeń z defektami, utrzymanie bezpiecznego, czystego stanowiska pracy. Innym pożądanym efektem jest także wyższa wydajność, która objawia się m.in. poprzez szybkie stwierdze-nie i usuwastwierdze-nie wszelkich stwierdze-nieprawidłowości, przyczyn awarii, mstwierdze-niejszą liczbę przestojów. Seiketsu, czyli standaryzacja albo, jak piszą niektórzy autorzy – schludność, to prze-de wszystkim etap, który ma na celu określić warunki ciągłego, codziennego utrzyma-nia wcześniejszych kroków. Zadaniem jest ustalenie prostych, przejrzystych procedur, standardów, instrukcji dotyczących selekcji, systematyki czy sprzątania na każdy dzień, a także niekiedy ustalenie czasu wykonywania. Utworzone standardy muszą być prze-strzegane przez każdego pracownika i na stałe powinny być włączone do jego obowiąz-ków. Proces tworzenia standardów może się odbywać z udziałem wszystkich pracowni-ków. Zalecane jest, aby pracownicy byli zaangażowani w ich tworzenie i udoskonalanie. Stworzone procedury, czytelne dla każdego, w dalszej kolejności pozwalają dokonywać
samokontroli i w razie odchyleń znaleźć przyczynę nieprawidłowości. Głównym efektem tego kroku jest, podobnie jak w poprzednich, uzyskanie wyższej jakości poprzez ujed-nolicenie procesów, lepszej przejrzystości, zrozumienia, a zatem i większej świadomości pracowników odnośnie do działań i celów podejmowanych przez organizację. Innym efektem jest standaryzacja pracy, która prowadzi do większego bezpieczeństwa, elimi-nacji wypadków, większej wydajności pracowników. To wszystko m.in. poprzez usunię-cie głównych źródeł marnotrawstwa, jak zbędne ruchy, zbędny transport, oczekiwanie, nadprodukcja, nadmierne zapasy, braki, naprawy, zła optymalizacja urządzeń itd.
Wszystkie procedury, realizowane procesy, struktury, wyniki działań pracowników, komunikaty, instrukcje, wytyczne dotyczące wykonywanej pracy, wszelkie odchylenia od normy, kluczowe dane, wszelkie informacje o wynikach, dostawach, jakości, koszach czy liczbie zgłaszanych propozycji itd. powinny zostać przedstawione w sposób zrozu-miały w formie wizualizacji, za pomocą np. tablic, znaków informacyjnych i kontrolnych czy sygnałów audiowizualnych. Dzięki wizualizacji przedsiębiorstwo może wskazać na słabe i mocne strony, jak również szanse i zagrożenia. Celem tego etapu powinna być pewność, że wszyscy pracownicy postępują zgodnie z tą samą procedurą. Istnieją np. te same nazwy przedmiotów, oznakowanie. Standaryzacja pomaga wykonywać właściwe czynności we właściwy sposób za każdym razem [Ennin, Obi 2012, s. 7], a w razie proble-mu pozwala znaleźć odchylenie od standardu.
Shitsuke to inaczej samodyscyplina lub samodoskonalenie, które ma na celu prze-strzeganie wszystkich poprzednich zasad metody 5S. Krok ten ma wyrobić w pracow-nikach i wbudować na trwałe w życie przedsiębiorstwa pewne standardy. Powinny one być konsekwentnie stosowane w każdej ze sfer działalności firmy, przez każdego pracownika. Jeżeli pewne procedury nie funkcjonują, jak należy, to trzeba wprowadzać usprawnienia w ramach ciągłego doskonalenia. Mogą je proponować wszyscy pracow-nicy niezależnie od zajmowanego stanowiska w organizacji. Zasada ta jasno określa po-stępowania zgodne z wcześniejszymi decyzjami, pozwala aktywnie uczestniczyć pra-cownikom w doskonaleniu procesów, jak również przyczynia się do poprawy stosunków międzyludzkich, komunikacji i relacji pracowników wobec przełożonych.
Metoda 5S pozwala dobrze zorganizować i utrzymać w czystości stanowisko pracy w każdej ze sfer działalności organizacji. Wpływa z jednej strony na lepszą i stałą jakość, sprecyzowanie instrukcji pracy, eliminację działań zbędnych, ogranicza zbędne ruchy, zwiększa wydajność pracowników, bezpieczeństwo pracy, a z drugiej wpływa na satys-fakcję klienta (tabela 1). Dobrze zaimplementowana przygotowuje stanowisko pracy tak, aby [Samsel 2009, s. 2]:
· było zorganizowane w sposób możliwie jak najbardziej ergonomiczny, · czas czynności do wykonania zadań na stanowisku pracy był jak najkrótszy,
· zoptymalizować wykorzystanie powierzchni i przestrzeni,
· zredukować bądź zminimalizować czas wykonania czynności niedodających warto-ści z punktu widzenia klienta,
· wszelkie wyposażenie produkcyjne, tj. maszyny i urządzenia, oraz wyposażenie biu-rowe – było jak najlepiej wykorzystane.
Według Hiroyuki Hirano głównych, ogólnych korzyści zastosowania 5S można zali-czyć [1995, s. 20-24]:
· zero przezbrojeń – co sprzyja dywersyfikacji produktu; · zero defektów, wad – co podnosi jakość;
· zero opóźnień – gwarantujące niezawodność dostaw; · zero obrażeń – co sprzyja bezpieczeństwu;
· zero awarii – co zapewnia lepszą konserwację, utrzymanie ruchu; · zero reklamacji – co zwiększa pewność i zaufanie.
Tabela 1. Charakterystyka etapów i głównych efektów metody 5S
Etapy 5S CHARAKTERYSTYKA EFEKTY
Selekcja
jap. seiri ang. sort/seperate
oddzielenie potrzebnych narzędzi, przyrządów, części i instrukcji w codziennej pracy od tych, które są niepotrzebne i usunięcie ze stanowiska pracy oraz otoczenia rzeczy niepotrzebnych i nieużywanych
● redukcja kosztów poprzez zmniejszenie zapasów i wyeliminowanie tych niepotrzebnych
● wyeliminowanie zepsutych czy zużytych przedmiotów, narzędzi mających negatywny wpływ na bezpieczeństwo pracy i jakość, ● znaczne usprawnienie stanowiska
pracy poprzez lepsze wykorzystanie powierzchni do pracy, którą można lepiej zagospodarować
● zapobieganie zgubieniu przedmiotów czy ważnych dokumentów
● uzyskanie większej powierzchni do pracy
● lepsza ergonomia
Systematyka
jap. seiton ang. set in order/
storage
porządkowanie rzeczy pozostałych po serii, polega m.in. na odpowiednim oznakowaniu oraz umieszczeniu zgodnie z zasadą „właściwe rzeczy, we właściwym miejscu i we właściwej ilości”; należy rzeczy ułożyć tak, aby zminimalizować czas i wysiłek szukania
● większa wydajność poprzez skrócenie czasu poszukiwania potrzebnych przedmiotów ● eliminacja marnotrawstwa czasu ● szybsze przezbrojenia maszyn, ● szybsze naprawy
● poprawa bezpieczeństwa ● ograniczenie wszelkich zbędnych
ruchów np. przy szukaniu materiałów, dokumentów czy przyrządów
Etapy 5S CHARAKTERYSTYKA EFEKTY Sprzątanie
jap. seiso ang. shine
porządkowanie i utrzymywanie stanowiska pracy i jego otoczenia w czystości
● większe bezpieczeństwo ● wyższa i stała jakość poprzez
wyeliminowanie złych produktów, narzędzi, urządzeń z defektami ● utrzymanie bezpiecznego, czystego
stanowiska pracy
● wyższa wydajność poprzez szybkie stwierdzenie i usuwanie wszelkich nieprawidłowości, przyczyn awarii ● mniejsza liczba przestojów ● pozytywne nastawienie
pracowników
Standaryzacja
jap. seiketsu ang. standarize
częste stosowanie, nawet codziennie
seiri, seiton i seiso, w celu utrzymania
idealnych warunków w miejscu pracy; utrzymywanie czystego i zdrowego środowiska pracy; wprowadzenie zrozumiałych standardów i procedur; przedstawienie wyników działań w formie np. wizualizacji
● wyższa jakość poprzez ujednolicenie procesów, dzięki lepszej przejrzystości, zrozumienia ● większa świadomość pracowników
odnośnie do działań i celów podejmowanych przez organizację ● standaryzacja pracy, ujednolicenie
procesu
● większe bezpieczeństwo, eliminacja wypadków
● większa wydajność pracowników, m.in. poprzez usunięcie głównych źródeł marnotrawstwa
Samodyscyplina
jap. shitsuke ang. sustain
budowanie i utrzymywanie samodyscypliny przez stosowanie się do obowiązujących norm, zarządzeń, przestrzegania 5S i dążenie do ciągłego ich doskonalenia
● jasno określone postępowanie zgodne z decyzjami ● aktywne uczestnictwo pracowników w doskonaleniu procesów ● poprawa stosunków międzyludzkich, komunikacji ● zmniejszenie liczby pomyłek
wynikających z nieuwagi Źródło: opracowanie własne.
Wyniki badań ankietowych – metoda badawcza
i grupa badawcza
Przedmiotem badań było przedsiębiorstwo produkcyjne z branży przemysłu maszynowe-go zatrudniające ponad 800 osób. Badanie przeprowadzono w marcu 2016 r. wśród pra-cowników związanych z produkcją – administracyjnych i bezpośrednio produkcyjnych, wykonujących pracę na stanowiskach roboczych. Uzyskane informacje miały charakter badań ilościowych. Celem badania było zidentyfikowanie podejścia pracowników (zaan-gażowania) w praktyczną realizację metody 5S w przedsiębiorstwie produkcyjnym. Ankie-towani zostali poproszeni o wskazanie jednej z czterech odpowiedzi, takich jak: stosuję,
rozumiem, znam i nie znam. W interpretacji danych zamieszczonych w analizie przyjęto następujące założenia dotyczące odpowiedzi, które zostały udzielone przez pracowników:
· „stosuję” – pracownik uczestniczy aktywnie w praktycznej realizacji metody 5S na swoim obszarze operacyjnym;
· „rozumiem” i „znam” – pracownik deklaruje znajomość metody 5S, jednakże nie bierze czynnego udziału (brak pełnego zaangażowania) w praktycznej realizacji me-tody 5S;
· „nie znam” – pracownik nie zna tego sformułowania, tzn. nie słyszał o metodzie 5S, nie zna jej teoretycznych ani praktycznych założeń.
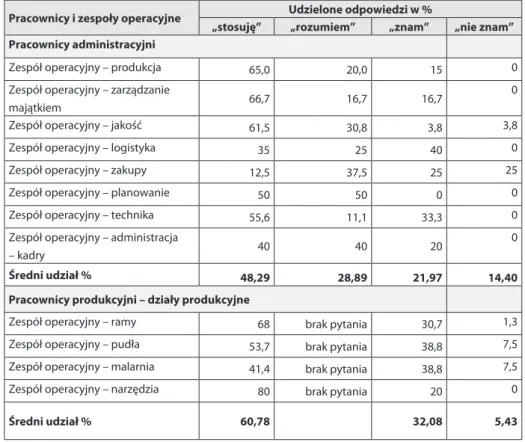
Próba badawcza docelowa obejmowała 464 pracowników pochodzących z trzyna-stu działów przedsiębiorstwa, takich jak: Dział Produkcji, Zarządzania Majątkiem, Pla-nowania, Techniki, Kadry, Ramy, Zarządzania Jakością, Logistyka, Zakupy, Komponenty, Pudła, Malarnia, Narzędzia. Na ankietę odpowiedziało 207 pracowników, co stanowiło 44% wszystkich zaklasyfikowanych (tabela 2).
Tabela 2. Ostateczna liczba pracowników poddanych badaniu
Wyszczególnienie Liczba pracowników Procent
Populacja wyjściowa, do której skierowano ankiety 464 100 Liczba ankiet zwróconych przez pracowników 207 44 Źródło: opracowanie własne na podstawie przeprowadzonych badań ankietowych.
Analiza szczegółowa wyników badań ankietowych dotycząca
zaangażowania pracowników w realizację 5S w procesie
produkcyjnym w poszczególnych zespołach operacyjnych
Grupa badawcza została podzielona na dwie podgrupy: pracownicy administracyjni i pracownicy produkcyjni. W pierwszej grupie zostało przeanalizowanych osiem zespo-łów operacyjnych – Produkcja, Zarządzanie majątkiem, Jakość, Logistyka, Zakupy, Pla-nowanie, Technika i Kadry. Druga grupa obejmowała cztery zespoły operacyjne: Ramy, Pudła, Malarnia i Narzędzia.Pracownicy administracyjni
Ponad 65% pracowników administracyjnych zaliczonych do działu Produkcja deklaru-je uczestnictwo w praktycznej realizacji metody 5S, pozostałych 35% ankietowanych wskazało, że zna i rozumie zasady stosowania tej metody, jednakże nie bierze w nich czynnego udziału.
Rysunek 2. Percepcja sformułowania metody 5S rozumiana przez pracowników: zespołu operacyjnego Produkcja
Źródło: opracowanie własne na podstawie przeprowadzonych badań ankietowych.
Blisko 70% pracowników działu Zarządzania majątkiem deklaruje aktywny udział w realizacji metody 5S, 30% pracowników nie bierze udziału w implementacji tej meto-dy, ale deklaruje znajomość tego terminu.
Rysunek 3. Percepcja sformułowania metody 5S rozumiana przez pracowników zespołu operacyjnego Zarządzanie majątkiem
Źródło: opracowanie własne na podstawie przeprowadzonych badań ankietowych.
Ponad 60% pracowników zespołu operacyjnego Jakość deklaruje, że aktywnie uczestniczy we wdrażaniu metody 5S do praktyki gospodarczej, ponad 30% deklaruje znajomość tematu, natomiast około 4% pracowników twierdzi, że nie zna tej metody.
Rysunek 4. Percepcja sformułowania metody 5S rozumiana przez pracowników: zespołu operacyjnego Jakość
Źródło: opracowanie własne na podstawie przeprowadzonych badań ankietowych.
Jedynie 35% pracowników działu Logistyka deklaruje zaangażowanie w metodę 5S w praktyce, 65% ankietowanych twierdzi, że zna termin, jednakże nie uczestniczy we wdrażaniu.
Rysunek 5. Percepcja sformułowania metody 5S rozumiana przez pracowników zespołu operacyjnego Logistyka
Źródło: opracowanie własne na podstawie przeprowadzonych badań ankietowych.
Jedynie 12% pracowników zespołu operacyjnego Zakupy uczestniczy we wdrażaniu me-tody 5S, ponad 60% pracowników deklaruje znajomość podstawowych zasad dotyczących jej stosowania w praktyce, natomiast co 4 pracownik deklaruje brak znajomości tego terminu.
Rysunek 6. Percepcja sformułowania metody 5S rozumiana przez pracowników zespołu operacyjnego Zakupy
Źródło: opracowanie własne na podstawie przeprowadzonych badań ankietowych.
Połowa pracowników zespołu operacyjnego Planowanie deklaruje aktywne uczest-niczenie w realizacji metody 5S, 50% ankietowanych deklaruje znajomość podstawo-wych zasad dotyczących stosowania metody 5S, ale jednocześnie aktywnie nie uczest-niczą w praktycznej realizacji.
Rysunek 7. Percepcja sformułowania metody 5S rozumiana przez pracowników zespołu operacyjnego Planowanie
Ponad 55% pracowników działu Technika stosuje w praktyce operacyjnej zasady wynikające z metody 5S, ponad 40% pracowników deklaruje teoretyczną znajomość jej zasad, jednakże nie angażuje się w działalność operacyjną.
Rysunek 8. Percepcja sformułowania metody 5S rozumiana przez pracowników zespołu operacyjnego Technika
Źródło: opracowanie własne na podstawie przeprowadzonych badań ankietowych.
Ponad 40% pracowników działu Administracja – Kadry deklaruje aktywne uczestni-czenie w realizacji metody 5S, natomiast 60% ankietowanych twierdzi, że zna meryto-ryczne zasady metody, jednakże nie uczestniczy w praktycznej realizacji.
Rysunek 9. Percepcja sformułowania metody 5S rozumiana przez pracowników zespołu operacyjnego Kadry
Działy Produkcyjne
Niecałe 70% pracowników produkcyjnych przypisanych do działu Ramy deklaruje swój aktywny udział we wdrażaniu metody 5S, pozostałe 30% przyznaje, że zna teoretyczne zasady dotyczące stosowania metody, lecz nie angażuje się w implementację jej do prak-tyki gospodarczej, ponad 1% twierdzi, że nie zna tego terminu.
Rysunek 10. Percepcja sformułowania metody 5S rozumiana przez pracowników zespołu operacyjnego Ramy
Źródło: opracowanie własne na podstawie przeprowadzonych badań ankietowych.
Ponad połowa pracowników produkcyjnych działu Pudła deklaruje aktywny udział we wdrażaniu metody 5S, niecałe 40% twierdzi, że zna merytoryczne zasady jej wdraża-nia, lecz nie angażuje się do jej implementacji. Ponad 7% pracowników twierdzi, że nie słyszało o takiej metodzie związanej z ciągłym doskonaleniem.
Rysunek 11. Percepcja sformułowania metody 5S rozumiana przez pracowników zespołu operacyjnego Pudła
Źródło: opracowanie własne na podstawie przeprowadzonych badań ankietowych.
Ponad 40% pracowników zespołu operacyjnego Malarnia deklaruje uczestnictwo w praktycznym wdrażaniu metody 5S, 55% twierdzi, że zna teoretyczne podstawy do-tyczące implementacji tej metody, niecałe 4% pracowników przyznaje, że nie słyszało nigdy o tej metodzie.
Rysunek 12. Percepcja sformułowania metody 5S rozumiana przez pracowników zespołu operacyjnego Malarnia
Więcej niż ¾ pracowników produkcyjnych działu Narzędzia deklaruje zaangażowane uczestnictwo w implementacji metody 5S. 20% ankietowanych twierdzi natomiast, że zna teoretyczne podstawy tej metody, lecz nie angażuje się do jej wdrażania.
Rysunek 13. Percepcja sformułowania metody 5S rozumiana przez pracowników zespołu operacyjnego Narzędzia
Źródło: opracowanie własne na podstawie przeprowadzonych badań.
Syntetyczna ocena wyników i wnioski z badania
W odpowiedzi na zadane pytanie na temat znajomości i zaangażowania pracowników w realizację metody 5S większość ankietowanych, tj. zarówno pracownicy administra-cyjni, jak i pracownicy produkadministra-cyjni, podała, że stosuje tę metodę. Można jednak za-uważać rozbieżności w poziomie zaangażowania poszczególnych zespołów (tabela 3). Pracownicy analizowanego przedsiębiorstwa są zaangażowani w praktyczną realizację metody 5S, ale większą mobilizację i zaangażowanie deklarują zatrudnieni w działach produkcyjnych niż administracyjnych, co może wynikać z faktu, że w zespołach opera-cyjno-produkcyjnych są wytypowani pracownicy, tzw. liderzy 5S, których zadaniem jest zarządzanie całym procesem wdrażania metody; w działach administracyjnych – brak takich osób. Warto również podkreślić, że pracownicy działów administracyjnych znacz-nie częściej deklarują brak teoretycznych podstaw znajomości metody 5S niż pracownicy produkcyjni.