REDESIGN OF WAREHOUSING PROCESS WITH
AN APPLICATION OF OBJECT-ORIENTED
SIMULATION METHOD
Monika Kaźmierczak* and Hanna Sawicka**
Poznan University of Technology, 3 Piotrowo, 61-138 Poznan, Poland, * Email: monika.z.kazmierczak@student.put.poznan.pl
** Email: hanna.sawicka@put.poznan.pl
Abstract: The aim of this research is to improve a warehousing process. Its operations are characterized by deterministic and stochastic parameters. In such circumstances, the classical approaches based on deterministic methods leading to better performance of the process would not provide the expected results. Thus, the authors propose the methodology of process improvement. Introduction of a new technical equipment and reassignment of tasks to employees was proposed. The problem has been solved, providing significant improvement of the warehousing process. The proposed methodology of simulation-based process improvement has been proposed and verified. The process map created as the result of process analysis facilitates and accelerates the simulation model construction. The possibility to reflect random values brings the model closer to reality and increases the credibility of results.
Paper type: Research Paper Published online: 30 August 2017
Vol. 7, No. 4, pp. 351–366
DOI: 10.21008/j.2083-4950.2017.7.4.7 ISSN 2083-4942 (Print)
ISSN 2083-4950 (Online)
© 2017 Poznan University of Technology. All rights reserved.
Keywords: Simulation, ExtendSim, warehousing, pharmaceutical products, redesign, proc-ess improvement
1. INTRODUCTION
The situation on a warehouse and logistic market is growing rapidly in recent years. This is confirmed by the current reports on warehouse space market in the European Union (Dolega, 2017), including Poland (Listowski, 2016). The devel-opment concerns both the demand and the supply sides (Olszewski & Ciupek 2016). According to the recent research (Mika, 2017) total warehouse space in Poland amounts nearly 11.2 million sq. m at the end of 2016. For comparison, at the end of 2015 its size was equal to nearly 10 million sq. m (Olszewski, 2016), while at the end of 2014 – more than 8.5 million sq. m (Socha, 2015). A character-istic feature of the market is a dispersion of warehouses on Polish territory. It gives a chance for many companies to the location of stocks in different parts of the country.
According to market analysts, one of the directions of warehouse market devel-opment is the construction of high-tech facilities (Branecka et. Al, 2016). The role of warehouses boils down to orders’ service centers, handling and sorting places.
The increase in available storage space will be associated with a growing com-petition. Effective tool in the fight between the companies operating on this market, in addition to providing storage space, is the comprehensive implementation of warehouse processes at the highest possible level.
The highest level of service, according to the classical principle of "7R" (Coyle et. al, 2002), means the implementation of the key rules while delivering products, which are as follows: at the right time, place, and price, according to the orders, ensuring right condition of the products and their delivery to the right customers. Nowadays, one of the critical service evaluation criteria is the right time (van der Vegte, 2016). Many companies could offer next day delivery. Since 2010, the number of companies offering same day delivery has been increasing. However, the most important issue, from the customer perspective, is delivery on time, ac-cording to lead-time request.
Market analysts of warehousing services and logistics (Staniszewska et. al, 2015) emphasize that an important element of its operation is the added value. Due to the constantly evolving market for storage services and logistics, innovation and technology development have become a tool for optimizing costs, achieving and maintaining market leadership.
One of the effective tools for recognition of the place in which the added-value originates, is the warehousing process analysis. This process is defined (Tompkins et. al, 2010) as a set of activities related to the admission, storage, assembly, and shipping operations.
The admission is represented by the dock operations, which are as follows: un-loading shipments, quality and quantity control, sorting, and information flow.
The storage is connected with the movement of products from the dock area to a holding location and it is composed of a set of operations, such as: receiving
goods from the admission, distribution of goods in the storage area, storage of goods, the transfer of goods to the picking zone. Storage of goods may be short-term or long-short-term, depending on specificity of the products or variability in de-mand. Some goods, such as fruits, vegetables, flowers, pharmaceutical products, must be stored under specific conditions and in certain locations. Thus, ware-house’s areas should be designed to ensure appropriate storage conditions, e.g. they should be dry, with adequate circulation, with temperature regulation.
The assembly is composed of picking operations, packaging for shipment and quality control of the ordered unit in places adapted for this purpose, and under certain organizational and technological conditions. The picking operations can be carried out in the storage area or in place designated for these activities. Kłodawski and Jacyna (2011) state that the assembly is the most time-consuming activity in the warehouse. Based on their research it absorbs 50% of the time for the whole process of storage. Moreover, it requires the highest financial expenditures, i.e. 55% of operational costs. Gu et. al (2010) state that not only order picking is complex and laborious task. Storage can also determine warehouse performance.
Shipping operations include the release control of goods from the warehouse and loading of goods on vehicles. In some warehouses the quality control of the ordered unit is carried out in case it is not covered by assembly process.
Taking into account the complexity of warehousing process, its management and assessment is not an easy task. Warehouse management is a combination of the planning and control systems and the decision rules used for inbound, storage, and outbound flows (Faber et. al, 2013). However, most of the problems solved in the warehouses are concentrated on selected issues. They are lacking of the overall analysis (Gu et. al, 2010), which is crucial for reliable rating. There are presented in the literature different warehousing process evaluation criteria, among which can be distinguished (Coyle et. al, 1992; Hunt, 1996; Khan et. al, 2016): warehousing costs, inventory level, rotation level, damaged inventory quantity, storage utiliza-tion, technical equipment utilizautiliza-tion, order fulfillment rate, order accuracy. The rating and decision process is usually carried out with an application of optimiza-tion methods (Faber et. al 2013, Powers 1989). Their advantage is the possibility to get the exact solution of the problem. An important limitation is a high computa-tional complexity of the analyzed process. Complexity, uncertainty and dynamism are the core characteristics of the processes evaluated with an application of simu-lation methods and tools (Law & Kelton, 2000). Law and Kelton (2000) state that simulation means numerically exercising the model for the inputs in question to see how they affect the output measures of performance. Thus, simulation allows de-sign a model and carry out the experiments, aimed at understanding the principles of process operations and the evaluation of different strategies, taking into account the limitations imposed by the criterion or criteria (Shannon, 1975). There are two main types of model creation, i.e. structural and object-oriented (Olczyk, 2010). The first approach is based on structural programming languages. The key function plays data and transformation processes. The object-oriented approach is based on
objects, which are the core modeling structure representing the system. These ob-jects are described by characteristic parameters, imitating assigned tasks.
The object-oriented simulation is applied in this research to solve the problem de-fined as the bottlenecks reduction, leading to a warehousing process improvement.
This paper is composed of four sections. The first one presents the current state of the warehousing market based on literature review, including industry reports. There is also introduced warehousing process with its components. The general information on warehousing management and evaluation criteria of warehousing operations are described. Finally, the major groups of methods aiding in assess-ment and better warehousing performance are presented.
There is proposed methodological approach in the second section of this paper. Key phases of the method and their short characteristic are described. In the third section the application of this methodology in the real-world pharmaceutical compa-ny is presented. It starts from the analysis of the warehousing process and mapping. Next, the simulation model and the simulation experiments with an application of object-oriented simulation tool ExtendSim are carried out. Based on the output data analysis, the bottlenecks are identified and warehousing process redesign scenarios are proposed. They are modeled in the simulation tool and computational experi-ments are performed. Their results are analyzed and final recommendation is pre-sented. The conclusions are drawn and described in the last section. There are also presented future research directions. The paper is completed by the bibliography.
2. METHODOLOGICAL APPROACH
The authors of this paper propose the methodological approach to improve complex process, with the operations characterized by deterministic and stochastic parame-ters. There are distinguished six phases in the methodology, which are as follows:
• Phase 1. Detailed analysis of the process and its mapping. • Phase 2. Simulation model creation.
• Phase 3. Simulation experiments and output data analysis. • Phase 4. Proposal of redesign scenarios.
• Phase 5. Modeling redesign scenarios and computational experiments. • Phase 6. Analysis of results and final recommendations.
The phase 1 of the complex process improvement is based on the analysis of the process and its presentation as the scheme of operations and relations between them. The above-mentioned analysis is composed of two steps. The first one repre-sents the preliminary diagnosis of the problem. For most of the processes, which are to improve, the initial problem is recognized before the fixing procedure starts. The second step is based on the detailed analysis. It helps to recognize the activities forming the considered process, relations between them and to identify
characteris-tic parameters. Its accuracy matches the objective of process improvement, which should be formulated within this phase.
The graphical representation between operations provides better understanding of the process and helps to recognize its holistic structure. It also accelerates the simulation model creation in object-oriented simulation tool. The other advantages of this phase are as follows (Sawicki & Sawicka, 2014): possibility to identify the most important activities in the process; possibility to understand the cause-effect relationships between them with the support of the graphical representation; pos-sibility to recognize human and technical resources in the process and their as-signment to the tasks, as well. However, this phase is not without drawbacks. It is time-consuming and it usually requires in-depth data analysis.
In the phase 2, the simulation model of the process’s current state is created. The precision of the modeling depends on the objective set for the improvement (see phase 1). The model usually reflects the sequence of operations, the relation-ships between them and the performance of the analyzed process. There is also reflected stochastic nature of the real-world activities. In the warehousing process, presented in the next section, the object-oriented simulation tool ExtendSim is ap-plied to create the model.
In the phase 3, the simulation experiments are carried out. Based on them the obtained results are compared to the real information collected within the phase 1, i.e. analysis of the process. The evaluation criteria are selected. The model is veri-fied and validated. Next, the number of simulation runs and the simulation time is set up. Finally, the output data of the simulation experiments are analyzed. They provide a variety of information, including: queues lengths, waiting time, the num-ber of arrived objects, the numnum-ber of served objects and utilization of resources. Based on them the bottlenecks are identified.
In the phase 4, the redesign scenarios of the current process are created. They should aim to reduce the bottlenecks or to eliminate them in some cases. These changes are formulated heuristically, i.e. with an expert knowledge and experience. They should lead to the process improvement.
In the phase 5, the redesign scenarios are introduced for the simulation model. Next, the simulation experiments are carried out. The number of simulation runs and the simulation time has the same values as it is assumed in the phase 3. Finally, the output data are compared to the current state and between each other. The eval-uation criteria created in the phase 3 are used.
In the phase 6, the obtained results are analyzed and the best redesign scenario
is selected. Then, the final solution of the process improvement is recommended. This procedure has been verified on the pharmaceutical company, presented in
3. APPLICATION OF THE PROPOSED METHOD IN A
PHARMACEUTICAL COMPANY
3.1. Analysis of the warehousing process
The pharmaceutical company, presented in this paper operates on a Polish mar-ket. There are distribution centers, local warehouses and reloading points in its infrastructure. This research is concentrated on one warehouse of pharmaceutical products. Due to the nature of the stored products the warehouse must be properly equipped, e.g. insulated walls, the appropriate temperature, separate area for storage of products in the cold room, constant humidity, floor that can be cleaned easily.
The initial analysis of the warehousing process revealed the delays of products deliveries to customers. Moreover, the reason of this situation is significant delays during quality control. To confirm or deny these observations a detailed analysis of the functioning of the warehouse has been carried out.
The operations, which compose the warehousing process and relations between them are presented in Figure 1 and discussed below.
Unloading of goods
Labeling pallet units Preparation of pallet units for
storage Transport to storage area
Storing in the
reserves area Storing in the releases area Storing in the special area
Full pallet
picking Container picking
Quality control Loading containers on a pallet Special container picking Loading special containers to boxes Preparation for transport Delivery of goods to warehouse Loading for transport Delivery of goods to customers Transport to admission area Quality control
The pharmaceutical products are delivered to the warehouse, they are unloaded and transported to designated place in the area of admissions. Next, the quality control of delivered products is carried out. It includes both the qualitative and quantitative aspects, such as potential damages during transport and order fulfill-ment. After this operation, each pallet of goods is labeled, which improves the in-formation and product flow in the warehouse. The products are put on pallets with the rule: one pallet with the same assortment on. They are transported to one of three warehouse’s areas, i.e. reserve area, releases area and special area.
The first one is a place where pallets of products are stored in racks. However, due to the nature of the products, special storage conditions and frequent quality controls must be fulfilled. Next, products from the reserves area are picked accord-ing to orders prepared for transport as full pallets and loaded on vehicle.
In the releases area products are stored in racks. They are picked in containers according to orders. The container unit is smaller than pallet unit. It is labeled with in-formation about the customer, its location, the quantity of ordered products. The picker fills in the container and after that the quality control is carried out. Finally, the con-tainers are collected on a pallet, prepared for transport and loaded on vehicle.
The special area is a part of the warehouse where the pharmaceutical products with special supervision are stored and according to established internal proce-dures. Based on the orders, the products are picked to special containers and then they are loaded to sealed boxes to protect products during the transport. After the preparation for transport operations, boxes are loaded on vehicle.
The warehousing operations are supported by internal transportation means, such as forklifts, and technical equipment, including: semi-automatic wrappers, flow racks, automated picking system and roller conveyor.
3.2. Construction of the simulation model
The simulation model has been constructed in the object-oriented simulation tool ExtendSim (Diamond et. al, 2010). This tool provides model creation based on objects available in the library, which is composed of the following sets: Anima-tion, Electronics, Item, Plotter, Rate, Templates, Utilities and Value. Each set con-tains objects with specific characteristics, describing operations. The objects can be connected and the parameters characterizing them can be modified. This simulation tool enables modeling continuous and discrete events with deterministic and sto-chastic parameters. It also presents dynamic flow of products.
The map of the warehousing process in the pharmaceutical company, presented in the previous section, has been the starting point to construct the simulation model. The above-mentioned ExtendSim tool has been applied. The simulation model is composed of more than 80 objects and exemplary sequence is presented in Figure 2.
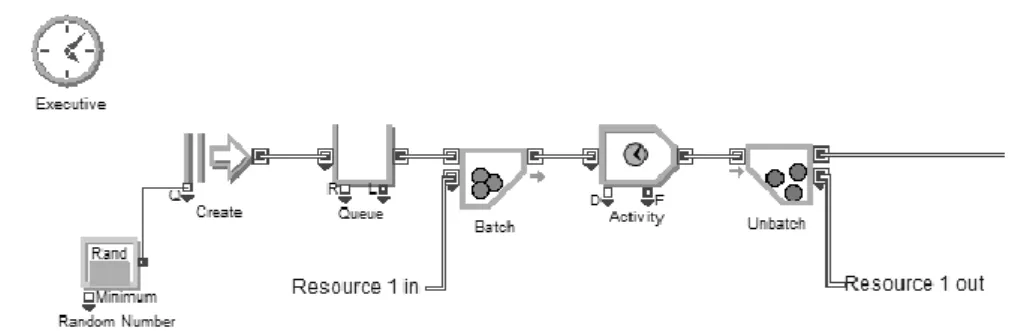
Fig. 2. Simulation model of goods unloading operation
It shows the unloading operation. It starts from the generation of deliveries to the warehouse, modeled with the Create object, presented on the left side of the Figure 2. The number of deliveries (Random Number object) and their frequency are modeled as stochastic values. The next operation is the assignment (Batch ob-ject) of technical and human resources (Resource 1 in) to unloading operation (Ac-tivity object). The time of this ac(Ac-tivity varies, thus it is modeled as a stochastic value. When the unloading operation is finished, the resources are available for the next operation (Resource 1 out). The Unbatch object represents their release.
The analyzed process has a discrete nature. Thus, the simulation model contains the Executive object, representing this fact. The stochastic values, such as unloading time, quality control time, number of ordered products, are measured in the current process. Based on them the probability distributions are calculated and modeled in the simulation tool. Finally, the computational experiments are carried out.
3.3. Simulation experiments and analysis of results
The simulation model shortly described in the previous chapter is verified and validated. The verification is conducted during the simulation model construction. The sequence of operations and their relationships are checked. The validation is based on the comparison between real parameters, real data and modeled values in the object-oriented simulation tool. The differences do not exceed 5 % and it is a satisfactory level.
Before the experiments start, the simulation input parameters are designed. Thus, the global time units are minutes, the simulation time is a month and the number of runs equals ten. The results obtained after each simulation run are dif-ferent. This is the effect of the modeled process dynamic nature and stochastic parameters, as well. The simulated process have been evaluated by the following criteria: (C1) the average waiting time before unloading of goods, measured in (s), minimized criterion; (C2) the average waiting time before labeling, measured in (s), minimized criterion; (C3) the average waiting time before storage, measured in
(s), minimized criterion; (C4) the average waiting time before quality control (re-leases area), measured in (s), minimized criterion; (C5) the average queue length before unloading of goods, measured in (units), minimized criterion; (C6) the aver-age queue length before labeling, measured in (units), minimized criterion; (C7) the average queue length before storage, measured in (units), minimized crite-rion; (C8) the average queue length before quality control (releases area), measured in (units), minimized criterion.
The values of obtained results are presented in Table 1 and graphically repre-sented in Figures 3 and 4.
Table 1. The results of simulation experiments – current state (Kaźmierczak, 2017)
Experiment number
Average waiting time (s) Average queue length (units) before unloading before labeling before storage before quality control before unloading before labeling before storage before quality control 1 559,46 98,07 61,07 1365,97 1,46 4,23 2,62 59,05 2 565,40 107,84 59,97 1124,19 1,48 4,38 2,44 40,79 3 562,47 109,11 68,07 964,23 1,48 4,62 2,88 35,99 4 620,87 103,28 64,14 972,29 1,54 4,11 2,56 36,04 5 581,34 117,28 61,84 998,87 1,55 4,86 2,57 40,43 6 567,73 112,30 67,75 1560,34 1,81 5,47 3,29 70,50 7 593,03 111,13 58,89 1830,79 1,71 4,65 2,39 67,93 8 586,44 103,59 58,84 1192,32 1,58 4,53 2,57 48,52 9 605,42 105,66 60,48 1655,54 1,99 5,39 3,09 75,67 10 638,70 102,51 54,95 1302,81 2,02 5,11 2,74 59,41 0 200 400 600 800 1000 1200 1400 1600 1800 2000 1 2 3 4 5 6 7 8 9 10 A v er a g e w a it in g t im e [s ] Experiment number before unloading before labeling before storing before quality control
Fig. 3. Graphical representation of average waiting time before selected operations –
0 10 20 30 40 50 60 70 80 1 2 3 4 5 6 7 8 9 10 A v er a g e q u eu e le n g th [ u n it s] Experiment number before unloading before labeling before storing before quality control
Fig. 4. Graphical representation of average queue length before selected operations –
cur-rent state (Kaźmierczak, 2017)
The average waiting time is the highest before quality control in the releases ar-ea. It ranges from 16 minutes to more than 30 minutes. The diagram is not uniform, because the time of quality control depends on the number of assigned workers. The queues appear before unloading, too. Its average value equals almost 10 minu-tes. The lowest value of average waiting time is before storing – 1 minute. Low value is also observed before labeling and it equals 1.7 minute.
The average queue length is the highest before quality control in the releases area and it equals more than 53 units. The shape of diagram is similar to the one presented in figure 3. The characteristic peaks appear for the same experiment numbers. The number of units waiting in the queue before unloading is the lowest in the analyzed process, the average queue length is 1.6 units. However, the aver-age waiting time of these goods is almost 10 minutes (Fig. 3). Thus, the unloading operation should be monitored, but it is not the main reason of late deliveries to customers. The results of two remaining operations, i.e. storing and labeling, are not alarming. The average queue length equals 2.7 units and 4.7 units, respectively.
The preliminary analysis of the current state, proved by the simulation experi-ments, revealed that the quality control is the weakest point of the warehousing process. This part of the process should be redesigned and the scenarios of changes are presented in the next section.
3.4. Redesign scenarios
The most important change of the quality control process in the releases area is the introduction of the automatic device. Currently, there are 10 workers assigned to this operation. There is needed only one operator for the introduced machine.
Thus, the remaining 9 workers could be assigned to the other tasks in the ware-house. The further analysis is concentrated on the above-mentioned workers as-signment. They constitute different redesign scenarios. The changes are introduced to the simulation model, computational experiments are carried out and the results are analyzed and compared. Finally, the best scenario is selected.
3.5. Changes of the simulation model, computational experiments and
results analysis
The redesign scenario, which provides the most satisfactory improvement of the warehousing process is based on the following changes:
• introduction of the automatic device and 1 qualified worker supporting quality control in the releases area,
• assignment of 2 additional workers to unloading operation, • assignment of 1 additional worker to labeling activity,
• assignment of 6 additional workers to storing area, because the support of the previous operations would increase the queue length before storing ac-tivity.
The input parameters of the simulation experiments are the same as for current state model. The results are presented in the Table 2, Figures 5 and 6.
Table 2. The results of simulation experiments – redesign scenario (Kaźmierczak, 2017)
Experiment number
Average waiting time (s) Average queue length (units) before unloading before labeling before storage before quality control before unloading before labeling before storage before quality control 1 399.66 4.22 98.65 0 1.03 0.17 4.13 0 2 424.41 4.39 75.83 0 1.13 0.18 3.22 0 3 387.82 3.99 78.41 0 1.07 0.16 3.23 0 4 395.66 4.34 85.33 0 1.01 0.18 3.48 0 5 418.51 3.88 78.91 0 1.08 0.16 3.23 0 6 475.10 4.12 64.89 0 1.42 0.19 3.14 0 7 433.81 3.97 78.80 0 1.17 0.17 3.46 0 8 453.79 3.88 91.71 0 1.27 0.17 4.13 0 9 432.19 4.35 87.53 0 1.29 0.21 4.21 0 10 435.26 4.25 86.96 0 1.18 0.19 3.81 0
0 200 400 600 800 1000 1200 1400 1600 1800 2000 1 2 3 4 5 6 7 8 9 10 A v er a g e w a it in g t im e [s ] Experiment number before unloading before labeling before storing before quality control
Fig. 5. Graphical representation of average waiting time before selected operations –
redes-ign scenario (Kaźmierczak, 2017)
0 10 20 30 40 50 60 70 80 1 2 3 4 5 6 7 8 9 10 A v er a g e q u eu e le n g th [ u n it s] Experiment number before unloading before labeling before storing before quality control
Fig. 6. Graphical representation of average queue length before selected operations –
redes-ign scenario (Kaźmierczak, 2017)
3.6. Final results and recommendations
The information presented in Table 2, Figures 5 and 6 shows the improvement of the warehousing process. Average queue length and waiting time before quality control in the releases area is eliminated. The average waiting time before unload-ing and labelunload-ing are reduced to 7 minutes and 0.1 minute, respectively. The im-provement equals almost 28% for time spent in a queue before unloading operation and 96% for time spent in a queue before labeling. The average waiting time before storing slightly increased – 37% of deterioration.
The average queue length equals 0 before quality control in the releases area, which constitutes 100% of improvement. Better situation is also before unloading and labeling operations. The average number of units waiting in the queue equals 1.2 and 0.2, respectively, which is 29% and 96% improvement. The average queue length before storing increased to 3.6 units, which is 33% of deterioration. It is worth to notice that, the average waiting time before all considered operations doesn’t exceed 8 minutes, which is 74% improvement of the current state. Similar situation is for the average number of units waiting in the queue, where the highest average value equals 4.2. Thus, the improvement equals 95%.
Finally, taking into consideration the analysis of the results, the presented redes-ign scenario is recommended for changes in the warehousing process. It is ex-pected the reduction of delivery time to customers, quality of customers’ service improvement and company’s better competitive position on the market, as well.
4. CONCLUSIONS
This paper presents the results of the research on warehousing process changes. The methodology of complex process improvement has been proposed and verified on the real pharmaceutical company. This methodology is composed of six phases and its main components are the analysis of the process with the graphical repre-sentation, simulation modeling and experiments. The mapping is a very useful tool, providing the information about the process structure, relationships between opera-tions, information and product flow. It also helps to construct the simulation model in object-oriented simulation tool. Based on the real-world data, the simulation model can be verified and validated. The results of the simulation experiments are the core data for the process quantitative analysis.
The example of the pharmaceutical company shows that the improvement of one activity of the complex process has an influence on the next and previous op-erations. Thus, the analysis of redesign scenarios has been a time-consuming work, while different configurations of changes have been tested by modeling, simulation experiments and analysis of results. Finally, the most advantageous solution has been recommended.
It is based on the introduction of a new machine in the quality control process within releases area. Thanks to this solution, nine workers can be assigned to diffe-rent tasks, improving the effectiveness of the whole process. Moreover, it is assumed shortening delivery time, resulting in the improvement of customers’ sat-isfaction and competitive position on the market.
The research confirms that precise analysis of the process with data collection and the application of general-purpose object-oriented simulation tool could pro-vide improvement of the whole process with reasonable results.
The selected simulation tool ExtendSim and constructed simulation model has a universal nature, thus it can be applied in the other warehousing processes. The versatility of the model is understood as a repetitive sequence of objects, represent-ing different activities in the process, such as unloadrepresent-ing, pickrepresent-ing up. The differ-ences between objects are recognized on the parameters characterizing them. The methodology of process improvement should be verified on different processes and the other simulation methods can also be applied.
REFERENCES
Branecka K. et. al (2016), JARTOM Real Estate Report – Trends in the Years 2016 – 2017 on the Warehouse Market (in Polish), JARTOM Real Estate, Warsaw, available at: https://jartom.com.
Coyle J.J, Bardi E.J. & Langley C.J. (1992), The Management of Business Logistics: A Supply Chain Perpsective, South-Western/Thomson Learning, Mason.
Diamond B., Krahl D., Nastasi A. & TagP. (2010), ExtendSim Advanced Technology: Integrated Simulation Database. Proceedings of the 2010 Winter Simulation Con-ference, Baltimore, December, 5–8, pp. 32–39.
Dolega S. (2017), The Warehouse Market Is Not Slowing Down. BNP Paribas Real Estate, Warsaw, available at: http://bnpparibas.media.pl.
Faber N., de Koster M.B.M. & Smidts A. (2013), Organizing Warehouse Management, International Journal of Operations & Production Management, Vol. 33, No. 9, pp. 1230-1256, DOI: 10.1108/IJOPM-12-2011-0471.
Gu J., Goetschalckx M. & McGinnis L.F. (2010), Research on Warehouse Design and Performance Evaluation: A Comprehensive Review, European Journal of Operational Research, Vol. 203, No. 3, pp. 539–549.
Hunt V. (1996), Process Mapping. How to Reengineer Your Business Process. John Wiley & Sons, New York.
Kaźmierczak M. (2017), The Warehouse of Pharmaceutical Products Improvement with an Application of Object-Oriented Simulation Tool (in Polish), Politechnika Poznan-ska, Poznan.
Khan S., Dweiri F. & Chaabane A. (2016), Fuzzy-AHP Approach for Warehouse Performance Measurement. Proceedings of the 2016 IEEE IEEM, pp. 871–875, DOI: 10.1109/IEEM.2016.7798001
Kłodawski M. & Jacyna M. (2011), The Time of Picking Process as a Criterion for Shaping Picking Zone (in Polish), Logistyka, Vol. 2, pp. 307–317
Law A.M. & Kelton W.D. (2000), Simulation Modeling and Analysis, McGraw-Hill, New York.
Listowski T. (2016), Industrial Market in Poland Q3 2016, Cushman & Wakefield, War-saw, available at: http://outsourcingportal.eu.
Mika T. (2017), Warehouse market in Poland in 2016 (in Polish), Jones Lang Lasalle, War-saw, available at: http://magazyny.pl.
Olczyk D. (2010), Structural Modeling – Definitions, Notation, Techniques and Tools (in Polish), Warszawska Wyzsza Szkola Informatyki, Zeszyty Naukowe, Vol. 4, pp. 87–98.
Olszewski T. (2016), Poland's Industrial Market in 2015, Jones Lang Lasalle, Warsaw, available at: https://warehousefinder.pl.
Olszewski T. & Ciupek P. (2016), Industrial Market in Poland Q3 2016, Jones Lang Lasalle, Warsaw, available at: http://paiz.gov.pl.
Powers R.F. (1989), Optimization Models for Logistics Decisions, Journal of Business Lo-gistics, Vol. 10, No. 1, pp. 106–121.
Sawicki P. & Sawicka H. (2014), Logistics Process Improvement Using Simulation and Sto-chastic Multiple Criteria Decision Aiding. Procedia – Social and Behavioral Sciences, Vol. 111, pp. 213–223.
Shannon R.E. (1975), Systems Simulation. The Art and Science, Prentice-Hall, Englewood-Cliffs.
Socha B. (2015), Record Demand for Warehouse Space in 2014 – JLL, Valkea Media, Warsaw, available at: http://wbj.pl.
Staniszewska A., Palmer J. & Kuczyńska Ż. (2015), Time for Value Added Opportunities in CEE Logistics Market, BNP Paribas Real Estate, Warsaw, available at: http://reale-state.bnpparibas.pl.
Tompkins J.A., White J.A., Bozer Y.A. & Tanchoco J.M.A. (2010, Facilities Planning, John Wiley & Sons. Hoboken.
van der Vegte R. (2016), Supply Chain Management Challenges, Deloitte, Copenhagen, available at: https://www2.deloitte.com.