Corresponding author: nhalmova@ukf.sk
Constantine the Philosopher University in Nitra, Department of Physical Education and Sport, Nitra, Slovakia
NORA HALMOVÁ, JANKA KANÁSOVÁ, ĽUBOSLAV ŠIŠKA
Physical fitness and level of body components in the
11-15-year old population in west Slovakia
TRENDS
in
Sport Sciences
2019; 1(26): 21-26 ISSN 2299-9590 DOI: 10.23829/TSS.2019.26.1-3 IntroductionA
t present, the level of physical fitness is on a steep decline in children and youth. Compared to the past, the children of today burn 600 kcal less than the children 50 years ago. This phenomenon has not been justifiably attributed to a sedentary life [3] only. However, physical activity is linked to physical fitness. Adequate physical activity has a direct impact on improving the health of children (the more active children have a generally healthier cardiovascular profile) and adults, which is the result of previous solid physical activity as children. In active children, the behavior can be ported into adulthood, and the active children are likely to become active and therefore healthier adults. Poor cardiovascular fitness is identified as one of the risk factors for overweight, obesity and diabetes, which are frequent causes of death not only in our country, but also world-wide [6]. In particular, child obesity can be a precursor for a number of adverse health effects in adulthood [5].Various observations and studies [17] highlight the importance of health promotion in children to reduce the incidence of overweight and obesity in children and adolescents. The negative correlation between bodily fat and the level of cardiorespiratory fitness suggests that it is necessary to increase the amount of physical activity.
Abstract
Introduction. The purpose of this paper is to extend the existing knowledge about physical fitness of the current school population aged 11-15 and identify the relationships between physical fitness and body components. Material and Methods. The research was held with the participation of 375 elementary pupils (5-9 grade). All measurements were done under identical conditions and were the part of the HBSC (Health and Behavior of School Age Children) study. The evaluation of physical fitness was done with the Ruffier test and SUUNTO POD testers were used to measure the heart rate. The data on body components were acquired with a bioimpedance diagnostic device InBody 720. Results.
The results pointed to a lower physical fitness in girls (Ruffier index of 15.80 ± 4.2) than boys (14.78 ± 4). When comparing the individual grades, the level of physical fitness increased in boys and girls with the increasing age in the seventh grade and subsequently decreased, and the differences were statistically significant (p < 0.05). In the analyzed schools, the Ruffier index values were within the range of 13.9 ± 3.8 to 16.1 ± 4.5, and the differences between them were statistically significant (p < 0.05). The parameter values for body components followed the trend in the Ruffier test. The regression analysis showed that physical prowess is affected by body fat mass to 9.67% and total body water to 1.21%. Conclusions. Young generation at age 11 to 15 years reaches lower physical fitness in comparison with the past. Boys have higher level of physical fitness than girls and the size of the city affects body composition and physical fitness. Parameters of body composition are in relation with Ruffier index. Body fat mass and total body water explaining the results of Ruffier test.
KEYWORDS: bioimpedance, heart rate, physical fitness, Ruffier test.
Received: 12 December 2018 Accepted: 23 February 2019
A number of foreign authors dealt with the relationship between physical fitness and body components [1, 2, 14, 21]. In Slovakia, however, this issue has not been analyzed in greater detail. Studies of this relationship in the 11-15 age category are absent in Slovakia. Only a single research on the relation between the body components and cardiovascular fitness in 15-19-year- old youth [17] is available.
The analysis of levels of physical fitness with the Ruffier test raises a number of responses to its validity. There are a number of studies [22, 23] available, which deal with this issue and present the results of its objectification. The study [9] provides the results that support the use of the Ruffier test as a regular and inexpensive treatment instrument for measuring and tracking the cardiorespiratory fitness levels and quantification of physical activity. The Slovak research from 1986 [20] suggests using this test from 12 years of age due to the incorrect squatting technique. To evaluate the individual age categories, we used a scale for age and gender [12]. This paper is part of a HBSC (Health Behavior in School- Aged Children) study. HBSC is an international study of health and health-related behavior of 11-, 13- and 15-year-old school students, which has been conducted in collaboration with the World Health Organization in 43 countries since 1983. Its aim is to monitor health and health-related behavior in school children in their social context. Every four years, the study is participated by approximately half a million school children aged 11 to 15 from more than 40 countries (Europe and North America), with a view to obtaining the data to compare the situation in the countries and monitor the current situation and trends in the lives of school children. The aim of this paper was to provide the data on body components and physical fitness and explore the relationships between the body components and physical fitness in 11-15-year-old school population in Western Slovakia.
Material and Methods
Sample and procedure
In our paper, we used the data from the Health Behavior in School-aged Children (HBSC) study conducted in 2018 in Slovakia. When choosing the HBSC, we used two-step sampling to obtain a representative sample. In the first step, 140 larger and smaller elementary schools located in rural and urban areas from all regions of Slovakia were asked to participate (randomly selected from a list of all eligible schools in Slovakia obtained from the Slovak Institute of Information and Prognosis
for Education). The school response rate (RR) was 77.85%. We obtained the data from 8.405 adolescents, grade 5-9 elementary, in the target group of 11-15-year- olds. Objective measurements were conducted among 10% of the total sample (4 schools, 375 children – 165 girls, 210 boys).
This study is coordinated in Slovakia by the Department of Health Psychology, Faculty of Medicine, Pavol Jozef Šafárik University in Košice, and it is implement in cooperation with several universities and institutions. The study was approved by the Ethics Committee of the Medical Faculty at the P.J. Šafárik University in Košice (16N/2017).
The parents were informed about the study via the school administration and could opt out if they disagreed with their child’s participation; participation in the study was fully voluntary and anonymous with no explicit incentives provided for participation. When collecting the data on physical fitness, we used the Ruffier functional test, which simply and reliably determines the functional state of cardiovascular system. The heart rate during the measurements was measured with a SUUNTO POD chest belt, and the results were directly recorded in special software that comes with the SUUNTO device. The Ruffier functional test consists of three parts. In the first part, the P0 Rest Heart Rate (RHR) monitoring is carried out after 3 minutes in a sitting position. In the second part, 30 squats are performed within 45 seconds, immediately followed by P1 measurement (Heart Rate After 30 Squats). The last part of the test is a resting sequence in a sitting position for 1 minute, followed by the P2 measurement (Heart Rate After 1 Minute of Rest). The RI Ruffier index of physical fitness is determined as follows: RI = ((P0 + P1 + P2) – 200) / 10 [12, 20]. To analyze the body components, we used a bioimpedance device InBody 230, and we measured the following parameters: CA – condition assessment, OL – obesity level, W – weight (kg), BFM (kg) – body fat mass, BMI Index, TBW – Total Body Water.
Principle of measurement
The children stood at rest for 5 minutes before the measurement. The measurement was carried out barefoot, and there was no need to undress because we subtracted the weight of clothes prior to measurement.
The statistical analysis of values was conducted through the ANOVA dispersion analysis at a 5% and 1% level of statistical significance and we used a stepwise regression analysis to assess the relationship between the results of the Ruffier test and the parameters of body components. Ruffier index entered to regression analysis as a dependent
variable and body composition parameters (CA, OL, W, BFM, BMI, TBW) entered as an independent variables. In the next step, we determined the percentages partial shares of the individual body composition parameters according to the regression analysis result. The remaining part consists of other unidentified factors.
Results
The results pointed to a lower physical fitness in girls (Ruffier index of 15.8 ± 4.2) than boys (14.8 ± 4). When comparing the differences between the genders in the individual grades, we can see that similar results in the Ruffier test were reached by boys and girls in the 5th and 7th grade. The differences in the 6th, 8th and 9th grade are more prominent, however, they were statistically significant only in the 9th grade F(1, 64) = 5.00, p < 0.05. When comparing the differences between the grades, the boys were not statistically different, however, the girls were significantly different. F(4, 162) = 2.42, p = 0.05 (Table 1).
In the overall evaluation of the grades regardless of gender, the best physical prowess was demonstrated in the pupils from the 7th grade and the worst in the 6th grade. The differences were statistically significant at 5% between the 8th and 6th grade F(1, 165) = 6.48, p < 0.05 and between the 7th and 5th grade F(1, 137) = 6.06, p < 0.05.
At 1%, the statistical difference was noted between the 7th and 6th grade F(1, 168) = 12.04, p < 0.01 (Figure 1).
Figure 1. Values of Ruffier index together and by gender in
the individual grades
When comparing the overall results observed in individual schools, Nitra came first, followed by Nové Zámky, Hlohovec and Alekšince. Significant differences were noted between Nitra – Hlohovec and Nitra – Alekšince at the 1% level F(1, 208) = 15.52, p = 0.00, F(1, 156) = 10.37, p = 0.00. At a 5% level of significance, differences were observed between Nové Zámky – Hlohovec and Nové
Zámky – Alekšince F(1, 220) = 5.72, p = 0.02, F(1, 168) = = 3.92, p = 0.05.
No differences have been noted between the grades at any school and no differences were noted between the schools in the individual grades p > 0.05 (Figure 2).
Figure 2. Comparison of Ruffier index at the individual schools
Note: AL – Alekšince, NZ – Nové Zámky, HC – Hlohovec, NR – Nitra The body components parameter values in each school had a similar trending as physical fitness measured with the Ruffier test. Apart from assessing the condition fitness – CA, we found statistically significant differences between the schools p < 0.01 (Figure 3) in all studied parameters.
Figure 3. Comparison of body components parameters at the
individual schools
Note: AL – Alekšince, NZ – Nové Zámky, HC – Hlohovec, NR – Nitra, CA – condition assessment, OL – obesity level, W – weight, BFM (kg) – body fat mass, BMI – body mass index, TBW – total body water
Correlation analysis demonstrated the relationship between functional fitness (Ruffier index) and body composition parameters, with the exception of total body water. Paradoxically, this parameter was specified in regression analysis as one of the predictors of
functional fitness. The model R2 = 0.109, F (1, 373) =
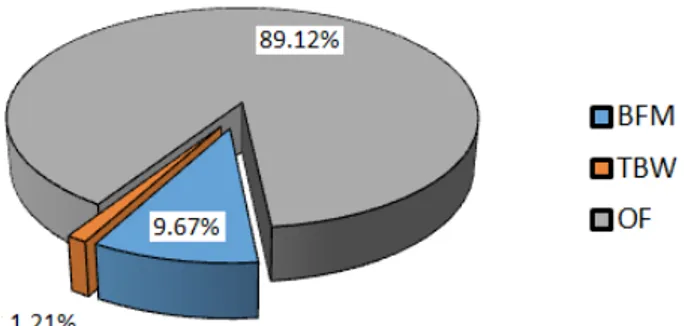
9.867, p < 0.01 explains the result of the Ruffier test at 11% using body fat mass and total body water and the rest 89% is unidentified other factors (Table 1, Figure 4) from this we can deduce the prediction equation.
Prediction equation: RI = 15.703 + 0.166*BFM – 0.085*TBW (R2: 10.9%; SEM: 3.927 point)
Figure 4. Partial shares of BFM (body fat mass), TBW (total
body water) and OF (other factors)
Table 1. Correlation coefficients and a regression model with
two body composition parameters
CA OL W BFM BMI TBW RI PC –0.136 0.187 0.118 0.292 0.201 –0.076 Sig. 0.008 0.000 0.022 0.000 0.000 0.139 Model R R square SEM F change df1 df2 Sig. 0.330 0.109 3.92719 9.867 1 373 0.002 B Std.
Error Beta t Sig. PC PS
(Constant) 15.703 0.842 18.653 0.000
BFM 0.166 0.025 0.331 6.564 0.000 0.292 0.097 TBW –0.085 0.027 –0.158 –3.141 0.002 –0.076 0.012 Note: RI – Ruffier index, PC – Pearson correlation coefficient, CA – condition assessment, OL – obesity level, W – weight, BFM (kg) – body fat mass, BMI – body mass index, TBW – total body water, Sig. – significance, R square – coefficient of determination, SEM – standard error of measurement, F change – test value, df1, df2 – de-grees of freedom, B – unstandardized coefficient, Beta – standard-ized coefficient, t – statistic (B/Std. Error), PS – partial shares
Discussion
Physical fitness is considered to be a solid indicator of good health in childhood, which increases the need to test physical fitness within a system to monitor the children and youth. The improvement of physical fitness by increasing the time spent in intense physical activity
should be one of the main objectives of the current government in promoting public health.
The results of our research can be viewed from several perspectives. We confirmed the findings of the authors [9, 10, 16, 17] that girls have a lower physical fitness than boys. Based on the standards, our research file can be assessed as below average to poor even when compared to other authors dealing with the same issue who have reached higher Ruffier index values by more than two points [16, 18]. It is necessary to examine the causes of this significant difference. The authors point to the low reliability of the Ruffier test in light of repeated measurements [16] where, in our case, we can speak about stress and its impact on the individual heart rate values. It would be interesting to see the results of repeated measurements after one hour. The studies [22, 23] looked at the lack of accuracy in the traditional calculation of the Ruffier index in terms of age categories, and they suggested a specific formula to recalculate the index based on age. In our case, we have a concrete proposal, in which the result from standardized calculation and the calculation of physical fitness would be compared as a ratio of differences P1– P0/P1–P2, which appears to be more appropriate and it takes into account the possibility of a higher heart rate at the beginning. In view of the differences between the sexes in the fifth and seventh grade, the boys and girls achieve similar values of the Ruffier index. In boys, physical fitness improved from the fifth to seventh grade and then it stagnated to the ninth grade with more or less identical values. In girls, the trending was irregular; they showed the best physical fitness in the seventh grade. The sixth and ninth grade is most critical especially in girls. Emphasis should be put on this category in the future. Author [17] states that 15-year-olds have equal physical fitness in terms of gender, which, however, was not the case in our study. If we focus on the individual schools according to village/city size, the worst physical fitness was observed at a school in the municipality with the smallest population. We assumed that children in the village would have more natural movement, which was, however, not confirmed. In body components, we observed six random parameters. The difference between schools in each of the parameters followed the trend of the results from the Ruffier test, which was also demonstrated in the correlation analysis where the studies [4, 8, 19] point to the relationships between physical fitness, VO2max and body component parameters. We
thus indirectly confirmed the findings of the authors on the validity of the bioimpedance measurement device InBody [13]. If we compare one of the most widely
used body component parameters – body mass index – our research set meets the norm: other works state the value from 18 to 22 [7, 11, 17, 19]. Compared to others, the increased body mass index value at the Alekšince school is caused by a higher amount of body fat and body mass, which was also reflected in the value of the Ruffier index. The paradox of our research is that while the correlation analysis did not confirm the relationship between the Ruffier index and the total body water in the body as one of the monitored parameters of body components, regression analysis pinned a statistically significant model with this very parameter. The results suggest that physical fitness is affected by body fat and the total body water in the body at about 11%. We did not explore additional parameters such as proteins, percentage of fat, intracellular water, etc., and we hereby propose to develop a comprehensive factor structure of the dependence between body components and physical fitness.
Due to the fact that physical fitness and some physical components correlate, the physical activity programs should be designed to improve the level of physical fitness and bodily indicators. The school, but also parents, play an important role in the identification of children with low physical fitness by encouraging the positive attitudes to physical activity and health of their children. In this area, longitudinal and randomized controlled trials are necessary in order to understand the nature and relative importance of the determinants of physical fitness in childhood and during the development of children.
Conclusions
We can conclude that our young generation at age 11 to 15 years reaches lower physical fitness in comparison with the past. Boys have higher level of physical fitness than girls, and this difference is mostly manifested in the sixth and ninth grade. The size of the city affects body composition and physical fitness and the results are improving with an increasing number of population. Parameters of body composition are in relation with Ruffier index. Body fat mass and total body water explaining the results of Ruffier test at the level of 11%. By this reason, there is a need to focus on the possibilities of influencing the body composition and physical fitness by playful interventional physical activity programs, healthy eating habits and by the general awareness of young people about these issues.
Acknowledgements
The contribution is a part of the grant project: VEGA 1/0410/17 Changes in the level of muscle imbalances, body posture and flexibility in athletes.
References
1. Benson AC, Torode ME, Fiatarone Singh MA. Muscular strength and cardiorespiratory fitness is associated with higher in sulin sensitivity in children and adolescents. Int J Ped Obesity. 2006; 1(4): 222-231.
2. Blaise A, Nemeth MD, Aaron L, Carrel MD, Eickhoff J, Randall R, Clark MS, Susan E, Peterson MS, David B, Allen MD. Fitness is a stronger predictor of fasting insulin levels than fatness in overweight male middle-school children. J Ped. 2007; 150(4): 383-387.
3. Boreham C, Riddoch C. The physical activity, fitness and health of children. J Sports Sci. 2001; 19(12): 915-929. doi: 10.1080/026404101317108426
4. Bovet P, Auguste R, Burdette H. Strong inverse association between physical fitness and overweight in adolescents: a large school-based survey. Int J Behav Nutr Physical Activity. 2007; 4(24).
5. Church TS, LaMonte MJ, Barlow CE, Blair SN. Cardiorespiratory fitness and body mass index as predictors of cardiovascular disease mortality among men with diabetes. Arch Intern Med. 2005; 165(18): 2114-2120. doi:10.1001/archinte.165.18.2114
6. Fedewa AL, Ahn S. The effects of physical activity and physical fitness on children’s achievement and cognitive outcomes: a meta-analysis. Res Q Exerc Sport. 2011; 82(3): 521-535.
7. Gažarová M, Mečiarová L, Kopčeková J, Holovičová M, Habánová M, Bronkowska M. Comparison of selected parameters of body compositionin a group of sporting and non-sporting women. Ann Nat Inst Hygiene. 2018; 69(3): 257-266.
8. Grassi GP, Turci M, Sforza C. Aerobic fitness and somatic growth in adolescents: a cross sectional investigation in a high school context. J Sports Med Phys Fitness. 2006; 46(3): 412-418.
9. Guo Y, Bian J, Leavitt T, Rosenberg IE, Budorf TW, Smith MD, Vincent HK, Mpdave F. A 3-minute test of cardiorespiratory fitness for use in primary care clinics. Plos One. 2018. doi: 10.1371/journal.pone.0201598 10. Hernández Alvarez JL, Velázquez Buendía R, Martínez
Goronno ME, Garoz Puerta I. Lifestyle and physical activity in Spanish children and teenagers: the impact of psychosocial and biological factors. J Appl Biobehav Res. 2009; 14(2): 55-69.
11. Joensuu L, Syväoja H, Kallio J, Kulmala J, Urho M, Kujala M, Tammelin TH. Objectively measured physical activity, body composition and physical fitness: cross-sectional associations in 9- to 15-year-old children. Eur J Sport Sci. 2018; 18(6): 882-892. doi: 10.1080/17461391.2018.1457081 12. Moravec R, et al. Telesný, funkčný rozvoj a pohybová
functional development and movement performance of 7-18 year old youth in the CSFR). Bratislava: MŠ SR, 1990.
13. Ogawa H, Fujitani K, Tsujinaka T, Utsumi S. InBody 720 as a new method of evaluating visceral obesity. Hepatogastroenterology. 2011; 58(105): 42-44.
14. Ortega FB, Ruiz JR, Castillo MJ, Sjöström M. Physical fitness in childhood and adolescence: a powerful marker of health. Int J Obes Relat Metab Disord. 2008; 32: 1-11. 15. Ortega FB, Ruiz JR, Castillo MJ. Physical activity,
physical fitness, and overweight in children and adolescents: evidence from epidemiological studies. Endocrinología y Nutrición. 2012; 60(8): 458-469. 16. Pérez AC, et al. Test-retest reliability and convergent
validity of the Ruffier Index in children under 12 years old. Sci Sports. 2018; 33(6). doi: 10.1016/j.scispo.2018.05.002 17. Ružbarský P, Zvonař M, Turek M, Kandrac R,
Slancová T. Association between body composition and cardiovascular fitness. Masaryk University: Studia Sportiva. 2015(1).
18. Sartor F, Bonato M, Papini G, Bosio A, Mohammed RA, Bonomi AG, et al. A 45-second self-test for cardiorespiratory fitness: heart rate-based estimation in healthy individuals.
Plos One. 2016; 11(12): e0168154. doi: 10.1371/journal. pone.0168154
19. Stigman S, Rintala P, Kukkonen-Harjula K, Kujala U, Rinne M, Fogeholm M. Eight-year-old children with high cardiorespiratory fitness have lower overall and abdominal fatness. Int J Ped Obesity. 2009; 4(2): 98-105. 20. Štulrajter V. Testovanie telesnej zdatnosti na základe
pulzovej frekvencie (Testing physical fitness based on pulse rate). Teorie a praxe telesné výchovy. 1984; 8(11): 641-646.
21. Wennlöf AH, Ruiz JR, Harro M, Sjöström M. Cardiorespiratory fitness relates more strongly than physical activity to cardiovascular disease risk factors in healthy children and adolescents: the European Youth Heart Study. Eur J Preventive Cardiol. 2007; 14(4): 575- -581.
22. Zanevskyy I, Janiszewska R, Zanevska L. Validity of Ruffier test in evaluation of resistance to the physical effort. J Testing Evaluation. 2017; 45(6). doi: 10.1520/ JTE20160380
23. Zanevskyy I, Zanevska L. Approbation of the Ruffier Test Model Adapted for Children. J Testing Evaluation. 2017; 46(3): 872-878. doi: 10.1520/JTE20170007