1.
bu sib fre th ne me lev isz ‒ ‒ ‒ ‒ ‒ ‒ ‒ ‒ Volume/TDecision
Marian Norbe. Introductio
Transpor usinesses. The ble without e eights. At the e most signif egatively affecents of the eco vel of its deve z et al. 2014): greenhouse ga emissions of a ral environme consuming va mentation) wi loss of biodive noise emission emission of w emission of v man health, traffic inciden production of als involving n Annual Ro Tom 20. Year/Rok
Problems
Tran
nna Jacyna*, M ert Chamier-G *Warsaw U **Koszalinon
rt plays an im functioning o efficient and r same time, ac ficant sources cting the healt osystems. The elopment, on t as emissions in air pollutants t ent, aluable natura ith newly built ersity or anxie n threatening h water and soil p ibrations adve nts,f vehicles, exp natural resourc
Set The Environ ocznik Ochrona Ś k 2018
s in Develo
nsport Sys
Mariusz Wasiak liszczyński**, T University of T University of T mportant role of these sphere reliable transp cording to ma of multifacto th and lives o e negative impthe natural env nfluencing clim that adversely al areas and c t technical infr ety of animals human health, pollution, ersely affecting ploitation mate
ces and human
nment Protectio Środowiska ISSN 1506-218X
oping Proe
stem
k*, Konrad Le Tomasz Dąbro Technology Technology for societies, es of human ac port systems any studies, tra orial environm of people and act of transpo vironment is re mate change, affect human cutting their c rastructure, co trapped in thei g building sub erials and consn work. n X 1007-1025
ecological
ewczuk*, owski** economies an ctivity is impo for people a ansport is one mental pollutio d almost all el rt, at the curre elated to (Mer health and nat continuity (fra ontributing to t ir locations, bstances and h struction mate 5 nd os-nd of on, le-ent rk- tu- ag-the hu-eri-In spite of actions constantly undertaken in designing, planning and organization, aimed at reducing the negative effects of transport (see Gołębiowski et al. 2013, Jachimowski et al. 2013), the continuous crease in transport volumes offsets desired proecological effects by in-creased transport work of both freight and passenger transport. Research (IOŚ 2011, Merkisz et al. 2014) show that road transport has the largest share in the overall emission of harmful compounds and noise to the en-vironment (Jacyna et al. 2017). The continuing advantage of the road transport makes difficult achieving so much needed changes in the field of environmental protection. Switching between the modes will solve the problem until the right infrastructure is created and organized. Also, the European Commission pays particular attention to the need for sustain-able development of environmentally friendly transport. Directive 2004/107/EC provides the framework for the control of ambient concen-trations of air pollution in the EU. It also provides control of emissions from vehicles, improving fuel quality and promoting and integrating en-vironmental protection requirements into the transport and energy sector. Considering the above, it can be concluded that transport satisfy-ing human needs is a "necessary evil" so the trade-off between social and economic development and natural environment protection needs new arguments on the environment side. In the consistency it is justified to search for new technical and organizational solutions for transport to limit its negative impact on the environment. In addition, due to the cur-rent economic conditions and forecasted growth, it is justified to develop legislative solutions affecting the attitude of transport service providers and transport users.
Simulation models seems to be the right tools to support the plan-ning and developing proecological solutions in transport, but modelling the development of large and complex proecological transport systems is a multi-faceted issue including (Jacyna & Wasiak 2014, Jacyna et al. 2014b):
‒ the needs and preferences of transport services purchasers, ‒ the sensitivity to changes in the transport system of clients,
‒ technical potential of transport service providers, including the possibility and willingness of implementing environmentally friendly solutions, ‒ the condition of transport infrastructure and vehicles of different
‒ solutions in the field of traffic organization in individual regions, ‒ transport policy including ecological conditions of transport system
development,
‒ negative impact of transport on the natural environment and quality of life (including health) and the possibility of its reduction.
Planning of the development of national transport systems with regard to the proecological aspects of different nature is usually referred as shaping a sustainable transport system (Ambroziak et al. 2013, Chi-queto & Mackett 1995, Colvile et al. 2001, Gołębiowski et al. 2013, Ja-cyna & Wasiak 2014, JaJa-cyna et al. 2014a, JaJa-cyna-Gołda et al. 2014, Vaitiekūnas & Banaitytė 2007). Therefore, shaping a sustainable trans-port system is associated not only with the implementation of operational objectives of the transport policy, but also with ecological goals concern-ing, among others, air, soil and water pollution, noise or vibrations emit-ted by means of transport and good of animals.
Considering the above, the main decision-making problems of shaping a pro-ecological transport system can be listed (Jacyna et al 2014a, Jacyna et al. 2015, Korzhenevych et al. 2014):
‒ selection of mechanisms for internalizing external costs that effec-tively affect the behaviour of transport services purchasers,
‒ creation of zero emission zones or low emission zones in urban ag-glomerations,
‒ introduction of emission limits for different classes of harmful com-pounds,
‒ introduction of low-emission means of transport and planning point emission sources (power plants),
‒ improvement of traffic flows.
Regardless of the type of decision problem in developing pro-ecological transport system, the key issue remains the modelling of the impact of transport activity on the natural environment.
2. EMITRANSYS simulation model
2.1. General characteristics
One of the tools supporting conceptualizing and shaping proecological transport system is the simulation model EMITRANSYS developed by the research team from the Faculty of Transport, Warsaw University of Technology in cooperation with Poznan University of Technology in Poland. The model covers territory of Poland as a whole and enables research on the national transport system in macro-perspective, including road and rail modes, which are decisive in servic-ing land passenger and freight flows. The characteristic feature of the model is the possibility to include emissions of harmful compounds of exhaust gas from various road spark- and self-ignited vehicles. Emission characteristics were obtained by testing in real road conditions.
Pollution emission testing is a complex process and requires spe-cialized tools. There are different methods of conducting tests, but the most general classification divides them into laboratory and in real condi-tion tests (Franco et al. 2013, Jehlik 2008). Proposed simulacondi-tion model includes the results of tests of the emissivity of road transport carried out in real conditions. Series of tests allowed to identify functional depend-encies between the emissions of harmful exhaust compounds and the traffic parameters like speed and type of vehicles (capacity, EURO emis-sion standard, type of fuel).
The EMITRANSYS model was implemented in the VISUM modelling environment, which additionally enables conducting many (standard for this tool) analysis of the impact of transport on the natural environment, including (Jacyna & Wasiak 2014):
‒ emission of air pollutants in accordance with the HBEFA method (The Handbook Emission Factors for Road Transport),
‒ noise emission in accordance with the RLS-90 method (guidelines of the Federal Minister for Transport regarding noise reduction for roads),
or taking into account other original models regarding the impact of transport on the environment.
The EMITRANSYS model consists of transport network, private and public transport modes as well as demand for passenger travel and demand for freight transport.
2.2. Model of transport network
Model of transport network is the fundamental element of EMI-TRANSYS model. At this moment road transport has the largest share in freight transport (about 83%) and passenger transport (about 66%) in Polish transport market. Rail transport takes the second place in this re-spect (about 13% share in freight transport and about 32% share in pas-senger transport) (GUS [Central Statistical Office of Poland] 2014). In line with this fact developed model includes information on the actual course of national and provincial roads, railway lines as well as basic characteristics of their sections. In order to build the model of transport network in EMITRANSYS, it was necessary to map the nodal and line infrastructure of road and railway modes as well as the availability of individual types and means of transport for system users (Figure 1). The model consists of:
‒ road and rail road sections,
‒ nodes representing ends or beginnings of segments, or connecting elements,
‒ nodes mapping essential elements of network (eg places where the characteristics of road change, places where traffic appears and disap-pears or is transformed),
‒ transport regions as well as public transportation nodes and stops, ‒ connections linking transport regions to the transport network and
indicating nodes in which traffic flow units appear and disappear, ‒ turn relations defining possible directions of movement of traffic units
of different types in particular transport nodes, ‒ public transport sections and lines with timetables.
Data inputted into EMITRANSYS model included road routes broken down into sections and nodes, chainage and length of sections, speed limits, load capacity, number of carriageways and lanes, technical road classes, types and parameters of vehicles admitted for traffic, direc-tions of winds and the presence of sound-absorbing screens. In addition, for the purposes of calibrating the traffic model, results of the General Traffic Measurement (Jacyna & Wasiak 2014) were taken into account including: average daily traffic (ADT) and nominal hourly traffic vol-umes. Subsequently, sections of the railway network were characterized
by: railway line class, number of tracks, electrification, maximum speed for passenger and freight traffic, maximum permissible axle load for the locomotive, wagon and electric traction unit, track gauge, destination (passenger, freight, mixed traffic), traffic protection (type of rail traffic control devices), track node capacity, track group capacity.
In addition to the parameterization of the road and rail network, the model implements data on bus timetables for over-distances public transport and data on train timetables.
Fig. 1. Map of the transport network of Poland [Model EMITRANSYS in PTV Visum]
Rys. 1. Sieć transportowa w Polsce [Model EMITRANSYS w PTV Visum]
2.3. Representation of vehicles
The means of road transport for the carriage of passengers are di-vided into: mopeds and motorcycles (st = 1), passenger cars (st = 2), minibuses with 6 to 9 seats (st = 3) and buses with 16 to 45 seats (st = 4) and with more than 45 seats (st = 5). Vehicles for cargo transport include trucks with a wide range of capacities, ranging from delivery vans with a permissible gross weight (PGW) of 3.5 tones to heavy duty vehicles with a PGW up to 24 tonnes (st = 6, ..., std).
In case of passenger rail transport, passenger carriages are classi-fied according to the length of the wagon and class of compartments for travelers to those with a number of seats from 54 to 88. Carriers are pulled by electric and diesel locomotives or are organized into electric traction units. On other hand cargo is transported by wagons with a ca-pacity of 20 to 65 tons were (st = std + 1, ..., ST), depending on the trans-port form and the susceptibility of natural loads as well as the load class of the railway line.
Due to the different impact of particular transport means on the environment, the model additionally takes into account structure of transport means due to:
‒ type of engine and fuel: engines powered by gasoline, ON diesel oil, LPG propane-butane liquid gas, CNG compressed natural gas and a hybrid engines, RS = {1, 2, 3, 4, 5}
‒ European emission standard EURO, NE = {0, 1, 2, 3, 4, 5, 6}.
The model also includes functional relationships describing the emission levels of the following types of harmful substances:
‒ carbon oxide CO, s = 1, ‒ hydrocarbons HC, s = 2, ‒ nitric oxide NO, s = 3, ‒ nitrogen dioxide NO2, s = 4,
‒ particle matters PM, s = 5, ‒ carbon dioxide CO2, s = 6.
The unit emission factors for listed harmful substances were set on the basis of extensive research in real traffic conditions with on-board test equipment for different road segments, vehicle speeds and loads and engine heating characteristics. Emission characteristics were developed at Poznan University of Technology (Merkisz et al. (2014) [0].
2.4. Demand model
The demand model for EMITRANSYS covers demand for pas-senger travels and freight transport between the areas of the network.
The traffic volume in transport network results from the demand for transport services. It is expressed in the amount of goods and number of passengers that in the given period are subjected to deliberate
move-ment. Taking into account the structure of transport means and their av-erage occupancy rates, traffic volume is converted into the number of vehicles of particular types used for carriage. Therefore, the nature of transport tasks in EMITRANSYS simulation model is determined by: the type of transport (cargo or passenger), features or requirements of the transport subject, transport relations, as well as the type of vehicle.
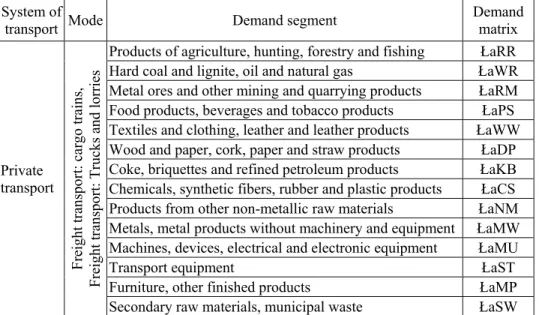
Because the tool was developed in PTV Visum environment, freight transport was modelled in characteristic for this environment way – as s.c. private transport (timetables are not required). The segments of demand for freight transport are related to NST 2007 classification (Table 1).
Table. 1. Relations between transport systems and segments of demand in freight transport in the EMITRANSYS
Tabela 1. Relacje uwzględniające popyt na poszczególne formy transportu to-warowego w EMITRANSYS
System of
transport Mode Demand segment Demand matrix
Private transport Freigh t tran sp or t: cargo train s, Freigh t tran sp ort: Tru ck s and lo rries
Products of agriculture, hunting, forestry and fishing ŁaRR Hard coal and lignite, oil and natural gas ŁaWR Metal ores and other mining and quarrying products ŁaRM Food products, beverages and tobacco products ŁaPS Textiles and clothing, leather and leather products ŁaWW Wood and paper, cork, paper and straw products ŁaDP Coke, briquettes and refined petroleum products ŁaKB Chemicals, synthetic fibers, rubber and plastic products ŁaCS Products from other non-metallic raw materials ŁaNM Metals, metal products without machinery and equipment ŁaMW Machines, devices, electrical and electronic equipment ŁaMU
Transport equipment ŁaST
Furniture, other finished products ŁaMP
Secondary raw materials, municipal waste ŁaSW Source: Jachimowski et al. (2013)
Because the cargos can be carried out both by road and rail, the model mapped the possibility of trans-shipments between these modes. Specified places (existing road-railway transhipment infrastructure) are
adapted to pass the freight traffic (tons) from the road network to the railway network and vice versa.
Passenger transport has been modelled as private transport (for passenger cars) and public transport (inter-regional bus and train connec-tions). Public transport requires specified timetables and communication lines. The model firstly distributes demand to communication lines and next pass the resulted traffic into networks. A passenger demand in the model was segmented according to travel motivations characteristics for transport feasibility studies (Table 2).
Table. 2. Relations between transport systems and segments of demand in passenger transport in the EMITRANSYS model
Tabela 2. Relacje uwzględniające popyt na poszczególne formy transportu pasażerskiego w EMITRANSYS
System of
transport Mode Demand segment Demand matrix
Private
transport Passenger transport: cars
Traveling to work and school PrPS Business purposes PrBI
Other purposes PrIN
Public transport Passenger transport: EC, IC trains IR trains Regional trains (R) Buses Collective transport of people
Traveling to work and school PuPS Business purposes PuBI
Other purposes PuIN
Source: Jachimowski et al. (2013)
2.5. Selected criteria for distribution the traffic and assessment of the environmental impact of transport
For the purpose of distributing the traffic resulting from demand for transport to the transport network in PTV Visum, it is necessary to specify the distribution criteria. The criterion function is used to deter-mine the resistance against the traffic motion in sections and nodes of transport network, turn relations and regions connections. Resistance can be equated with the distance travelled, time of movement and the cost of movement. For the sought-after distribution of traffic value of the resis-tance function in the transport network reaches the extreme (maximum or minimum) value.
EMITRANSYS uses emission of selected pollutants to the envi-ronment and the resulting external costs and/or noise emission as criteria for traffic distribution. The emission characteristics measured in real conditions were implemented as functional relations, in which the inten-sity of harmful compounds emission by types of vehicles depends on traffic velocity. Results of exemplary measurement tests are presented in Fig. 2 in the form of graph of changes in CO2 emission intensity as
a function of vehicle speed and acceleration
Fig. 2. CO2 emissions as a function of instantaneous speed and acceleration of the vehicle (Jacyna et al. 2014a)
Rys. 2. Emisja CO2 w zależności od prędkości i przyspieszenia pojazdu
The emission of noxious exhaust gases depends on the type of ve-hicle, its technical and ecological characteristics, age, condition and driv-ing patterns. In addition, emission level depends on the traffic velocity resulting from traffic intensity and technical condition of infrastructure. Therefore, the formula for emission levels of harmful exhaust gases take into account cofactors depending on the section on which vehicles move and speed. In this perspective, the formula takes the following form (Ja-cyna et al., 2014):
ab ij ab p i, i' st i i b a p st k ne rs i i rs ne st s em i i v i i l rs ne st b a p xp k s ES k s P ST LE E P ST NE RS K S ) ( : )' , ( ) , ( ( ) 6 ) ' , , , , , ( ) ' , ( ) ' , ( ) , , , , , ( 10 3600 ) , ( (kg) (1) where: ) , ( ksES – total emission of harmful component of exhaust gas through the k-th transport subsystem (in kg);
) , , , , , (pab st ne rs
xp – number of s-th type vehicles moving on p-th road in relation (a, b), which meet ne-th emission standard and are equipped with an engine of rs-th type (in vehicles),
) ' , ( ii
l – length of section (i, i') of transport network (in km),
) ' , ( ii
v – traffic flow velocity on section (i, i’) (in km/h),
) ' , , , , , (s st ne rs i i
em – unit emission of s-th harmful compound identified for st-th vehicle equipped with rs-th type of engine that meets ne-th emission standard and moves on section (i, i') of transport network de-termined per unit of distance (in mg/s/vehicle).
Including the dependence of emissions levels on the distance of transport (the shortest trips generate the largest unit emission), the emis-sion is reformulated as follows:
) , , , , , , ( ) ' , ( ) ' , ( ) ' , , , , , ( ) , , , , , ( 10 3600 ) , ( ) ( : )' , ( ) , ( ( ) 6 b a p rs ne st s i i v i i l i i rs ne st s em rs ne st b a p xp k s ES k s ab ij ab p i, i' st i i b a p st k ne rs
P ST LE E P ST NE RS K S (kg) (2) where: ) , , , , , , (s st ners p a b – the influence of distance on unit volume of emis-sion of s-th compound identified for vehicle of st-th type with rs-th type of engine meeting ne-th standard of emission and traveling in (a, b) rela-tion on the p-th route,
Formulas (1) or (2) combined with the volume of transport carried out by all transport subsystems allow to determine the rate of emission efficiency of transport work:
) , ( ) , ( ) , ( ) , ( k s ES k rt L k rt q k s k s
rt
S K RT (tkm/kg, paskm/kg) (3) where: ) , ( ks – emission efficiency of transport work performed by k-th trans-port subsystem in respect of s-th compound (in tkm/t, paskm/t),
) ,
( krt
q – the volume of transport carried out by k-th transport subsystem by rt-th type of transport (in tones or passengers),
) , ( krt
L – average transport distance under the k-th transport subsystem for rt-th transport type (in km),
other symbols as in formula (1).
3. An example of a model application
EMITRANSYS has been used for finding the emissions volumes from passenger and freight transport in Poland in respect of carbon ox-ides (CO), nitrogen oxox-ides (NOx) and hydrocarbons (HC). The time of
transport was assumed as a criterion for traffic distribution to the trans-port network of Poland. Research was based on demand and structure of vehicles from 2015 as well as the demand and structure of vehicles ac-cording to forecasts for 2025. Due to the available data to calibrate the model, 2015 was considered as a base year.
Analyses included passenger cars (private vehicles), buses, deliv-ery trucks and lorries and rail transport vehicles (used for passenger and cargo traffic distribution, but omitted in estimation of harmful com-pounds emission due to the different nature of energy production). On account of different emissivity from vehicles of various types data on the structure of vehicles in terms of emission standards (Euro 0 – Euro 6) and type of fuel were included. In this way, data on the emission of harmful exhaust gases from road vehicles used to transport cargo and passengers in the Polish transport system were obtained.
Functional relationships integrated in EMITRANSYS model en-abled estimation of CO, NOx and HC emission volumes by particular
type. After decomposing passenger and cargo streams onto transport network segments, the emission level of harmful exhaust compounds was estimated on particular sections of road network in Poland. Results ob-tained for 2015 and 2025 are shown in Figures 3-4.
Fig. 3. The volume of emissions of subsequent compounds in 2015 by: a) passenger transport, b) freight transport [Model EMITRANSYS] Rys. 3. Poziom emisja substancji szkodliwych w 2015 roku generowanych przez: a) transport pasażerski, b) transport towarowy
Fig. 4. The volume of emissions of subsequent compounds in 2025 by: a) passenger transport, b) freight transport [Model EMITRANSYS] Rys. 4. Poziom emisja substancji szkodliwych w 2025 roku generowanych przez: a) transport pasażerski, b) transport towarowy
a) b)
The projected increase in transport system emissivity for selected exhaust gas compounds in 2025 is presented in Table 3. These changes were estimated on the base of emissions expressed in g/km in relation to the base year 2015.
Table 3. Changes in emission of harmful exhaust gases from road transport in 2025 in relation to 2015
Tabela 3. Poziom emisji substancji szkodliwych w 2025 w odniesieniu do 2015
Exhaust gas compound Increase in emissions compared to 2015
CO 29.277%
HC 26.062%
NOx 27.405%
Obtained results indicate an increase in emissions of all harmful compounds from investigated transport system in 2025. This is due to the forecasted increase in demand for transport services, with assumed posi-tive (pro-ecological), but not significant change in the structure of vehi-cles (emission standards) at once.
Importantly, the structure of vehicle stock adopted in studies did not assumed plausible introduction of future emission standards and sig-nificant development of zero-emission vehicle market (electric and hy-brid drive). The last included standard was EURO 6 staying in force from 2014. It becomes clear that implementation of these changes is indispen-sable so that forecasted development of individual motorization and col-lective transport as well as freight transport was not coming along with the significantly increase of air pollution by road transport.
4. Conclusion
Due to some shortages in transport infrastructure development, and law issues, still a lot of potential is in the area of pro-ecological im-provement of national transport system in Poland. As a consequence, apart from searching for low-emission drives, it is necessary to research the impact of construction and modernization of transport infrastructure elements as well as organizational changes in transport (including legisla-tive solutions) on emissivity of harmful exhaust. One of the important conditions for the reliability of these researches is mapping the emissivity
of harmful exhaust gas compounds, so that it is close to the real situation noted on the road under operating conditions.
The EMITRANSYS simulation model described in the paper is an attempt to answer the questions posed by transport decision makers that deal with pro-ecological solutions. Both the mathematical model and its implementation in PTV VISUM are tools supporting decisions on the development of a pro-ecological transport system at the operational and strategic level. These decisions may concern, modernization of infra-structure, traffic reorganization or legislative constrains. Thanks to the implementation of a model, the simulative assessment of the impact of development decisions and legislative conditions on the pollution of the environment is possible. It takes also into account functional dependen-cies between technical and organizational consequences of these deci-sions and the level of emission of harmful exhaust gases.
At the same time, taking into account expected changes in the ge-neric structure of vehicle stock in terms of their importance in meeting current and forecasted transport needs, the developed model enables identification of expected impact of road transport on the environment for various scenarios of the development of the transport system. It can be also used to identification noise issues – especially in smaller scale and support city logistics in steering traffic in city condition.
References
Ambroziak, T., Gołębiowski, P., Pyza, D., Jacyna-Gołda, I., Merkisz-Gura– nowska, A. (2013). Identification and Analysis of Parameters for the Areas of the Highest Harmful Exhaust Emissions in the Model EMITRANSYS.
Journal of KONES, 20(3), 9-20.
Chiqueto, S., Mackett, R. (1995). Modelling the effects of transport policies on air pollution. The Science of The Total Environment, 169, 265-271.
Colvile, R.N., Hutchinson, E.J., Mindell, J.S., Warrena, R.F. (2001). The trans-port sector as a source of air pollution. Atmospheric Environment, 35(9), 1537-1565.
Franco, V., Kousoulidou, M., Muntean, M., Ntziachristos, L., Hausberger, S., Dilara, P. (2013). Road vehicle emission factors development: a review.
Atmospheric Environment, 70, 84-97.
Gołębiowski, P., Jachimowski, R., Lewczuk, K., Szczepański, E., Wasiak, M. (2013). Uwarunkowania prawne kształtowania proekologicznego systemu transportowego, Prace Naukowe Politechniki Warszawskiej. Transport, 97, 135-145.
GUS. (2014). Transport – wyniki działalności w 2013 r. Warszawa: GUS. IOŚ (2011). Zanieczyszczenie powietrza w Polsce w 2009 roku na tle
wielole-cia. Warszawa: Inspekcja Ochrony Środowiska [powietrze.gios.gov.pl]
Jachimowski, R., Kłodawski, M., Lewczuk, K., Szczepański, E., Wasiak, M. (2013). Implementation of the model of proecological transport system.
Journal of KONES, 20(4), 129-139.
Jacyna, M., Lewczuk, K., Szczepański, E., Gołębiowski, P., Jachimowski, R., Kłodawski, M., Pyza, D., Sivets, O., Wasiak, M., Żak, J., Jacyna-Gołda, I. (2015). Effectiveness of national transport system according to costs of
emission of pollutants, W: Nowakowski, T. Et al. (ed.), Safety and
Reli-ability: Methodology and Applications, 559-567.
Jacyna, M., Wasiak, M. (red.). (2014). Simulation model to support designing a
sustainable national transport system. Warszawa: Index Copernicus
Inter-national.
Jacyna, M., Wasiak, M., Jacyna-Gołda, I., Pyza, D., Merkisz-Guranowska, A., Merkisz, J., Lewczuk, K., Żak, J., Pielecha, J. (2014a). A holistic approach
to modelling of the ecological domestic transport system. Conference
Ma-terials XVIII Congreso Panamericano de Ingeniería de Tránsito, Transporte y Logística (PANAM).
Jacyna, M., Wasiak, M., Lewczuk, K., Karoń, G. (2017). Noise and environ-mental pollution from transport: decisive problems in developing ecologi-cally efficient transport systems. Journal of Vibroengineering (JVE), 19(7), 5639-5655.
Jacyna, M., Wasiak, M., Lewczuk, K., Kłodawski, M. (2014b). Simulation model of transport system of Poland as a tool for developing sustainable transport. Archives of Transport, 31(3), 23-35.
Jacyna-Gołda, I, Żak J., Gołębiowski, P. (2014). Models of traffic Flow distri-bution for scenarios of the development of proecological transport system.
Archives of Transport, 32(4), 17-28.
Jehlik, H. (2008). Challenge X 2008 – hybrid powered vehicle on-road
emis-sions findings and optimization techniques: a 4 year summary. Sensors 5th
Annual SUN (SEMTECH User Network) Conference.
Korzhenevych, A., Dehnen, N., Bröcker, J., Holtkamp M., Meier H., Gibson G., Varma, A., Cox, V. Update of the Handbook on External Costs of
Trans-port. Final ReTrans-port. Report for the European Commission. DG MOVE
Ri-cardo-AEA/R/ ED57769 Issue Number 1, Jan 2014.
Merkisz, J. (2014). Combustion engines development and real driving emis-sions. Journal of KONES, 21(2), 209-219.
Merkisz, J., Jacyna, M., Merkisz-Guranowska, A., Pielecha, J. (2014). The pa-rameters of passenger cars engine in terms of real drive emission test.
Ar-chives of Transport, 32(4), 43-50.
Vaitiekūnas, P., Banaitytė, R. (2007). Modeling of motor transport exhaust pol-lutant dispersion. Journal of Environmental Engineering and Landscape,
15(1), 39-46.
Problemy decyzyjne kształtowania
proekologicznego systemu transportowego
Streszczenie
Systemy transportowe mają kluczowe znaczenie dla funkcjonowania gospodarki oraz rozwoju społeczeństwa. Ze względu na stały wzrost skali przewozów, krytyczny stał się także sposób oddziaływania transportu na śro-dowisko naturalne oraz zdrowie człowieka. Aspekty proekologiczne są więc niezbędnymi czynnikami projektowymi, które mają swoje odzwierciedlenie w konstrukcji pojazdów i infrastruktury transportowej, a także w mechanizmach planowania, organizacji i regulacji prawnej przewozów.
Szczególnie istotne jest zanieczyszczenie środowiska wynikające z wy-korzystania mobilnych źródeł emisji szkodliwych związków spalin takich jak samochody ciężarowe i pasażerskie z silnikami spalinowymi wszystkich rodza-jów, a także środki transportu kolejowego oraz innych gałęzi transportu. Zanie-czyszczenie wynikające z wykorzystania silników spalinowych przekłada się na emisję szkodliwych składników spalin, a w szczególności tlenku węgla CO,
węglowodorów HC, tlenku azotu NO, dwutlenku azotu, NO2, cząstek stałych
o różnych rozmiarach PMx i dwutlenku węgla CO2. Do tego dochodzi hałas
i wibracje, zanieczyszczenie gleby i wód oraz fragmentacja środowiska.
Zmniejszanie tych negatywnych czynników przy jednoczesnym wzro-ście wielkości przewozów pasażerskich oraz towarowych wymaga opracowania nowych rodzajów środków transportu i metod organizacji transportu, które są przedmiotem tego artykułu.
W artykule podjęto tematykę proekologicznego kształtowania syste-mów transportowych kolejowo-drogowych realizujących przewozy pasażerskie oraz przewozy towarowe w skali kraju. Przedstawiono podstawowe czynniki wpływające na rozwój systemu transportowego i jego wpływu na środowisko, omówiono ich wpływ oraz sposoby modelowania.
Przedstawiono autorski model EMITRANSYS zbudowany w środowi-sku PTV VISUM, służący do modelowania działania i rozwoju systemów transportowych w dużej skali z uwzględnieniem emisji szkodliwych związków
spalin oraz hałasu. Omówiono cechy narzędzia i możliwość jego wykorzysta-nia. Następnie przedstawiono składowe modelu: model sieci transportowej (drogowej i kolejowej) wraz z charakterystyką odcinków sieci i punktów wę-złowych umożliwiających zmianę rodzaju transportu (komodalność) oraz rejo-nów, model popytu na przewozy towarowe oraz model popytu na przewozy pasażerskie. Model popytu na przewozy towarowe został przygotowany w oparciu o klasyfikację NST ładunków, zaś model popytu na przewozy pasa-żerskie został oparty oparto o typowe dla studiów wykonalności w transporcie podziały motywacji podróży.
Sieć transportowa kolejowa i drogowa działają równolegle i obciążane są tymi samymi potokami ruchu. Decyzja o wyborze rodzaju transportu oraz drogi w sieci (rozłożenie potoku ruchu) jest symulowana w PTV VISUM zgod-nie z zadanym kryterium. W tym przypadku kryterium wielkości emisji przy jednoczesnej realizacji zadanych zadań przewozowych.
Następnie omówiono tabor realizujący przewozy w transporcie drogo-wym pasażerskim i towarodrogo-wym oraz w transporcie kolejodrogo-wym wraz z rodzaja-mi silników, stosowanego paliwa i norm erodzaja-misji EURO. Na tej podstawie omó-wiono formalny model matematyczny minimalizujący emisję szkodliwych związków spalin w funkcji rozłożenia potoku ruchu na sieć. Do kalibracji mo-delu wykorzystano wyniki Generalnego Pomiaru Ruchu (2015), aproksymowa-ne na rok 2020.
Artykuł kończy się analizą przypadku dla sieci transportowej Polski oraz wnioskami.
Abstract
Transport systems are of key importance for functioning of the economy and development of society. Due to the constant increase in transport volumes, the impact of transport on the natural environment and human health has also become critical. The pro-ecological aspects are therefore indispensable design factors that reflected in the construction of vehicles and transport infrastructure as well as in the planning, organization and legal regulation of transport.
The environmental pollution resulting from mobile sources of harmful compounds of exhaust gases such as trucks and passenger cars with combustion engines of all kinds, as well as means of railway transport and other modes of transport are of particular importance. The pollution resulting from internal combustion engines use translates into the emission of harmful exhaust compo-nents, in particular carbon monoxide CO, hydrocarbons HC, nitrogen oxide NO,
nitrogen dioxide, NO2, particulates of various sizes PMx and carbon dioxide
CO2. Additionally, the noise and vibration, soil and water pollution, and
Reducing these negative factors while increasing the volume of passen-ger and freight transport requires development of new types of vehicles and methods of organization, which are the subject of this paper.
The paper discusses pro-ecological shaping of rail and road transport systems for passenger and freight transport in the scale of country. The basic factors influencing the development of transport system, their impact on the environment and way of modelling are discussed.
The original model EMITRANSYS developed in the PTV VISUM en-vironment was presented. The model is used for modeling of operation and development of large-scale transport systems with regard to emission of harmful exhaust compounds and noise. The features of the tool and application possibili-ties are discussed. Next, the components of the model are presented: model of transport network (road and rail) along with the characteristics of network sec-tions and nodal points enabling changing the type of transport (commodality) and regions, the demand model for freight transport and demand model for pas-senger transport. The demand model for freight transport was based on the NST classification of loads, and the demand model for passenger transport was based on the divisions of travel motivation typical for transport feasibility studies.
The railway and road transport network operate in parallel and are loaded with the same traffic flows. The decision about choosing the type of transport and the route in the network (distribution of the traffic flow) is simulated in PTV VISUM according to the given criterion. In this case, the criterion is the emission volume and simultaneous implementation of the set transport tasks.
Then, the rolling stock in passenger and freight road transport and rail transport, the types of engines, fuel used and EURO emission standards were discussed. On this basis, a formal mathematical model that minimizes the emis-sion of harmful exhaust compounds as a function of the distribution of traffic flow to the network is discussed. The results of the General Movement Meas-urement (2015), approximated for 2020, were used to calibrate the model.
The article ends with an analysis of the case for the transport network of Poland and conclusions.
Słowa kluczowe:
Model EMITRANSYS, system transportowy, transport a środowisko, symulacja, emisja szkodliwych związków spalin
Keywords:
EMITRANSYS model, transport system, transport and environment, simulation, emission of harmful exhaust compounds
![Fig. 1. Map of the transport network of Poland [Model EMITRANSYS in PTV Visum]](https://thumb-eu.123doks.com/thumbv2/9liborg/3132592.9373/6.723.202.545.308.607/fig-map-transport-network-poland-model-emitransys-visum.webp)