ABSTRACT: The paper presents the assessment results of the implementation of Poland's national sustainable development goals from 2010 to 2019. For this purpose, a synthetic index (National Sus- tainability Index) was designed using taxonomic methods. The study sought answers to the following questions: What is Poland's general level of accomplishment of sustainable development goals? What were the dynamics of changes in respective years? Which plans require special attention and actions in the coming years? Considering the possible range of the NSI, a significant improvement in accom- plishing Poland's national sustainable development goals was observed in the surveyed years. Never- theless, some areas still need intervention at the decision-making level, contributing to further balancing Poland's economic growth and development paths. The analysis's added value is the syn- thetic measure designed based on 76 specific indicators and the evaluation of sustainable develop- ment in Poland over ten years.
KEYWORDS: sustainable development goals, taxonomic methods, synthetic index, Poland, dynamic analysis
Armand Kasztelan (ORCID: 0000-0002-1947-9846) University of Life Sciences in Lublin
Correspondence address:
Akademicka 13, 20-950 Lublin, Poland e-mail: armand.kasztelan@up.lublin.pl
Armand KASZTELAN
NATIONAL SUSTAINABILITY INDEX AS A TOOL FOR EVALUATING THE IMPLEMENTATION OF SUSTAINABLE DEVELOPMENT GOALS IN POLAND IN 2010-2019
JEL: O44, Q56, Q58 No. 3(82) 2022 • pages: 150-172 DOI: 10.34659/eis.2022.82.3.481
EKONOMIA I ŚRODOWISKO 3 (82) • 2022 Studies and materials
151
DOI: 10.34659/eis.2022.82.3.481
Introduction
It has been 35 years since the concept of sustainable development (SD) was incorporated into the international public debate. The new economic doctrine was summarised in the first sentence of the Brundtland Report 1987 – “Our Common Future” as a development that meets the needs of the present without compromising the ability of future generations to meet their own needs (United Nations, 1987).
Some critics claim that it was only a coined slogan that could be followed up by the first ‘green’ political fractions and leaders of the Third World coun- tries in which facing social and economic problems was a priority. The for- mula was unclear, but details could be left for later. Nevertheless, it was indis- putably the rise of the concept of sustainable development (Bâc, 2008; Bart- lett, 2006; Benton, 1994).
The number of publications tackling the topic of sustainable develop- ment increased significantly over the past 20 years. Associated papers mainly focused on: the essence and origin of the concept (Lawn, 2001; Strange &
Bayley, 2008; Waas, 2011; Janousková et al., 2019; Ruggerio, 2021; Bellantu- ono et al., 2022); barriers to and conditions for its implementation (Nasibu- lina, 2015; Raszkowski & Bartniczak, 2019; Mio et al., 2020; Berchin et al., 2021; Otamendi-Irizar et al., 2022; Bonnedahl et al., 2022); planning, includ- ing formulating sustainable development strategies at various management levels (United Nations, 2015; Wang et al., 2015; Allen et al., 2016; Grainger- Brown & Malekpour, 2019; Qu et al., 2020; Guan et al., 2021; Zhou et al., 2022); promoting best practices and models in implementing SD (Charrouf &
Guillaume, 2009; Häikiö, 2014; Ross, 2018; Bin Mohd Yusof & Ariffin, 2020;
Baba Ali et al., 2021; Gusheva et al., 2022) and relationships between sustain- able development and various socio-economic concepts and phenomena (Bina, 2013; Olsson et al., 2014; Kasztelan, 2017; Corona et al., 2019; Dogaru, 2020; Belmonte-Ureña, 2021; Panchal, 2021; Zargartalebi, 2021; Rodrí- guez-Antón et al., 2022). Much attention was also devoted to monitoring and evaluating the implementation of sustainable development goals (SDG) (Radojicic et al., 2012; Waas et al., 2014; Bujanowicz-Haraś et al., 2015; Gui- jarro & Poyatos, 2018; Mair et al., 2018; Megyesiova & Lieskovska, 2018; Bar- bier & Burgess, 2019; Popović, 2019; Raszkowski & Bartniczak, 2019a, b;
Bova & Śleszyński, 2020; Lafortune et al., 2020; European Commission, 2021;
Guan et al., 2021; Adrangi & Kerr, 2022; Gunnarsdottir et al., 2022).
The above summary shows that issues related to sustainable develop- ment remain a constant concern for science, policy and economic practice, and one of the critical areas of research is tools for assessing the achievement of SD goals. A comprehensive system for evaluating the related measures
DOI: 10.34659/eis.2022.82.3.481
must be created to implement the assumptions of sustainable development at various decision-making levels. The multiple dimensions of sustainable development goals described using various indicators necessitate applying a synthetic tool to allow a precise evaluation of progress in the journey towards sustainable development.
This paper aims to satisfy these needs. The study evaluated the accom- plishment of Poland’s national sustainable development goals from 2010 to 2019. The National Sustainability Index (NSI) was designed and empirically verified using taxonomic methods. The analyses responded to the following questions: What is Poland’s general level of accomplishment of sustainable development goals? What were the change dynamics in respective years?
Which SD goals require special attention and activity in the coming years?
The added value of the analyses is that a comprehensive tool was created for evaluating SD in Poland, which was preceded by selecting as many as 76 spe- cific indicators representing all 17 sustainable development goals. Secondly, the study covered 2010 to 2019, so this is the widest time perspective con- sidering previous analyses in this scope.
The paper is organised as follows. The starting point will be a literature review on the goals, methods of measurement, and results of evaluating sus- tainable development, focusing on previous studies in this area conducted in Poland. The following chapter describes research methods, including design- ing the national sustainability index. The next section of the study presents the synthetic index results to evaluate national sustainable development goals in Poland and identifies potential directions for further research. The final part presents conclusions from the analyses.
Literature review
Over a few dozen years, the sustainable development goals evolved from a one-factor goal of sustainable use of animal and plant resources, through the Millennium Development Goals (MDG) focusing on poverty, to the pres- ent comprehensive and universal SD goals (Kasztelan et al., 2021).
In the initial period of agricultural management, people were fully aware of the limited regeneration of natural resources. At that time, the main issue was ecological sustainability aiming to ensure rational use of natural resources and natural environment protection (Lele, 1991). The global Mil- lennium Development Goals, established at the UN Summit in 2000, included eradicating extreme poverty and hunger, achieving universal primary educa- tion, and promoting gender equality (Asadullah & Savoia, 2018). Based on the MDG experience, in 2015, the United Nations Organization adopted,
EKONOMIA I ŚRODOWISKO 3 (82) • 2022 Studies and materials
153
DOI: 10.34659/eis.2022.82.3.481
under the so-called Agenda 2030, a new set of sustainable development goals (SDG) (United Nations, 2015).
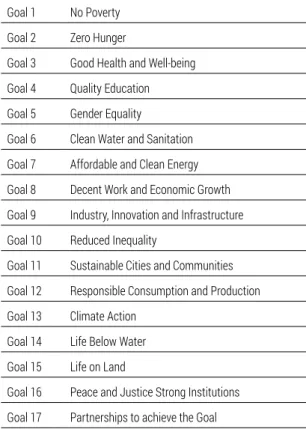
At the heart of the Agenda 2030 for Sustainable Development there are five critical themes known as the 5P’s: people, planet, prosperity, peace and partnerships, making up 17 Sustainable Development Goals (Table 1) and their 169 specific targets that should be the guiding principles for all regions, including developed and developing countries over the next 15 years (Muff, 2017). The transition from MDG (2000-2015) to SDG (2015-2030) reflects the latest evolution of the sustainable development discourse. Close compli- ance between global and national frameworks of sustainable development can be seen as proof that global goals have a (specific) impact at the national level and, at the same time, that sustainable managing development through objectives is effective (de Jong & Vijge, 2021).
Along with the evolution of sustainable development goals, a question arose about measuring the progress and efficiency of the undertaken activi- ties. Reliable, correctly selected, and current data concerning SD is a signifi- cant element for shaping development strategies and using instruments to boost changes in that respect. Creating a uniform and, at the same time, a comprehensive set of indicators for evaluating the progress towards sus- tainable development is a difficult task due to the complexity of the concept itself. Most authors agree that the hands should be based on strict criteria, should be repeatable, generally acceptable and easily understandable (Balm- ford et al., 2005; Cornescu & Adam, 2014). Mair et al. (2018) indicated that the indicators of sustainable development, despite their defects, provide an opportunity for qualitative analysis, so they can play a helpful role in imple- menting SDG.
Progress measurement is an integral part of the EU’s Sustainable Devel- opment Strategy. In order to ensure consistency of methods and comparabil- ity of countries, the indicators are calculated by Eurostat, based on primary data from national statistics. In some instances, the indicators reported by respective countries can differ from those presented in Eurostat’s database (Urbaniec, 2015).
Radojicic and Isljamovic (2012), based on 11 SG indicators that, in their opinion, are essential, and using the I-distance method, designed a synthetic measure of sustainable development for 27 countries of the European Union.
The outcomes of their study show that in 2009 Sweden and Denmark were countries that were the most advanced in implementing sustainable develop- ment. New EU member states, such as Latvia, Hungary, Estonia, Lithuania and Slovakia, ranked at the other end.
DOI: 10.34659/eis.2022.82.3.481
Table 1. Sustainable development goals
Goal 1 No Poverty Goal 2 Zero Hunger
Goal 3 Good Health and Well-being Goal 4 Quality Education Goal 5 Gender Equality
Goal 6 Clean Water and Sanitation Goal 7 Affordable and Clean Energy Goal 8 Decent Work and Economic Growth Goal 9 Industry, Innovation and Infrastructure Goal 10 Reduced Inequality
Goal 11 Sustainable Cities and Communities Goal 12 Responsible Consumption and Production Goal 13 Climate Action
Goal 14 Life Below Water Goal 15 Life on Land
Goal 16 Peace and Justice Strong Institutions Goal 17 Partnerships to achieve the Goal
Source: author’s work based on (United Nations, 2015, p. 14).
In 2015, the team under the management of B. Bujanowicz-Haraś (2015) published the evaluation results of the level of sustainable development for 28 EU countries from 2011 to 2013. The study’s authors designed a synthetic measure based on Hellwig’s development model. This method allowed a comprehensive evaluation of the studied phenomenon based on which the member states were assigned to four uniform groups according to similari- ties in the level of development. Group I, with the highest level of sustainable development, included Sweden, Luxembourg, Slovenia, Denmark, Austria and Finland. By contrast, group IV was Portugal, Bulgaria, Romania and Hun- gary.
Guijarro and Poyatos (2018) used the Goal Programming model to design a synthetic SDG indicator capable of overcoming some limitations related to the application of arithmetic and geometric means. The model was used for evaluating the level of sustainable development in EU-28, placing Austria and Luxembourg at the top while Greece and Romania at the bottom of the rank- ing.
EKONOMIA I ŚRODOWISKO 3 (82) • 2022 Studies and materials
155
DOI: 10.34659/eis.2022.82.3.481
Popovic et al. (2019) also assessed sustainable development in the EU. By using ward’s clustering method, the EU countries were assigned to four rela- tively uniform groups based on 37 indicators. The first group (cluster 1) con- sisted of highly-developed European countries making a uniform, best-per- forming group in terms of sustainable development indicators (health care, biggest investment in research and development, information technology and environmental protection). The two poorest countries in the EU – Roma- nia and Bulgaria – were assigned to the second cluster and placed at the very bottom of the ranking, leaving behind in terms of economic, social and envi- ronmental indicators of sustainable development. The third cluster was com- posed of Eastern European countries, and the fourth comprised countries of Southern Europe and Ireland. According to the presented study outcomes, Central European countries were in a better position than those from South- ern Europe as the latter featured a higher percentage of the population at the risk of poverty, higher rate of unemployment, lower increase in GDP per cap- ita, as well as poor results in the information technology sector and environ- mental protection.
By contrast, Raszkowski and Bartniczak (2019b) examined the level of implementation of the concept of sustainable development in countries of Central and Eastern Europe from 2010 to 2016. Their survey relied on 66 indicators monitoring the accomplishment of the global sustainable develop- ment goals; for each of the analysed countries, the value of the synthetic measure of sustainable development (SMD) in respective years. The situa- tion of all the countries was found to have improved in the analysed period.
Nevertheless, none of the surveyed countries was included in the group fea- turing an advantageous situation in that area. Slovenia and the Czech Repub- lic were close to achieving this in 2016, but ultimately, they remained in the moderate group together with Estonia, Hungary, Slovakia, Poland, Lithuania, Latvia and Croatia. The worst situation throughout the analysed period was noted in Bulgaria and Romania.
Good data and clear indicators are necessary for every country to evalu- ate its position, devise ways to achieve its goals and track progress (Lafortune et al., 2020). A theoretical description of each indicator accentuates its pros and cons, highlighting that no indicator is perfect and can provide a complete picture of sustainable development. Therefore, to evaluate sustainable devel- opment aptly, various indicators should be analysed. The respective coun- tries were left with the freedom to shape their national sets of sustainable development indicators in compliance with the standard framework.
Progress at a global and regional level is evaluated using a set of so-called global indicators (SDG indicators). Values for the whole world and its regions are calculated by international organisations, mainly based on official statis- tics from respective countries. At the national level, in place of global indica-
DOI: 10.34659/eis.2022.82.3.481
tors, governments can use their own sets of hands, allowing the monitoring of areas and problems that are the most important for the specific country.
Such a solution was adopted in Poland. Indicators for national priorities were made available for the first time in 2018. Due to development works, the set was updated and linked more closely with the national priorities related to SDG (Statistics Poland, 2022a).
Previously, the progress of Poland in its journey towards sustainable development was primarily recorded in reports prepared by Statistics Poland (GUS). The first of them was issued in September 2020 on the fifth anniver- sary of adopting Agenda 2030. The publication referred to progress in accom- plishing goals and tasks agreed upon at the international level. The analysis relied on indicators adopted by international bodies for monitoring how common challenges were handled. Changes in Poland (compared with the EU) were analysed using hands selected by Eurostat for evaluating the imple- mentation of the EU’s priorities related to sustainable development. The report only allows a general, partial analysis (Statistics Poland, 2022b). In 2021 the second edition of the information was issued with the scope limited to inclusive economic growth, including eliminating regional and social ine- quality. It was a synthetic report, so the issues presented therein and the scope of their analysis did not exhaust the complex and multifaceted topic of inclusive growth (Statistics Poland, 2022c).
Also, Teneta-Skwiercz (2018) presented a selective approach to measur- ing sustainable development. The author evaluated four subjectively selected SD indicators, i.e., the risk of permanent poverty, the productivity of resources, renewable energy share in the gross final energy consumption and the level of confidence towards public institutions. She used two types of analysis:
static for international comparison between the member states of the Euro- pean Union pertaining to the year 2015, and dynamic – years from 2008 to 2015 or from 2008 to 2016 for Poland. Based on international comparisons, she concluded the low position of Poland in terms of all the analysed indica- tors compared with other EU member states. By contrast, studies conducted at the national level identified positive trends in the value of the analysed indicators.
Raszkowski and Bartniczak (2019) presented the results of analyses of selected indicators used for monitoring the implementation of sustainable development goals at the national level. The survey covered the period from 2010 to 2016. Research methods comprised dynamic analysis, i.e., individual indicators of dynamics. In addition, the mean rate of respective changes in time was determined. To conclude, the authors mentioned above perceived SD implementation status in the surveyed years as satisfactory. For 57 out of 73 analysed indicators, the direction of expected change was determined as
EKONOMIA I ŚRODOWISKO 3 (82) • 2022 Studies and materials
157
DOI: 10.34659/eis.2022.82.3.481
positive, which implies that the country was on the right path towards sus- tainable development.
In contrast, Rybak and Włodarczyk (2021) analysed the implementation of sustainable development goals only to the extent of available and clean energy in Poland, that is, based on: dependence on energy imports by prod- uct, energy efficiency, renewable energy share in the gross final energy con- sumption by sector, and final energy consumption in households per capita.
This allowed identifying the current implementation level of the goals and forecasting the achievement of the adopted goals by 2030.
Dziekański et al. (2021) examined spatial differentiation of development relationships, natural environment and ecology in Polish districts using a synthetic measure. The selection of 40 variables was determined by the available data from Statistics Poland about the period from 2010 to 2019.
The results of the analyses point to a positive correlation between the meas- ure of district development and the quality of the natural and ecological envi- ronment. A higher level of a district’s growth is associated with a lower rate of its natural habitat.
The above-presented analyses were predominantly based on the evalua- tions of changes in the selected indicators in time, while every hand was con- sidered individually. Secondly, sustainable development assessments in Poland were based mainly on indicators describing global goals, which allowed the authors to conduct international comparative analyses. Consid- ering the limitations above and thus an existing research gap, a comprehen- sive assessment of sustainable development in Poland relied on a synthetic index based on indicators for national SD priorities (Statistics Poland, 2022d).
Research methods
Designing a synthetic index is a complex task with several alternative stages affecting the quality and reliability of the outcome. The main problems in this approach refer to selecting a theoretical framework, access to data, selecting the most representative indicators and processing them for com- parison and aggregation purposes. The stages of designing a synthetic meas- ure are broadly described in the scientific literature (Organisation for Eco- nomic Co-operation and Development, 2008; Piotrowska & Roszkowska, 2011; Mazziotta & Pareto, 2013; Piwowarski et al., 2018).
Recently, synthetic indices have been a response to the emergence of Agenda 2030. These were, for example, SDG indices designed by the Sustain- able Development Solutions Network (Diaz-Sarachega et al., 2018). This solution assumes that sustainable development goals are aggregated using the arithmetic of the mean only, which is a compensatory technique. In con-
DOI: 10.34659/eis.2022.82.3.481
trast, experts recommend non-compensatory aggregation (Guzowska &
Kryk, 2020; Petkovová et al., 2020).
Within the research framework, the synthetic NSI index was designed based on the following algorithm (Mazziotta & Pareto, 2013):
1) Defining the phenomenon for measurement. The definition of a notion should clearly explain what is measured by the synthetic index. The phe- nomenon subject to size will be the sustainable development of Poland from 2010 to 2019.
2) Selecting the set of individual indicators. The synthetic index was designed based on indicators for national sustainable development goals available on the National Reporting Platform – SDG (Statistics Poland, 2022d). The guiding principle was to use as many indicators as possible for which complete data about the period from 2010 to 2019 was availa- ble. Ultimately, 76 individual indicators were selected for analysis (Annex 1). Their values (Xj, j=1, 2, ...,m) for respective years (Yi, i=1, 2, ...,n) were presented as an observation matrix (1):
(1)
3) Standardisation of individual indicators. This step ensures that the indi- cators are comparable. Standardisation is required prior to data aggrega- tion since indicators in the data set often come with different units of measure. Therefore, it is necessary to standardise the indicators by trans- forming them into bare, dimensionless quantities. Another reason for standardisation is that certain indicators (so-called stimulants) can be positively correlated with the measured phenomenon (positive ‘polar- ity’). In contrast, others (so-called destimulants) can be negatively corre- lated (negative ‘polarity’). Standardisation ensures that the increase in standardised indicators corresponds to a rise in the synthetic index. This operation can be performed in several ways. One of them is the min-max method (known as the ‘zero unitisation method’ in Poland) used in this study (Petkovová et al., 2020; Kryk & Guzowska, 2021):
• for stimulants:
(2)
= ⋯
⋮ ⋱ ⋮
⋯
.
(1)= ( ()
) () , (2)
= ( ()
) () , (3)
= , (4)
=
, (5)
= ∑ (
− ). (6)
= (1 − ). (7)
= ⋯
⋮ ⋱ ⋮
⋯
.
(1) = ( ()
) () , (2)
= ( ()
) () , (3)
= , (4)
=
, (5)
= ∑ ( − ). (6)
= (1 − ). (7)
EKONOMIA I ŚRODOWISKO 3 (82) • 2022 Studies and materials
159
DOI: 10.34659/eis.2022.82.3.481
• for de-stimulants:
(3)
where:
zij – the normalised value of the j-th variable in the i-th year xij – the initial value of the j-th variable in the i-th year.
The selected method was the only one to fulfil all the seven postulates formulated with reference to the use of normalisation formulas (Jarocka, 2015). Diagnostic features standardised as described above assume values in the range [0; 1]. The closer the value to one, the better the situation in terms of the analysed feature, and the closer to zero, the worse the situation is.
4) Aggregation of normalised indicators. All the components are combined into one or more composite indicators (synthetic indices). Here, the nor- malised variables provided the basis for calculating the median (formu- las (4) and (5)) and standard deviation (6) for each surveyed year. The median was determined according to the formula (Strahl, 2006; Grzebyk
& Stec, 2015):
(4) for an even number of observations, or:
(5)
for an odd number of observations, where:
zi(j) – the j-th statistical ordinal for the vector (zi1, zi2, …, zim), i = 1, 2, …, n; j = 1, 2, …, m.
In turn, the following formula was used for calculating the standard devi- ation:
(6)
= ⋯
⋮ ⋱ ⋮
⋯
.
(1)= ( ()
) () , (2)
= ( ()
) () , (3)
= , (4)
=
, (5)
= ∑ ( − ). (6)
= (1 − ). (7)
= ⋯
⋮ ⋱ ⋮
⋯
.
(1) = ( ()
) () , (2)
= ( ()
) () , (3)
= , (4)
=
, (5)
= ∑ (
− ). (6)
= (1 − ). (7)
= ⋯
⋮ ⋱ ⋮
⋯
.
(1) = ( ()
) () , (2)
= ( ()
) () , (3)
= , (4)
=
, (5)
= ∑ (
− ). (6)
= (1 − ). (7)
= ⋯
⋮ ⋱ ⋮
⋯
.
(1)= ( ()
) () , (2)
= ( ()
) () , (3)
= , (4)
=
, (5)
= ∑ (
− ). (6)
= (1 − ). (7)
EKONOMIA I ŚRODOWISKO 3 (82) • 2022 Studies and materials
160
DOI: 10.34659/eis.2022.82.3.481
Finally, based on the median and standard deviation, NSI’s were designed for each year:
(7)
Results of the research
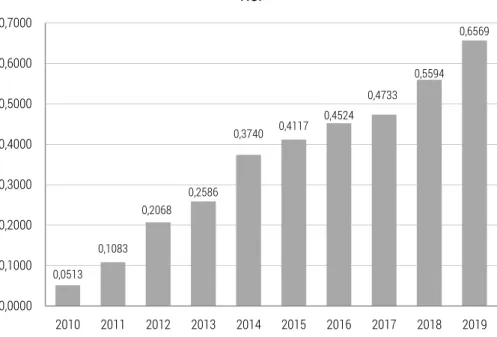
Figure 1 presents the results of calculations of the national sustainability index (NSI) for Poland from 2010 to 2019 (CI). In the surveyed period, a dynamic increase was observed in the level of sustainability of socio-eco- nomic processes in Poland, notably during the past two years. This means that the implementation of the national SD priorities accelerated. Last year the NSI was 0.6569, which should be considered a very good result in view of the range of this index (0-1).
Figure 1. NSI levels in Poland in 2010-2019 Source: authors’ work.
Table 2 presents the evaluation of changes in specific indicators from 2010 to 2019. Out of 76 hands, clearly positive changes were observed con- cerning 52 (68.4%), 15 indicators (19.7%) should be given a negative evalu- ation, and for nine (11.9%), a detailed review is impossible due to significant variations in their values in the surveyed period.
0,0513 0,1083
0,2068 0,2586
0,3740 0,4117 0,4524 0,4733
0,5594 0,6569
0,0000 0,1000 0,2000 0,3000 0,4000 0,5000 0,6000 0,7000
2010 2011 2012 2013 2014 2015 2016 2017 2018 2019 NNSSII
⋯
= ( ()
) () , (2)
= ( ()
) () , (3)
= , (4)
=
, (5)
= ∑ (
− ). (6)
= (1 − ). (7)
EKONOMIA I ŚRODOWISKO 3 (82) • 2022 Studies and materials
161
DOI: 10.34659/eis.2022.82.3.481
Table 2. The changes in the assessment of indicators for national priorities of sustainable development in Poland in 2010-2019
Changes Indicators for national priorities SD
positive x1; x2; x3; x6; x7; x8; x9; x10; x11; x14; x15; x17; x18; x19; x20; x21; x25; x26; x27; x28; x29; x30; x31; x25; x26; x27; x28; x29; x30; x31; x33; x34; x36; x37; x38; x39; x40; x41; x42; x43; x44; x46;
x47; x48; x49; x51; x52; x53; x55; x56; x58; x59; x60; x66; x67; x70; x71; x74; x76 negative x5; x12; x13; x16; x23; x24; x32; x35; x50; x62; x63; x68; x69; x73; x75
ambiguous x4; x22; x45; x54; x57; x61; x64; x65; x72
Source: authors’ work.
A deep dive analysis of sustainable development goals and selected indi- cators for national priorities led to the following conclusions:
1. As regards the accomplishment of Goal 1, all the specific indicators (x1, x2
and x3) significantly improved in the surveyed period;
2. The highest progress for Goal 2 was observed with reference to the value of export of agri-food products per capita (x6) and the percentage of the length of public roads with a hard, improved surface in urban areas (x8).
However, unfavourable changes in recent years have been recorded for the share of income from hired work and self-employment other than work on a farm in the income of rural households (x5) and for agricultural and food quality (x4);
3. Within Goal 3, an exceptionally positive evaluation should be given to the decrease in the number of deaths due to diseases of the circulatory sys- tem (x11), an increase in the number of physicians (x15) and a related decrease in self-reported unmet need for medical examination and care (x17). In turn, still, a lot should be done about the number of deaths due to diabetes mellitus (x13) and malignant neoplasms (x12);
4. With reference to Goal 4, a significant decrease in the unemployment rate was noted among basic vocational school leavers (x19), an increase in the percentage of foreign students studying in Polish higher education institutions in Poland (x20) and in the percentage of children aged 3-5 covered by pre-primary education (x21). Until 2018, changes in the per- centage of young people, not continuing education were satisfactory, but one year later, this indicator was considerably worse;
5. Under Goal 5 a low level of accomplishment of national SD priorities was noted. Insofar as a positive change was observed for the number of chil- dren aged 1-2 covered by different kinds of institutional care (x25), changes in the gender employment gap and the gender pay gap were definitely negative (x24, x23);
DOI: 10.34659/eis.2022.82.3.481
6. As regards the accomplishment of Goal 6, all the specific indicators (x27, x28 and x29) significantly improved in the surveyed period;
7. With reference to Goal 7, the primary energy efficiency of GDP signifi- cantly decreased (x30), the renewable energy share in the gross final energy consumption increased (x31), and the share of average monthly spending on energy carriers in the total household spending also declined (x33). By contrast, unfavourable changes were observed with regard to national energy security (x32);
8. The general trend of changes in implementing national sustainable devel- opment priorities under Goal 8 looks positive, except for the level of expenditures on innovation activities in enterprises (x35);
9. Considerable progress was achieved in accomplishing the national prior- ities for Goal 9, although a slight decrease in the share of net revenues from sales of new or improved products in total net revenues from sales in industrial enterprises (x45) was noted;
10. On the one hand, decreasing inequality for Goal 10 denoted positive changes in eliminating differences in gross value added per person employed at the regional level (NUTS 2) (x49) and decreasing inequality of income (x51), while on the other hand – increased differences in the level of income between rural and urban population (x50);
11. With reference to six out of eight specific indicators describing the degree of accomplishment of Goal 11, decisively positive changes were observed in the surveyed period. However, the percentage of the urban population living in adequate housing conditions (x54) and the share of municipal waste for specific processing in relation to the volume of waste generated (x57) have not improved permanently;
12. National priorities making up Goal 12 were accomplished with various effects. Resource productivity (x60) considerably improved with slightly less progress in decreasing the domestic material consumption (DMC) per capita (x61). By contrast, a definite regression was recorded for increasing the organic production area (x63) and for the circular material use rate (x62);
13. Regarding the accomplishment of Goal 13, significant variations in the dynamics of greenhouse gas emissions, including CO2 emissions (x64, x65), were observed in the surveyed period. By contrast, significant achieve- ments were recorded for obtaining geothermal energy (x66);
14. Goal 14, due to an information gap, was described by one indicator only – the proportion of fish stocks within biologically sustainable levels (x67), which noted a significant increase from 2010 to 2019;
15. National priorities making up Goal 15 were implemented to a varying degree. Slight progress was achieved in increasing the share of forest
EKONOMIA I ŚRODOWISKO 3 (82) • 2022 Studies and materials
163
DOI: 10.34659/eis.2022.82.3.481
land (x70), while actions undertaken for decreasing the share of devas- tated and degraded land requiring reclamation in total area (x69) and changes in the Farmland Bird Index (x68) should be given a negative eval- uation;
16. For Goal 16, an improvement was recorded in ensuring security (x71) and using ICT (information and communications technology) for state governance and communication with its citizens (x74). By contrast, it is difficult to unambiguously evaluate changes in legislation quality (x72) that were subject to variations in the surveyed period. However, public institutions’ effectiveness (x73) should be perceived as clearly negative;
17. Concerning Goal 17, measured by official development assistance (ODA) as a proportion of gross national income (x76), a positive change was noted in the baseline year.
It should be highlighted that the use of a synthetic index allowed a legible assessment of the national sustainable development priorities from 2010 to 2019. On the other hand, analysing each global goal and specific indicators making up the NSI allowed identifying the strengths and weaknesses of sus- tainable transformation processes in Poland.
During the survey, certain limitations occurred, which to some extent, set potential directions for further research. The index was designed based on 76 indicators, even though as many as 125 sustainable development indica- tors were initially identified. This is due to the existing information gap con- cerning other indicators. The system solutions aimed at improving the effi- ciency of collecting data on respective indicators might boost the compre- hensive evaluation of sustainable development measures. Furthermore, the latest available data on most specific indicators comes from 2019, so it is impossible to conclude what changes occurred in 2020-2021. It was a time of extraordinary challenges associated with the necessity to combat the pan- demic of COVID-19, and they have certainly affected the achievement of the national SD priorities.
Conclusion
No universal method for designing composite indices exists. In any case, their design depends on the specific application, contains formal elements, and includes expertise in the particular phenomenon. Nevertheless, compos- ite indices have apparent advantages that can be condensed into a one-di- mension measurement of the specific phenomenon, a straightforward inter- pretation of a set of multiple individual indicators, and a simplified data analysis.
DOI: 10.34659/eis.2022.82.3.481
The added value of the survey is that it was the first comprehensive eval- uation of national sustainable development priorities from 2010 to 2019 using a specially designed NSI. The informational value of the index and the analysis of specific indicators should contribute to improvement in the mon- itoring, planning and implementation of sustainable development goals in Poland.
In response to research questions formulated in this paper, it should be noted that from 2010 to 2019, the level of sustainability of socio-economic processes in Poland dynamically increased, which was undeniably reflected in the degree of accomplishment of SD goals. The NSI considerably improved from 2010 to 2012, in 2014 and during the two final years covered by the assessment (2018-2019).
In contrast, analysis of changes in specific indicators implies that many areas still need intervention. The main challenges for the coming years include: for goal 2 – ensuring food quality and food security and increasing diversity of income sources among rural area population; for goal 3 – decreas- ing the number of deaths due to malignant neoplasms and diabetes mellitus and increasing the number of nurses and midwives; for goal 5 – increasing gender equality; for goal 7 – ensuring energy security of the state; for goal 8 – increasing expenditures on innovation activities in enterprises; for goal 10 – eliminating differences in the socio-economic development of urban and rural areas; for goal 11 – improving the dwelling conditions for the urban population; for goal 13 – effective reduction of greenhouse gases concentra- tion in the atmosphere; for goal 15 – protecting biodiversity, and for goal 16 – improving legislation quality and application of the law, enhancing the effectiveness of public institutions and better use of public resources.
References
Adrangi, B., & Kerr, L. (2022). Sustainable development indicators and their relation- ship to GDP: Evidence from emerging economies. Sustainability, 14, 658. https://
doi.org/10.3390/su14020658
Allen, C., Metternichta, G., & Wiedmannb, T. (2016). National pathways to the Sustain- able Development Goals (SDGs): A comparative review of scenario modelling tools. Environmental Science & Policy, 66, 199-207. http://dx.doi.org/10.1016/j.
envsci.2016.09.008
Asadullah, M. N., & Savoia, A. (2018). Poverty reduction during 1990-2013: Did Mil- lennium Development Goals adoption and state capacity matter? World Develop- ment, 105, 70-82. https://doi.org/10.1016/j.worlddev.2017.12.010
Baba Ali, E., Pavlovich Anufriev, V., & Amfo, B. (2021). Green economy implementa- tion in Ghana as a road map for a sustainable development drive: A review. Scien- tific African, 12, e00756. https://doi.org/10.1016/j.sciaf.2021.e00756
EKONOMIA I ŚRODOWISKO 3 (82) • 2022 Studies and materials
165
DOI: 10.34659/eis.2022.82.3.481
Bâc Dorin, P. (2008). A history of the concept of sustainable development: literature review. Annals of the University of Oradea. Economic Science Series, 17(2), 581- 585.
Balmford, A., Bennun, L., Ten Brink, B., Cooper, D., Coˆte´, M. I., Crane, P., Dobson, A., Dudley, N., Dutton, I., Green, R. E., Gregory, R. D., Harrison, J., Kennedy, E. T., Kre- men, C., Leader-Williams, N., Lovejoy, T. E., Mace, G., May, R., Mayaux, P., Morling, P., Phillips, J., Redford, K., Ricketts, T. H., Rodriguez, J. P., Sanjayan, M., Schei, P. J., Van Jaarsveld, A. S., & Walther, B. A. (2005). The convention on biological diver- sity’s 2010 target. Science, 307, 212-213.
Barbier, E. B., & Burgess, J. C. (2019). Sustainable development goal indicators: Ana- lyzing trade-offs and complementarities. World Development, 122, 295-305.
https://doi.org/10.1016/j.worlddev.2019.05.026
Bartlett, A. A. (2006). Reflections on sustainability, population growth, and the envi- ronment. In: M. Keiner (Ed.) The Future of Sustainability. Springer, Dordrecht.
https://doi.org/10.1007/1-4020-4908-0_1
Belmonte-Ureña, L. J., Plaza-Úbeda, J. A., Vazquez-Brust, D., & Yakovleva, N. (2021).
Circular economy, degrowth and green growth as pathways for research on sus- tainable development goals: A global analysis and future agenda. Ecological Eco- nomics, 185, 107050. https://doi.org/10.1016/j.ecolecon.2021.107050
Bellantuono, L., Monaco, A., Amoroso, N., Aquaro, V., Lombardi, A., Tangaro, S., & Bel- lotti, R. (2022). Sustainable development goals: conceptualization, communica- tion and achievement synergies in a complex network framework. Applied Net- work Science, 7, 14. https://doi.org/10.1007/s41109-022-00455-1
Benton, T. (1994). The greening of Machiavelli: the evolution of international environ- mental politics. London: Royal Institute of International Affairs/Earthscan.
Berchin, I. I., de Aguiar Dutra, A. R., & Salgueirinho Osório de Andrade Guerra, J. B.
(2021). How do higher education institutions promote sustainable develop- ment? A literature review. Sustainable Development, 29 (6), 1204-1222. https://
doi.org/10.1002/sd.2219
Bin Mohd Yusof, M. I., & Ariffin, M. (2020). A journey towards sustainability: a review on sustainable development implementation in Malaysia. 14th International UMT Annual Symposium. IOP Conference Series: Earth and Environmental Science, 494, 012011. https://doi.org/10.1088/1755-1315/494/1/012011
Bina, O. (2013). The green economy and sustainable development: an uneasy bal- ance? Environment and Planning C: Government and Policy, 31, 1023-1047.
https://doi.org/10.1068/c1310j
Bonnedahl, K. J., Heikkurinen, P., & Paavola, J. (2022). Strongly sustainable develop- ment goals: overcoming distances constraining responsible action. Environmen- tal Science and Policy, 129, 150-158. https://doi.org/10.1016/j.envsci.2022.01.004 Bova, D. M., & Śleszyński, J. (2020). Sustainable development indicators: The Italian equitable and sustainable well-being approach and its application to the local level. Ekonomia i Środowisko, 2(73), 32-47. https://doi.org/10.34659/2020/2/14 Bujanowicz-Haraś, B., Janulewicz, P., Nowak, A., & Krukowski, A. (2015). Evaluation of sustainable development in the member states of the European Union. Problemy Ekorozwoju – Problems of Sustainable Development, 10(2), 71-78.
Charrouf, Z., & Guillaume, D. (2009); Sustainable development in Northern Africa:
The argan forest case. Sustainability, 1, 1012-1022. https://doi.org/10.3390/
su1041012
DOI: 10.34659/eis.2022.82.3.481
Cornescu, V., & Adam, R. (2014). Considerations regarding the role of indicators used in the analysis and assessment of sustainable development in the EU. Procedia Economics and Finance, 8, 10-16.
Corona, B., Shen, L., Reike, D., Rosales Carreón, J., & Worrell, E. (2019). Towards sus- tainable development through the circular economy – A review and critical assessment on current circularity metrics. Resources, Conservation & Recycling, 151, 104498. https://doi.org/10.1016/j.resconrec.2019.104498
de Jong, E., & Vijge, M. J. (2021). From Millennium to Sustainable Development Goals:
Evolving discourses and their reflection in policy coherence for development.
Earth System Governance, 7, 100087. https://doi.org/10.1016/j.esg.2020.100087 Diaz-Sarachega, J. M., Jato-Espino, D., & Castro-Fresno, D. (2018). Is the Sustainable Development Goals (SDG) index an adequate framework to measure the prog- ress of the 2030 Agenda? Sustainable Development, 6, 663-671. https://doi.
org/10.1002/sd.1735
Dogaru, L. (2020). Green economy and green growth – opportunities for sustainable development. The 14th International Conference on Interdisciplinarity in Engi- neering – INTER-ENG 2020. Proceedings, 63(1), 70. http://dx.doi.org/10.3390/
proceedings2020063070
Dziekański, P., Prus, P., Maitah, M., & Wrońska, M. (2021). Assessment of spatial diver- sity of the potential of the natural environment in the context of sustainable development of poviats in Poland. Energies, 14(19), 6027. http://dx.doi.org/10.
3390/en14196027
European Commission. (2021). EU SDG Indicator set 202. Result of the review in prep- aration of the 2021 edition of the EU SDG monitoring report. Eurostat. Directorate E: Sectoral and Regional Statistics. https://ec.europa.eu/eurostat/docu- ments/276524/12239692/SDG_indicator_set_2021.pdf
Główny Urząd Statystyczny. (2022a, May). Statystyka publiczna na rzecz SDGs. Kra- jowa Platforma Raportująca – SDG. https://sdg.gov.pl/o_sdg/#stat
Główny Urząd Statystyczny. (2022b, May). Polska na drodze zrównoważonego roz
woju. Raport 2020. Departament Opracowań Statystycznych. https://raportsdg.
stat.gov.pl/2020/index.html
Główny Urząd Statystyczny. (2022c, May). Polska na drodze zrównoważonego rozwoju.
Inkluzywny wzrost gospodarczy. Raport 2020. Departament Opracowań Staty- stycznych. https://raportsdg.stat.gov.pl/index.html
Główny Urząd Statystyczny. (2022d, May). Priorytety krajowe SDG. Krajowa Plat- forma Raportująca – SDG. https://sdg.gov.pl/priorytet/
Grainger-Brown, J., & Malekpour, S. (2019). Implementing the sustainable develop- ment goals: A review of strategic tools and frameworks available to organisa- tions. Sustainability, 11(5), 1381. http://dx.doi.org/10.3390/su11051381 Grzebyk, M., & Stec, M. (2015). Sustainable development in EU countries: Concept
and rating of levels of development. Sustainable Development, 23, 110-123.
https://doi.org/10.1002/sd.1577
Guan, Ch., Weng, Y., Zhao, J., Lin, Y., Zhang, W., & Tu, Q. (2021). Examining China’s sustainable development based on genuine progress indicator. Sustainable Pro- duction and Consumption, 28, 1635-1644. https://doi.org/10.1016/j.spc.2021.
09.007
Guijarro, F., & Poyatos, J. (2018). Designing a sustainable development goal index through a goal programming model: The case of EU-28 countries. Sustainability, 10(9), 3167. http://dx.doi.org/10.3390/su10093167
EKONOMIA I ŚRODOWISKO 3 (82) • 2022 Studies and materials
167
DOI: 10.34659/eis.2022.82.3.481
Gunnarsdottir, I., Davidsdottir, B., Worrell, E., & Sigurgeirsdottir, S. (2022). Indicators for sustainable energy development: An Icelandic case study. Energy Policy, 164, 112926. https://doi.org/10.1016/j.enpol.2022.112926
Gusheva, E., Gjorgievski, V., Obradovic Grncarovska, T., & Markovska, N. (2022). How do waste climate policies contribute to sustainable development? A case study of North Macedonia. Journal of Cleaner Production, 354, 131572. https://doi.
org/10.1016/j.jclepro.2022.131572
Guzowska, M. K., & Kryk, B. (2020). Implementation of the social goals of the Europe 2020 strategy by EU member states, European Research Studies Journal, Volume XXIII Issue 4, 1213-1229, https://doi.org/10.35808/ersj/1739
Häikiö, L. (2014). Institutionalization of sustainable development in decision-making and everyday life practices: A critical view on the Finnish case. Sustainability, 6(9), 5639–5654. http://dx.doi.org/10.3390/su6095639
Janousková, S., Hák, T., Necas, V., & Moldan, B. (2019). Sustainable development – a poorly communicated concept by mass media. Another challenge for SDGs?
Sustainability, 11, 3181. https://doi.org/10.3390/su11113181
Jarocka, M. (2015). Wybór formuły normalizacyjnej w analizie porównawczej obiek- tów wielocechowych (The choice of a formula of the data normalization in the comparative analysis of multivariate objects). Economics and Management, 1, 113-126.
Kasztelan, A. (2017). Green growth, green economy and sustainable development – terminological and relational discourse, Prague Economic Papers, 26(4), 487- 499. https://doi.org/10.18267/j.pep.626
Kasztelan, A., Jarosz-Angowska, A., Nowak, A., & Krukowski, A. (2021). Konkurencyjna biogospodarka szansą dla zrównoważonego rozwoju krajów Unii Europejskiej.
ISBN 978-83-67033-13-8; e-ISBN 978-83-67033-14-5. Radom: Instytut Nau- kowo-Wydawniczy „Spatium”.
Kryk, B., & Guzowska, M. K. (2021). Implementation of climate/energy targets of the Europe 2020 strategy by the EU member states, Energies, 14(9), 2711. http://
dx.doi.org/10.3390/en14092711
Lafortune, G., Fuller, G., Schmidt-Traub, G., & Kroll, C. (2020). How Is progress towards the sustainable development goals measured? Comparing four approaches for the EU. Sustainability, 12(18), 7675. http://dx.doi.org/10.3390/su12187675 Lawn, P.A. (2001). Toward sustainable development. An ecological economics approach.
Boca Raton, London, New York, Washington, D.C.: CRC Press LLC.
Lele, S. M. (1991). Sustainable development: A critical review. World Development, 19, 607-621.
Mair, S., Jones, A., Ward, J., Christie, I., Druckman, A., & Lyon, F. (2018). A Critical Review of the Role of Indicators in Implementing the Sustainable Development Goals. In W. Leal Filho (Ed.), Handbook of Sustainability Science and Research (pp.
41-56). World Sustainability Series, Springer International Publishing AG.
https://doi.org/10.1007/978-3-319-63007-6_3
Mazziotta, M., & Pareto, A. (2013). Methods for constructing composite indices: One for all or all for one? RIEDS – Rivista Italiana di Economia, Demografia e Statistica – The Italian Journal of Economic, Demographic and Statistical Studies, LXVII(2), 67-80.
Megyesiova, S., & Lieskovska, V. (2018). Analysis of the sustainable development indi- cators in the OECD countries. Sustainability, 10, 4554. https://doi.org/10.3390/
su10124554
DOI: 10.34659/eis.2022.82.3.481
Mio, Ch., Panfilo, S., & Blundo, B. (2020). Sustainable development goals and the stra- tegic role of business: A systematic literature review. Business Strategy and the Environment, 29, 3220–3245. https://doi.org/10.1002/bse.2568
Muff, K., Kapalka, A., & Dyllick, T. (2017). The gap frame – translating the SDGs into relevant national grand challenges for strategic business opportunities. The International Journal of Management Education, 15, 363-383. https://doi.
org/10.1016/j.ijme.2017.03.004
Nasibulina, A. (2015). Education for sustainable development and environmental ethics. Procedia – Social and Behavioral Sciences, 214, 1077-1082.
Olsson, L., Hourcade, J-C., & Kohler, J. (2014). Sustainable development in a globalized world. Journal of Environment & Development, 23(1), 3-14. https://doi.org/10.
1177/1070496514521418
Organisation for Economic Co-operation and Development. (2008). Handbook on constructing composite indicators. Methodology and user guide. Paris, France:
OECD Publishing. https://www.oecd.org/sdd/42495745.pdf
Otamendi-Irizar, I., Grijalba, O., Arias, A., Pennese, C., & Hernandez, R. (2022). How can local energy communities promote sustainable development in European cities? Energy Research & Social Science, 84, 102363. https://doi.org/10.1016/j.
erss.2021.102363
Panchal, R., Singh, A., & Diwan, H. (2021). Does circular economy performance lead to sustainable development? – A systematic literature review, Journal of Environ- mental Management, Volume 293, 112811. https://doi.org/10.1016/j.jenv- man.2021.112811
Petkovová, L., Hartman, D., & Pavelka, T. (2020). Problems of aggregation of sustain- able development indicators at the regional level. Sustainability, 12(17), 7156.
http://dx.doi.org/10.3390/su12177156
Piotrowska, E., & Roszkowska, E. (2011). Analiza zróżnicowania województw Polski pod względem poziomu innowacyjności (Analysis of the diversity of Polish voivodeships in terms of the level of innovation). Optimum. Studia Ekonomiczne, 2(50), 65-85.
Piwowarski, M., Miałszewicz, D., Łatuszyńska, M., Borawski, M., & Kesra, N. (2018).
TOPSIS and VIKOR methods in study of sustainable development in the EU coun- tries. Procedia Computer Science, 126, 1683-1692. https://doi.org/10.1016/j.
procs.2018.08.109
Popović, B., Janković Šoja, S., Paunović, T., & Maletić, R. (2019). Evaluation of sustain- able development management in EU countries. Sustainability, 11(24), 7140.
http://dx.doi.org/10.3390/su11247140
Qu, W., Shi, W., Zhang, J., & Liu, T. (2020). T21 China 2050: A tool for National Sustain- able Development Planning. Geography and Sustainability, 1, 33-46. https://doi.
org/10.1016/j.geosus.2020.03.004
Radojicic, Z., Isljamovic, S., Petrovic, N., & Jeremic, V. (2012). A novel approach to evaluating sustainable development. Problemy Ekorozwoju – Problems of Sus- tainable Development, 7(1), 81-85.
Raszkowski, A., & Bartniczak, B. (2019a). On the road to sustainability: Implementa- tion of the 2030 Agenda Sustainable Development Goals (SDG) in Poland. Sus- tainability, 11(2), 366. http://dx.doi.org/10.3390/su11020366
Raszkowski, A., & Bartniczak, B. (2019b). Sustainable development in the Central and Eastern European Countries (CEECs): Challenges and opportunities. Sustainabil- ity, 11(4), 1180. http://dx.doi.org/10.3390/su11041180
EKONOMIA I ŚRODOWISKO 3 (82) • 2022 Studies and materials
169
DOI: 10.34659/eis.2022.82.3.481
Rodríguez-Antón, J. M., Rubio-Andrada, L., Celemín-Pedroche, M. S., & Ruíz-Peñalver, S. M. (2022). From the circular economy to the sustainable development goals in the European Union: An empirical comparison. Int Environ Agreements, 22, 67–95. https://doi.org/10.1007/s10784-021-09553-4
Ross, A. (2018). The evolution of sustainable development in Scotland – A case study of Community Right-to-Buy Law and Policy 2003-2018. Sustainability, 11, 130.
https://doi.org/10.3390/su11010130
Ruggerio, C. A. (2021). Sustainability and sustainable development: A review of prin- ciples and definitions. Science of the Total Environment, 786, 147481. https://
doi.org/10.1016/j.scitotenv.2021.147481
Rybak, A., & Włodarczyk, E. (2021). Implementation of the 2030 sustainable develop- ment goals – affordable and clean energy in Poland. 7th World Multidisciplinary Earth Sciences Symposium (WMESS 2021). IOP Conference Series: Earth and Envi- ronmental Science, 906, 012016. https://doi.org/10.1088/1755-1315/906/1/
012016
Strahl, D. (Ed.) (2006). Metody oceny rozwoju regionalnego (Methods for evaluation of regional development). Wrocław, Poland: AE Publishing House.
Strange, T., & Bayley, A. (2008). Sustainable development. Linking economy, society, environment. Paris: OECD Insights.
Teneta-Skwiercz, D. (2018). Wskaźniki pomiaru zrównoważonego rozwoju – Polska na tle krajów Unii Europejskiej. Prace Naukowe Uniwersytetu Ekonomicznego we Wrocławiu, 516, 121-132. https://doi.org/10.15611/pn.2018.515.11 United Nations. (1987). Our common future. Report of the World Commission on
Environment and Development, New York.
United Nations. (2015). Transforming our world: the 2030 Agenda for Sustainable Development. Resolution adopted by the General Assembly on 25 September 2015, A/RES/70/1.
Urbaniec, M. (2015). Sustainable development indicators in Poland: Measurement and system evaluation. Entrepreneurial Business and Economics Review, 3(1), 119-134. https://doi.org/10.15678/EBER.2015.030109
Wang, Q., Yuan, X., Zhang, J., Gao, Y., Hong, J., Zuo, J., & Liu, W. (2015). Assessment of the sustainable development capacity with the entropy weight coefficient method. Sustainability, 7(10), 13542-13563. http://dx.doi.org/10.3390/su7101 3542
Waas, T., Hugé, J., Block, T., Wright, T., Benitez-Capistros, F., & Verbruggen, A. (2014).
Sustainability assessment and indicators: Tools in a decision-making strategy for sustainable development. Sustainability, 6, 5512-5534. https://doi.org/10.3390/
su6095512
Waas, T., Hugé, J., Verbruggen, A., & Wright, T. (2011). Sustainable development:
A bird’s eye view. Sustainability, 3, 1637-1661. https://doi.org/10.3390/su3101 637
Zargartalebi, M. (2021). Sustainability as a competitiveness factor: A quantitative cross-country analysis. Ekonomia i Środowisko, 1(76), 70-90. https://doi.org/
10.34659/2021/1/4
Zhou, Y., Clarke, A., & Cairns, S. (2022). Toward awchieving local sustainable develop- ment: Market-based instruments (MBIs) for localizing UN Sustainable Develop- ment Goals. Urban Science, 6, 24. https://doi.org/10.3390/urbansci6010024