DIRECTIONS OF MANAGEMENT OF MUNICIPAL SEWAGE SLUDGE IN THE EUROPEAN UNION
ABSTRACT: The purpose of this article is to compare sludge management trends between selected EU-15 and EU-12 countries on the basis of statistical data to determine trends and formulate conclu- sions for countries adopted after 2004. The analysis relied on the analysis of changes in legal regula- tions, international literature and the analysis of statistical data from EUROSTAT. Unfortunately, incomplete statistical data limited the number of analyzed countries, however, it was possible to draw conclusions.
Sludge management is an extremely complex issue, affects not only water and sewage management and waste management, but also concerns the issues of agriculture (fertilizers) and energy. A very important part of the issues is technological progress, and therefore research and development.
Improper management of sewage sludge will in the long run lead to increasing costs of wastewater treatment, while modern technologies allow for the recovery of both energy and raw materials. The law in principle ruled out the possibility of storage and limited the agricultural use of unprocessed sewage sludge, thus one should choose the optimal development directions of the sector. Possible areas of action are burning with recovery of energy and raw materials from ashes or organic recycling, i.e.
composting with recovery of energy and heat and using the resulting fertilizer.
KEY WORDS: sewage sludge, wastewater treatment, sewage sludge management, sewage sludge reg- ulations
Ksymena Rosiek, PhD (ORCID: 0000-0003-0848-8242) – Department of Industrial and Environmental Policy, Cracow University of Economics
Correspondence address:
Rakowicka Street 27, 31-510, Kraków, Poland e-mail: ksymena.rosiek@uek.krakow.pl
Ksymena ROSIEK
JEL: Q25, Q42, Q53, O52 No. 3(70) 2019 • pages: 36-54 https://doi.org/10.34659/2019/3/33
Introduction
The basic EU regulation regarding sewage sludge and its use in agricul- ture was adopted over thirty years ago. Since then, knowledge about the environmental and health effects of natural use of sewage sludge has been improved, technologies for wastewater treatment have changed, as well as, thanks to technical progress, more effective methods of dealing with sewage sludge are available in terms of neutralizing dangerous substances and path- ogens. The progress of knowledge indicates the need to take action in the
ield of monitoring and handling substances present in wastewater and sew- age sludge, which have not been the subject of interest so far.
The implementation of sewage management requirements in the coun- tries adopted after 2004 (EU-12) will affect the increase in sewage sludge production, and the cheapest methods of handling them – that is storage and agricultural and natural use – are currently banned or very limited. These countries face the challenge of choosing a strategy for dealing with sewage sludge. One can and should take a look at the directions chosen by the coun- tries of the “Old Union” – that is, adopted until 1995 (EU-15) and on this basis build recommendations for EU-12 countries.
The aim of the article is to indicate possible directions for sewage sludge management in Poland and selected newest member countries on the basis of observed trends in management of sewage sludge selected in the countries of the ”Old Union”. The adopted research method is the analysis of source documents and statistical data of Eurostat.
Legal foundations defi ning the directions of sewage sludge management in the European Union – an overview of the literature
Waste management obligations arise, for example, from the Helsinki Con- vention (EU 1994:156) and recommendation “Sewage Sludge Handling”
approved on 17 March, 2017 indicating in the scope of handling sewage sludge to the highest possible level of recycling and recovery of phosphorus, and for other methods absolute compliance with standards. (“HELCOM 38/1”, 2017).
The issues of production and management of sewage sludge are regu- lated by numerous regulations in the ield of waste management and sewage management. However, also acts from other seemingly distant areas have a signi icant impact on the way they are managed – such as the issue of bio-
mass and the recognition of it as a zero-emission energy source (the most important directives are included in table 1).
The most important and the oldest EU legal act in the ield of sewage sludge is Directive 86/278/EEC concerning the agricultural use of sewage sludge. Its purpose is to regulate the use of sewage sludge in agriculture in such a way as to prevent its harmful effects on soil, vegetation, animals and people, while encouraging the correct use of sludge. However, it clearly indi- cates that different regulations in individual countries can not pose a threat to the common market. It points out that although sewage sludge can be a rich fertilizer for agriculture, it can also contain heavy metals and other dan- gerous pathogens (EU, 1986). The Directive introduces limit values of heavy metal concentrations in soil on which sewage sludge is distributed, in sewage sludges itself and annual maximum amounts of heavy metals that can be introduced into the soil intended for agricultural purposes. At the same time, it prohibits the use of sludge if the concentration of even one heavy metal is exceeded. It also introduces the need for monitoring and reporting obliga- tions for Member States (EU, 1986, Article 4). In this way, the possibility of agricultural and natural use of sewage sludge was signi icantly reduced (Bień et al., 2014, p. 9). The subsequent directives in luence the creation and treat- ment of sewage sludge, although they are not directly devoted to them. Direc- tive 91/271/EEC, called the Urban Waste Water Treatment directive, which aims to reduce the pollution of surface waters with municipal sewage and some industrial wastes. Its proper implementation will affect the increase in the amount of generated sewage sludge. It is important that, according to the Commission communication on the list of wastes, sewage sludge is not clas- si ied as hazardous waste, which signi icantly affects the way it is handled (EU, 2001, Chapter 19-20). On the other hand, Directive 1999/31/EC on land ill restricts, and in principle prevents the disposal of sewage sludge in land ills, and Directive 91/676/EEC concerning the protection of waters against pollution caused by nitrates from agricultural sources results in lim- ited areas on which sewage sludge can be used for agricultural purposes.
Table 1 indicates the most important directives and the scope of their possi- ble impact on the management of sewage sludge. Particularly important in addition to the waste directive, establishing a hierarchy of waste manage- ment (EU, 1998b) are: Directive 2009/28/EC on the promotion of the use of energy from renewable sources and Directive 2010/75/EU on industrial emissions (integrated pollution prevention and control). The irst recognizes energy from biomass, gas from land ills and sewage treatment plants as a renewable energy source, and the second does not prohibit the incineration and co-combustion of sewage sludge, while naturally maintaining all envi- ronmental standards. Both of these directives together with the aforemen-
tioned ones, which limit the agricultural and natural use and storage of sew- age sludge, determine the desirable directions of this waste.
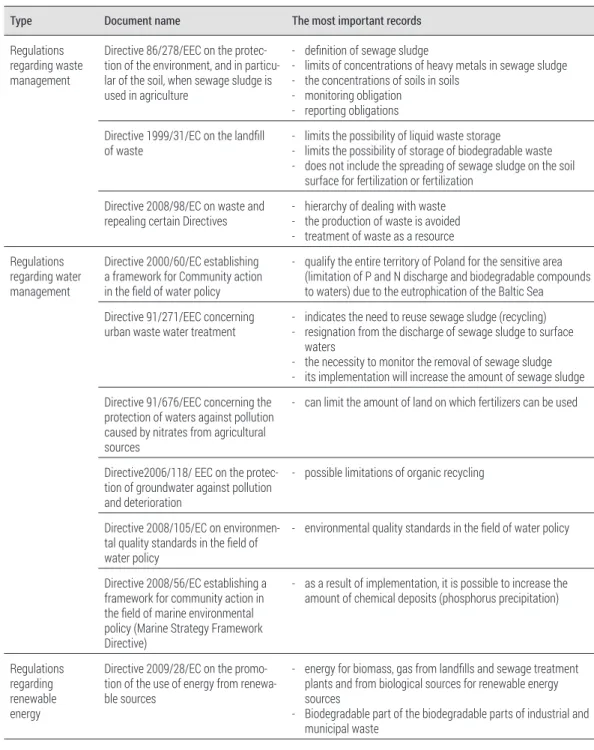
Table 1. Selected directives affecting the management of sewage sludge
Type Document name The most important records
Regulations regarding waste management
Directive 86/278/EEC on the protec- tion of the environment, and in particu- lar of the soil, when sewage sludge is used in agriculture
- defi nition of sewage sludge
- limits of concentrations of heavy metals in sewage sludge - the concentrations of soils in soils
- monitoring obligation - reporting obligations Directive 1999/31/EC on the landfi ll
of waste - limits the possibility of liquid waste storage
- limits the possibility of storage of biodegradable waste - does not include the spreading of sewage sludge on the soil
surface for fertilization or fertilization Directive 2008/98/EC on waste and
repealing certain Directives - hierarchy of dealing with waste - the production of waste is avoided - treatment of waste as a resource Regulations
regarding water management
Directive 2000/60/EC establishing a framework for Community action in the fi eld of water policy
- qualify the entire territory of Poland for the sensitive area (limitation of P and N discharge and biodegradable compounds to waters) due to the eutrophication of the Baltic Sea Directive 91/271/EEC concerning
urban waste water treatment - indicates the need to reuse sewage sludge (recycling) - resignation from the discharge of sewage sludge to surface
waters
- the necessity to monitor the removal of sewage sludge - its implementation will increase the amount of sewage sludge Directive 91/676/EEC concerning the
protection of waters against pollution caused by nitrates from agricultural sources
- can limit the amount of land on which fertilizers can be used
Directive2006/118/ EEC on the protec- tion of groundwater against pollution and deterioration
- possible limitations of organic recycling
Directive 2008/105/EC on environmen- tal quality standards in the fi eld of water policy
- environmental quality standards in the fi eld of water policy
Directive 2008/56/EC establishing a framework for community action in the fi eld of marine environmental policy (Marine Strategy Framework Directive)
- as a result of implementation, it is possible to increase the amount of chemical deposits (phosphorus precipitation)
Regulations regarding renewable energy
Directive 2009/28/EC on the promo- tion of the use of energy from renewa- ble sources
- energy for biomass, gas from landfi lls and sewage treatment plants and from biological sources for renewable energy sources
- Biodegradable part of the biodegradable parts of industrial and municipal waste
Research methods
The research aimed at determining the directions of sewage sludge man- agement in selected European Union countries in the context of legal changes being introduced, and comparing these changes with actions taken in coun- tries admitted to the EU after 2004.
The conducted research was based on the analysis of source materials and statistical data published by Eurostat. The analyzes in the article are divided into two groups of countries. Three EU-15 countries (Germany, France and Austria) and ive EU-12 countries were selected for analysis:
three adopted in 2004 (Poland, the Czech Republic and Hungary) and two later (Bulgaria and Romania). The selection of these countries was deter- mined both by their signi icance or representativeness, but also by the com- pleteness of the available data, for example, data on composting for Spain, Sweden, Belgium and England are not available at a satisfactory level.
Since statistics on water and wastewater in Eurostat are published for the resident and not in terms of the equivalent number of inhabitants (PE) (Eurostat, 2018f), all data are reported and converted in such units. The anal- ysis is made in 2018, the latest available data is from 2015 (Eurostat, 2018b), and for some speci ic data for 2013, nevertheless, interesting conclusions can be drawn. The 10-year period for this sector seems suf icient to capture cer- tain regularities and, on this basis, formulate conclusions for other countries under the same legal regime.
Type Document name The most important records
Regulations regarding indus- trial emissions
Directive 2010/75/EU on industrial emissions (integrated pollution pre- vention and control)
- disposal of sludge in any part of the water
- not prohibit the combustion and co-incineration of sewage sludge
- signifi cantly reduces emissions from energy installations, including incineration and co-incineration of waste and sewage sludge)
Directive 2004/35/CE on environmen- tal liability with regard to the preven- tion and remedying of environmental damage
- responsibility for the environment - polluter pays
Source: authors own work based on Bień et al., 2014, p. 9-11; Radecki, 2016, p. 355-362; Górski, 2018, p. 393-484;
Kelessidis, Stasinakis, 2012, p. 1187-1188.
Changes in the management of sewage sludge refl ected in statistical data for selected European Union countries adopted before 1996
In the middle of the irst decade of the 21st century, a signi icant review of waste policy directions was made, combining more closely with environ- mental and energy issues. As part of the conducted analyzes, which resulted in increased requirements, inter alia, in waste management issues, the sludge was also focused on.
At irst glance, there is a huge disproportion in the amount of sewage sludge produced, irstly between the EU-15 and EU-12 countries, and sec- ondly in the EU-12 countries surveyed. The volume of sewage produced in Germany is decreasing by 20%, in France by almost 12% and in Austria by over 20%, in EU-12 it is growing by 20% in Poland, by 17% in the Czech Republic and in Romania it has more than tripled, or maintains as in Hungary and Bulgaria – similar production levels are recorded (minimum drops) (table 2 and igure 1). The amount of generated sewage sludge is mainly affected by the amount of treated municipal sewage (the number of residents served, the amount of rainwater, the state of the sewage system – seepage of groundwater) and the technologies used for wastewater treatment. So let’s look at these factors. One important point to pay attention to is the de inition of sewage sludge in individual countries and when they become waste and when they lose their waste status. How are sludge treated in the sewage treatment plant classi ied, and how it is exported to other installations. This data may affect the generally reported amount of sewage sludge.
It should be noted that in Germany, 97% of residents were connected to sewage treatment plants, 100% in 2010, 95.8% and 100% in France, and 100% in Austria in 2004 (Eurostat, 2018b). Out of the EU-15 countries sur- veyed, only Germany suffered a decrease in the population (Eurostat, 2018a).
In the years 2004-2013, the number of sewage treatment plants decreased in Germany and France, with total capacity decreasing in Germany (expressed in BOD5 [t. O2/24h]), but for treatment plants with increased nutrient removal remained constant. It can be concluded that old sewage treatment plants with lower cleaning parameters were closed. In France, a colossal drop in the number of sewage treatment plants is noticeable with a signi icant increase in capacity, especially for treatment plants with increased biogen removal, which may inform about the liquidation of numer- ous small wastewater treatment plants with low technical parameters for modern large enterprises. In Austria, all the analyzed indicators increased (table 2), but the amount of generated sewage sludge decreased (table 4), which may inform about the growing technological potential.
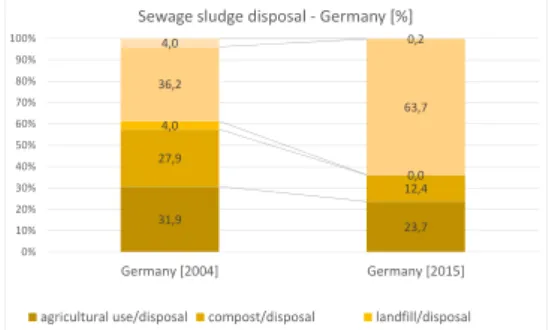
In nominal terms, Germany produces the most sewage sludge. The decrease in sewage sludge production between 2004-2015 is also the most visible in them (by 20%). It is caused by both a decrease in the number of inhabitants and technological factors in the form of abandoning the use of calcium / iron chloride in favor of polymers and the use of optimized pro- cesses during industrial wastewater treatment (Podewils, 2016). France pro- duces on average half as much sewage sludge than Germany (table 3, igure 1). However, Austria has the highest production of sewage sludge per capita, followed by Germany. All three surveyed EU countries report a decrease in the volume of generated sewage sludge (Germany by almost 20%, France by 10%, and Austria by over 21%), as well as per capita, however Austria is the largest drop in this indicator in the period under study ( igure 2). With a general decrease in the amount of generated sewage sludge in Germany, the amount of sludge burned increases from 711.2 to 1148.7 thousand tonnes of d.s. which is an increase from 36.2% to 63.7%. Storage was practically lim- ited. The second most common way of utilizing sewage sludge is agricultural utilization with the share of nearly 24%.
Table 2. Change in the number of sewage treatment plants, their capacity in Germany, Austria and France in 2004 and 2013 [in pcs]
Country Unit Number of wastewater treatment plants Including increased biogen removal
2004 2013 change 2004 2013 change
Germany pcs 9 994 9 636 -358 5534 5180** -354
Austria pcs 1579 1841* 262 783 1049** 266
France pcs 16889 3275 -13 614 2393 2605 212
The capacity of the sewage treatment plant Including increased biogen removal
Germany BOD5 [t. O2/24h] 9 283,7 9238,1 -449,6 9008,8 9003,9** -4,9
Austria BOD5 [t. O2/24h] 1 217,7 1 290,5* 72,8 1 156,6 1275,6** 119,0
France BOD5 [t. O2/24h] 5 289,1 5 323 33,9 2 909 4 360 1 451,0
Germany population
equivalent (p.e.) 154 728 333 153 968 333 -7 493 333 150 146 667 150 065 000** -81 667 Austria population
equivalent (p.e.) 20 295 000 21 508 333* 1 213 333 19 276 667 21 260 000** 1 983 333 France population
equivalent (p.e.) 88 151 667 88 716 667 565 000 48 483 333 72 666 667 24 183 333
* for 2006 ** for 2010
Source: author’s own work based on Eurostat, 2018d; Eurostat, 2018c.
In France, however, agricultural use dominates, but it remains at a similar level during the period under review with a downward trend of 420,000 t.d.s.
today. The amount of sludge subjected to composting increased from 166.6 to 305.1 thousand t.d.s. together, composting and agricultural use gives almost 78% of the sludge used. The share and the amount of sludge stored fell. In Austria, both in 2004 and in 2014, combustion is dominating and almost half of sewage sludge is utilized in this method. The composting share increased from nearly 21% to 32.5%, but in nominal terms it increased from 63.4 to 77.7 t.d.s., as there is generally a signi icant decrease in the quantity of produced sewage sludge.
In the countries studied, we can see a decrease in the amount of gener- ated sewage sludge, while in Austria and France the throughput increases.
In Germany, the process of reducing it was visible, but the country registered a reduction in population, and the capacity of the treatment plant with the highest degree of treatment remained unchanged. In all countries operated by sewage treatment plants is the entire population. With the exception of Germany, the reason for the decrease in the amount of sewage sludge is not a reduction in the number of inhabitants, and possible reasons include: greater savings in water consumption, better sewage treatment technologies (smaller amount of excessive sludge) and in reducing the in low of rainwater carrying signi icant amounts of sludge and other residuals. Following the industry lit- erature, it can be con irmed that the development of modern technologies in wastewater management can contribute to reducing the amount of sewage sludge production (Makisha, 2016; Raghuvanshi et al., 2017; Grace, Clifford, Healy, 2016). Great technological progress is also observed in sewage sludge management methods, especially those related to energy recovery (Pająk, 2013; Fijałkowwski et al., 2017; Raheem et al., 2018; Kelessidis, Stasinakis, 2012).
The countries discussed have chosen different strategies for the manage- ment of sewage sludge. Both in Germany and Austria, its burning prevails, and in France, agricultural use, with the growing role of composting. In all the discussed countries, storage is disappearing, Austria has the most effective way to reduce it. It also con irms the effectiveness of the EU regulations that limit the possibility of sludge storage.
BG [04] BG
[15] CZ [04] CZ
[15] DE [04] DE
[15] FR [04] FR
[14] HU [04] HU
[15] AT [04] AT
[14] PL [04] PL
[15] RO [05] RO
[15]
Production 58,4 57,4 178, 210, 226018201092 961, 160, 156, 304, 239, 476, 568, 67,8 210, Disposal 56,3 47,2 178, 210, 196518031059 937, 68,0 110, 304, 239, 476, 568, 67,8 155,
0,0 500,0 1000,0 1500,0 2000,0 2500,0
thous. t.
Sewage sludge production and disposal in selected EU Countries [in thousand tones d.s.]
Figure 1. Sewage sludge production and disposal in selected EU Countries [in thousand tones d.s.]
Source: author’s own work based on Eurostat, 2018b; Eurostat, 2018e.
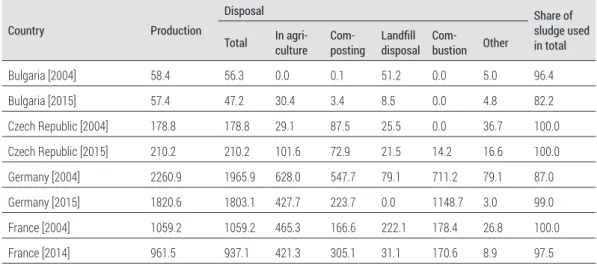
Table 3. Production and use of sewage sludge in selected European Union countries in thous. tonnes of dry matter in 2004 and 2015
Country Production
Disposal Share of
sludge used in total Total In agri-
culture Com-
posting Landfi ll disposal Com-
bustion Other
Bulgaria [2004] 58.4 56.3 0.0 0.1 51.2 0.0 5.0 96.4
Bulgaria [2015] 57.4 47.2 30.4 3.4 8.5 0.0 4.8 82.2
Czech Republic [2004] 178.8 178.8 29.1 87.5 25.5 0.0 36.7 100.0
Czech Republic [2015] 210.2 210.2 101.6 72.9 21.5 14.2 16.6 100.0
Germany [2004] 2260.9 1965.9 628.0 547.7 79.1 711.2 79.1 87.0
Germany [2015] 1820.6 1803.1 427.7 223.7 0.0 1148.7 3.0 99.0
France [2004] 1059.2 1059.2 465.3 166.6 222.1 178.4 26.8 100.0
France [2014] 961.5 937.1 421.3 305.1 31.1 170.6 8.9 97.5
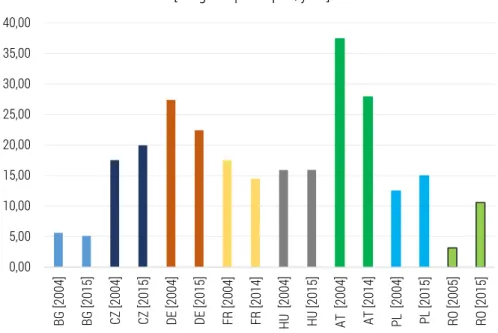
Figure 2. Sewage sludge production from urban wastewater per capita in selected EU Countries [in kg d.s. per capita/year]
Source: author’s own work based on Eurostat, 2018b; Eurostat, 2018e; Eurostat, 2018a.
0,00 5,00 10,00 15,00 20,00 25,00 30,00 35,00 40,00
BG [2004] BG [2015] CZ [2004] CZ [2015] DE [2004] DE [2015] FR [2004] FR [2014] HU [2004] HU [2015] AT [2004] AT [2014] PL [2004] PL [2015] RO [2005] RO [2015]
Production of sewage sludge from urban wastewater [in kg d.s. per capita/year]
Hungary [2004] 160.9 68.0 33.2 8.7 19.3 4.4 2.5 42.3
Hungary [2015] 156.9 110.9 9.4 83.7 5.1 12.7 1.3 70.7
Austria [2004] 304.6 304.6 37.6 63.4 29.8 151.3 22.5 100.0
Austria [2014] 239.0 239.0 39.6 77.7 3.2 118.5 0.0 100.0
Poland [2004] 476.1 476.1 66.9 29.7 162.7 1.4 215.3 100.0
Poland [2015] 568.0 568.0 107.5 47.1 40.5 79.3 293.6 100.0
Romania [2005] 67.8 67.8 0.7 4.7 55.9 0.0 6.6 100.0
Romania [2015] 210.5 155.8 10.6 0.2 104.2 0.5 40.9 74.0
Source: author’s own work based on Eurostat, 2018b; Eurostat, 2018e.
Figure 3. Sewage sludge disposal in selected EU-15 countries [in thousand thones d.s. and in percentage]
Source: author’s own work based on Eurostat, 2018b; Eurostat, 2018e.
12,3 16,6
20,8 9,8 32,5
1,3 49,7
49,6
7,4 0,0
0%
10%
20%
30%
40%
50%
60%
70%
80%
90%
100%
Austria [2004] Austria [2014]
Sewage sludge disposal - Austria [%]
agricultural use/disposal compost/disposal landfill/disposal incineration//disposal other/disposal
37,6 39,6
63,4 77,7
29,8 3,2
151,3
118,5 22,5
0,0
0,0 50,0 100,0 150,0 200,0 250,0 300,0 350,0
Austria [2004] Austria [2014]
Sewage sludge disposal - Austria [thousan tones d.s.]
agricultural use compost landfill incineration other
465,3 421,3
166,6 305,1
222,1 31,1
178,4
170,6 26,8
8,9
0,0 200,0 400,0 600,0 800,0 1000,0 1200,0
France [2004] France [2014]
Sewage sludge disposal - France [thousan tones d.s.]
agricultural use compost landfill incineration other
43,9 45,0
15,7
32,6 21,0
3,3
16,8 18,2
2,5 1,0
0%
10%
20%
30%
40%
50%
60%
70%
80%
90%
100%
France [2004] France [2014]
Sewage sludge disposal - France [%]
agricultural use/disposal compost/disposal landfill/disposal incineration//disposal other/disposal
628,0
427,7 547,7
223,7 79,1
0,0 711,2
1148,7 79,1
3,0
0,0 500,0 1000,0 1500,0 2000,0 2500,0
Germany [2004] Germany [2015]
Sewage sludge disposal - Germany [thousan tones d.s.]
agricultural use compost landfill incineration other
31,9 23,7
27,9
12,4 4,0
0,0 36,2
63,7
4,0 0,2
0%
10%
20%
30%
40%
50%
60%
70%
80%
90%
100%
Germany [2004] Germany [2015]
Sewage sludge disposal - Germany [%]
agricultural use/disposal compost/disposal landfill/disposal incineration//disposal other/disposal
Source: author’s own work based on Eurostat, 2018b; Eurostat, 2018e.
Figure 4/1. Sewage sludge disposal in selected EU-12 countries [in thousand thones d.s. and in percentage]
66,9 107,5
29,7
47,1
162,7 40,5
1,4 79,3
215,3
293,6
0,0 100,0 200,0 300,0 400,0 500,0 600,0
Poland [2004] Poland [2015]
Sewage sludge disposal - Poland [thousan tones]
agricultural use compost landfill incineration other
14,1 18,9
6,2 8,3
34,2
7,1 0,3
14,0
45,2 51,7
0%
10%
20%
30%
40%
50%
60%
70%
80%
90%
100%
Poland [2004] Poland [2015]
Sewage sludge disposal - Poland [%]
agricultural use/disposal compost/disposal landfill/disposal incineration//disposal other/disposal
29,1
101,6 87,5
25,5 72,9
21,5 0,0
14,2 36,7
16,6
0,0 50,0 100,0 150,0 200,0 250,0
Czech Republic [2004] Czech Republic [2015]
Sewage sludge disposal - Czech Rep. [thousan tones d.s.]
agricultural use compost landfill incineration other
16,3
48,3 48,9
34,7 14,3
0,0 10,2
20,5 6,87,9
0%
10%
20%
30%
40%
50%
60%
70%
80%
90%
100%
Czech Republic [2004] Czech Republic [2015]
Sewage sludge disposal - Czech Rep. [%]
agricultural use/disposal compost/disposal landfill/disposal incineration//disposal other/disposal
0,7 10,6
4,7 0,2
55,9
104,2 0,0
0,5
6,6
40,9
0,0 20,0 40,0 60,0 80,0 100,0 120,0 140,0 160,0 180,0
Romania [2005] Romania [2015]
Sewage sludge disposal - Romania [thousan tones]
agricultural use compost landfill incineration other 210,4
1,0 6,8
6,9 0,1
82,4
66,9 0,0
0,3 9,7
26,3
0,0 10,0 20,0 30,0 40,0 50,0 60,0 70,0 80,0 90,0 100,0
RO [2005] RO [2015]
Sewage sludge disposal - Romania [%]
agricultural use/disposal compost/disposal landfill/disposal incineration//disposal other/disposal
Directions for managing sewage sludge in selected countries admitted to the European Union after 2004
In the countries admitted to the EU after 2004, there is a completely dif- ferent situation than in the EU-15 countries. The amount of produced sewage sludge is disproportionately smaller. In comparison to Germany, Poland pro- duces only 30% of sewage sludge and Bulgaria 3%. Of the analyzed countries, only Hungary produces a comparable amount of sewage sludge as France (table 2, igure 1). In the studied EU-12 countries, the amount of generated sewage sludge increases due to the growing sewage treatment and increas- ing share of population with access to sewage treatment plants, improving the quality of treatment (table 4) and the growing share of residents with access to waterworks and lifestyle change resulting in increased consump- tion of tap water (increased water consumption is, however, hampered by rising water prices).
The number of people connected to sewage treatment plants is increas- ing, which increases the amount of sewage and sewage sludge produced. The share of people with access to sewage treatment plants increased: in Poland
33,2
9,4 8,7
83,7 19,3
5,1
4,4
12,7
2,5
1,3
0,0 20,0 40,0 60,0 80,0 100,0 120,0
Hungary [2004] Hungary [2015]
Sewage sludge disposal - Hungary [thousan tones d.s.]
agricultural use compost landfill incineration other
48,8
8,5 12,8
75,4 28,4
4,6
6,5 11,5
3,7 1,2
0%
10%
20%
30%
40%
50%
60%
70%
80%
90%
100%
Hungary [2004] Hungary [2015]
Sewage sludge disposal - Hungary [%]
agricultural use/disposal compost/disposal landfill/disposal incineration//disposal other/disposal
0,0
30,4 0,1
3,4 51,2
8,5 0,0
0,0 5,0
4,8
0,0 10,0 20,0 30,0 40,0 50,0 60,0 70,0 80,0 90,0 100,0
Bulgaria [2004] Bulgaria [2015]
Sewage sludge disposal - Bulgaria [thousan tones d.s.]
agricultural use compost landfill incineration other
0,0
64,4
0,2
7,2
90,9
18,0
0,0 0,0
8,9 10,2
0%
10%
20%
30%
40%
50%
60%
70%
80%
90%
100%
Bulgaria [2004] Bulgaria [2015]
Sewage sludge disposal - Bulgaria [%]
agricultural use/disposal compost/disposal landfill/disposal incineration//disposal other/disposal
Source: author’s own work based on Eurostat, 2018b; Eurostat, 2018e.
Figure 4/2. Sewage sludge disposal in selected EU-12 countries [in thousand thones d.s. and in percentage]
from 84.5% in 2004 to 94.2% in 2015, in the Czech Republic from 73.5% to 81% respectively, and in Hungary from 72.1-76.8%. Even bigger changes occur in the countries adopted after 2007, and in Romania the increase of population connected to sewage treatment plants increased from 27.8 to 47.8%, in Bulgaria from 71.8 to 86.8% in 2004 and 2015 respectively (Eurostat, 2018b). It can be seen that especially in the last two countries there is still a large potential for growth in connecting residents to the sewer- age system. At the same time, in all EU12 countries discussed, with the excep- tion of the Czech Republic, there was a decrease in the number of inhabitants (Eurostat, 2018a).
In all EU-12 countries discussed, with the exception of Hungary, there was an increase in the number of sewage treatment plants, including increased biogen removal – table 4. This is clearly visible especially in Poland and the Czech Republic. In Poland, the capacity of sewage treatment plants increased by 11%, but in 2004, the puri ication plants with the highest degree of treatment constituted 58% of the available capacity, and in 2013 – already 82%. With the increase in the number of residents served, these are probably two main factors affecting the increase in the amount of sewage sludge (table 4, igure 4). Bulgaria and Romania are far behind although there has been a threefold increase in the production of sewage sludge in Romania during the period considered, Bulgaria and the Czech Republic can be compared due to a similar population (and these two countries have a population between 7-10 thousand inhabitants) and this shows how much still needs to be done in Bulgaria. The Czech Republic currently produces nearly four times more sewage sludge than Bulgaria.
In Hungary, the total number of sewage treatment plants decreased, but their throughput increased, and the number and capacity of the treatment plants with the highest degree of puri ication increased – resulting in an increase in sewage sludge (table 3 and table 4, igure 4). The number of sew- age treatment plants in Poland increased, including the largest increase in the capacity of sewage treatment plants with increased biogen removal. Only in Bulgaria, the amount of generated sewage sludge and throughput decreased, despite the increase in the number of sewage treatment plants (table 5). It can be seen from the data that the processes of adaptation to the requirements of the Sewage Directive do not go as dynamically as in Roma- nia. The total amount of generated sewage sludge in Bulgaria is only 10% of what is in Poland and slightly more than a quarter of what in the Czech Republic.
In Poland, the amount of generated sewage sludge increased from 476 to 568 thousand t.d.s. and the amount of managed sewage sludge has also increased. In Poland, the Czech Republic and Romania, the amount of gener-
ated sewage sludge per capita is growing, in Hungary and Bulgaria it is stabi- lized or decreasing. However, it remains far lower than in Austria or Germany.
Only France has a comparable production per capita as Poland or Hungary, and lower than the Czech Republic ( igure 2).
The structure of utilization of sewage sludge is slowly changing in Poland.
The share of incineration increased from a share of 0.3 to 14%. The share of the “other” category is very large. Of all the countries surveyed, the share of this category is the highest for Poland and growing. In response to the Table 4. Change in the number of sewage treatment plants, their capacity in Bulgaria, the Czech Republic,
Poland, Romania and Hungary in 2004 and 2013 [in pcs]
Specifi cation Unit Number of wastewater treatment plants Including with increased biogen removal
2004 2013 change 2004 2013 change
Bulgaria pcs 56 90 34 0 26 26
Czech Republic pcs 2006 2636 630 766 1272 506
Poland pcs 2875 3264 389 689 820 131
Romania pcs 467* 481** 14 : 74** 74
Hungary pcs 864 739 -125 170 451 281
The capacity of the sewage treatment
plant Including with increased biogen removal
Bulgaria BOD5 [t. O2/24h] 415.1* 464 48.9 : 223.7 223.7
Czech Republic BOD5 [t. O2/24h] 862.2 981.7 119.5 705.2 864.7 159.5
Poland BOD5 [t. O2/24h] 2 549.5 2 848.9 299.4 1 477.8 2 336.5 858.7
Romania BOD5 [t. O2/24h] 793* 724.5 -68.5 : 293.4 293.4
Hungary BOD5 [t. O2/24h] 661.9 946 284.1 240 692.6 452.6
Bulgaria population
equivalent (p.e.) 6 918 333 7 733 333 815 000 - 3 728 333 3 728 333 Czech Republic population
equivalent (p.e.) 14 370 000 16 361 667 1 991 667 11 753 333 14 411 667 2 658 333
Poland population
equivalent (p.e.) 42 491 667 47 481 667 4 990 000 24 630 000 38 941 667 14 311 667
Romania population
equivalent (p.e.) 13 216 667 12 075 000 -1 141 667 - 4 890 000 4 890 000
Hungary population
equivalent (p.e.) 11 031 667 15 766 667 4 735 000 4 000 000 11 543 333 7 543 333
* 2005 ** 2014
Source: author’s own work based on Eurostat, 2018d; Eurostat, 2018c.
Author’s query to the CSO, an explanation was given that the category “other”
includes:
• transfer of sludge to other authorized bodies for their development,
• the use of sludge for the cultivation of plants not intended for direct con- sumption,
• use of sludge in R3 processes, ie recycling or regeneration of organic sub- stances that are not used as solvents (including composting and other biological transformation processes), R12 – replacement of waste for submission to any of the processes listed in item R1–R11 (Act on waste, 2013c, Annex 1, Indicative list of recovery processes).
One should consider the method of collecting statistical data, because in the present situation more than half of sewage sludge escapes public statis- tics on the ways of their management, and even if sewage sludge is trans- ferred to another entity for development, it should be known how to deal with it and recorded statistical data. In the current situation, of icial statistics from Poland show a rather disturbing picture, especially against the back- ground of EU-15 countries where the category “other”. It practically disap- pears. It grows only in Romania from just under 10% to over 26%.
In Bulgaria, the use of farms from almost nil to almost 65% has signi i- cantly increased as a process replacing the storage dominating in 2005. The most diversi ied path of sewage sludge management, according to data, was adopted by the Czech Republic. In the years 2004-2014, agricultural use increased from about 16 to 48%, composting decreased from 50% to 35%, storage decreased from 14 to about 10% and combustion occurred – almost 7%. The category “other decreases from 20 to less than 8%. This is all with the growing total amount of sewage sludge (this means that despite the decrease in the composting share, the nominal decrease from 87.5 t.d.s. to 72.9 t.d.s., ie less than 17%).
In Hungary, with a signi icant increase in the volume of sewage sludge produced, the percentage of composting increased from almost 13% to over 75% and the decrease in storage from nearly 30% to less than 5% and decrease in agricultural use from nearly 50% to 8.5%
Conclusions and data for Central and Eastern European countries
Some conclusions can be drawn from the data presented. In the EU-15 countries, the amount of sewage sludge is decreasing due to the decreasing number of inhabitants, savings, limitation of in low of rainwater to the net- work, but probably also due to technological changes in the treatment pro-
cess and their initial treatment. Depending on the country, the main strategy for their management is incineration (Austria, Germany) or composting and agricultural use (France). It goes away from the storage of sludge, which was enforced by regulations.
The storage constraint is also visible in the surveyed EU-12 countries.
Moreover, as trends dominating in the decade under review, the following should be calculated: increase in the share of population with access to sew- age system, increase in the amount of treated wastewater and improvement of the quality of the treatment process, which results in an increase in the amount of generated sewage sludge.
Is it possible to form unambiguous recommendations for the manage- ment of sewage sludge: Yes and No. Yes, as some generalizations can be drawn from the observed trends in other countries. No, because each deci- sion should be made on the basis of a detailed analysis of costs and bene its.
It is necessary to coordinate activities at the national level, support facilitat- ing the transition in the desired direction, taking into account the legal and economic environment, in particular:
• quality and quantity of generated sewage sludge,
• restrictive legal requirements for agricultural use (which generates costs) and limitation of the possibility of storing sewage sludge,
• organizational and legal form of the conducted activity (whether at the sewage treatment plant or by specialized regional entities),
• existing infrastructure,
• a growing number of treatment plants with increased biogen removal, which contributes to the increase of sewage sludge,
• increasing saturation of the sewer trash (except for Bulgaria), which in a certain perspective will contribute to the stabilization of the amount of generated sewage sludge,
• limiting or stabilizing water consumption by households due to rising water prices and limiting the in low of rainwater to the sewage system, which will contribute in the long run should lead to stabilization or even reduction of the amount of generated sewage sludge,
• increasing technological progress enabling the recovery of nitrogen phosphorus from deposits or ashes after their combustion,
• possibility of energy recovery from sewage sludge,
• restrictions on the possibility of transporting sewage sludge,
• mechanisms supporting RES and cogeneration,
• emerging markets for recovered raw materials.
On a national scale, it seems that the strategy that develops the main directions of development, that is composting with the recovery of energy and raw materials through their introduction into the soil and burning with
the recovery of energy and raw materials from ashes, seems to be the most lexible. Of course, the costs are also critical. Taking into account the costs (Milieu Ltd, WRc and RPA for the European Commission, DG Environment, 2010) and the fact that after reaching the maximum level of sewage sludge production, their number may stabilize or start to decline as in western countries, as well as the fact of dynamic technology progress Co- iring should be considered.
However, taking into account the impact on the environment and health of the population, the research conducted indicates that controlled compost- ing (organic recycling) with recovery of energy and agricultural use of com- post is a better destination (Wójtowicz et al., 2013, p. 427). In addition, research related to technologies related to the management of sewage sludge as well as the study of their impact on the environment should be supported.
Thermal directions are usually recommended for large wastewater treat- ment plants whose catchments are threatened by excessive pollution of potentially toxic elements (e.g. heavy metals).
However, a number of local factors affect the decision on a particular solution. The direction of sewage sludge management depends, irst of all, on the quality and quantity of sewage sludge and existing possibilities, e.g. the existing possibility of utilization in the vicinity of a mono-re inery or a restric- tion of the possibility of using certain criteria. In mountainous areas or near protected areas such possibilities will be limited, so one should consider another solution. Each time it translates into the costs of wastewater treat- ment.
Conclusions
Changes in legal regulations are one of the important elements affecting the management of sewage sludge (and general waste). Among the impor- tant factors affecting the selection of these trends should be distinguished:
• legal requirements (national and EU),
• the level of available technology (innovative technologies, improving existing ones),
• knowledge about the environmental effects of each method,
• possibilities of control and monitoring (quality of sludge, products from processes, soils and waters),
• inancial abilities.
It should be noted that these factors in luence each other. The extended knowledge about environmental and social effects as well as technological progress affects changes in the law and mobilization of inancing sources, and changes in law in turn stimulate technological progress.
In EU-15 countries, the quantity of sewage sludge produced decreased, with a very high percentage of people connected to municipal sewage treat- ment plants. Production of sewage sludge from municipal wastewater treat- ment plants per capita is falling. Depending on the country, the dominant method of management is either agricultural utilization and composting (France) or combustion is prevalent (Austria and Germany). Storage virtually disappears.
In the countries adopted since 2004, the amount of produced sewage sludge is growing, but it is far less than in the surveyed EU-15 countries. The share of people connected to the sewage system and municipal sewage treat- ment plants is increasing (Poland, the Czech Republic, Hungary) and there is a large potential for growth of this indicator in Bulgaria and Romania. The number and capacity of sewage treatment plants with increased nutrient removal increase and the amount of produced sewage sludge per capita is increasing.
In the studied EU-12 countries, sewage sludge storage signi icantly decreases (too slow decline in Romania) for agricultural use (Bulgaria, the Czech Republic), composting (Hungary, the Czech Republic), the incidence of combustion per level is just over 10-15% (Poland, Hungary). In Poland, the category “Other” is a disturbingly large share, which includes the transfer of sludge to another use, which is an argument for the establishment of a national strategy for the management of sewage sludge.
Thus, in the surveyed EU-12 countries, the road of organic recycling is more often chosen, which should be a recommendation to focus efforts on developing the monitoring system and assessing environmental effects and supporting research and transfer of their results to the economy in these areas.
Looking at data from EU-15 countries, it should be pointed out that EU-12 countries should take into account – when building their sewage sludge man- agement strategies – that currently the amount of sewage sludge is increas- ing, but in the future (rather further) it may stabilize or fall, and this will be favored by modern technologies used in wastewater treatment and primary treatment of sewage sludge. The possibility of their development should be taken into account, especially in the context of agricultural development and clauses limiting the transport of sludge. The provisions regarding the recog- nition of sewage sludge as a zero-emission energy source and provisions related to instruments supporting renewable energy sources and energy production in cogeneration may be of signi icant importance. Future priori- ties in inancing investments in environmental protection from funds coming from the EU budget will also be important, especially if the possibilities of spending them on incinerators are limited. Probably the path chosen by Aus-
tria and Germany towards almost complete combustion of sludge for EU-12 countries is no longer available. Therefore one should create or verify quality standards, monitoring and certi ication programs.
Literature
EU (1986), Council Directive of 12 June 1986 on the protection of the environment, and in particular of the soil, when sewage sludge is used in agriculture (86/278/
EEC), Of icial Journal L 181, 04/07/1986 P. 0006 – 0012
EU (2001), 2001/118/EC: Commission Decision of 16 January 2001 amending Deci- sion 2000/532/EC as regards the list of wastes (noti ied under document num- ber C(2001) 108), OJ L 47, 16.2.2001, p. 1-31
Milieu Ltd, WRc and RPA for the European Commission, DG Environment (2010), Final Report, Part II: Report on Options and Impacts-Environmental, economic and social impacts of the use of sewage sludge on land, http://ec.europa.eu/envi- ronment/archives/waste/sludge/pdf/part_ii_report.pdf [09-11-2018]
Baltic Marine Environment Protection Commission (2017), HELCOM Recommenda- tion 38/1
Eurostat (2018a), Eurostat – Population change – Demographic balance and crude rates at national level [demo_gind], http://appsso.eurostat.ec.europa.eu/nui/
show.do?dataset=demo_gind&lang=en [09-11-2018]
Eurostat (2018b), Eurostat – Population connected to wastewater treatment plants [env_ww_con], http://appsso.eurostat.ec.europa.eu/nui/show.do?dataset=env_
ww_con&lang=en [09-11-2018]
Eurostat (2018c), Eurostat – Treatment capacity of wastewater treatment plants, in terms of BOD5 [env_ww_cap], http://appsso.eurostat.ec.europa.eu/nui/show.
do?dataset=env_ww_cap&lang=en [09-11-2018]
Eurostat (2018d), Eurostat – Wastewater treatment plants by treatment level [env_
ww_plt], http://appsso.eurostat.ec.europa.eu/nui/show.do?dataset=env_ww_
plt&lang=en [09-11-2018]
Eurostat (2018e), Eurostat – Sewage sludge production and disposal from urban waste- water [env_ww_spd], http://ec.europa.eu/eurostat/tgm/refreshTableAction.do?
tab=table&plugin=1&pcode=ten00030&language=en [03-01-2018]
Eurostat (2018f), Water statistics on national level, https://ec.europa.eu/eurostat/
cache/metadata/en/env_nwat_esms.html [09-11-2018]
EU (1974), Decyzja 94/156/WE w sprawie przystąpienia Wspólnoty do Konwencji o ochronie Środowiska Morskiego obszaru Morza Bałtyckiego (Konwencja Hel- sińska z 1974 r.)
EU (1998b), Directive 2008/98/EC of the European Parliament and of the Council of 19 November 2008 on waste and repealing certain Directives, Dz.U. L 312 z 22.11.2008, p. 3-30
Ustawa z dnia 14 grudnia 2012 r. o odpadach, Dz.U. 2013 poz. 21
Bień J. et al. (2014), Ekspertyza, która będzie stanowić materiał bazowy do opracowa- nia strategii postępowania z komunalnymi osadami ściekowymi na lata 2014-2020
Fijałkowski K. et al. (2017), The Presence of Contaminations in Sewage Sludge – The Current Situation, “Journal of Environmental Management” No. 203, p. 1126-36, DOI: 10.1016/j.jenvman.2017.05.068
Górski M. (2018), Prawo ochrony środowiska. 3, Wolters Kluwer, Warszawa
Grace M.A. et al. (2016), The Potential for the Use of Waste Products from a Variety of Sectors in Water Treatment Processes, “Journal of Cleaner Production” No. 137, p. 788-802, DOI: 10.1016/j.jclepro.2016.07.113
Kelessidis A., Athanasios S.S. (2012), Comparative Study of the Methods Used for Treat- ment and Final Disposal of Sewage Sludge in European Countries, “Waste Manage- ment” No. 32(6), p. 1186-95, DOI: 10.1016/j.wasman.2012.01.012
Makisha N. (2016), Waste Water and Biogas – Ecology and Economy, “Procedia Engi- neering” No. 165, p. 1092-97, DOI: 10.1016/j.proeng.2016.11.824
Pająk T. (2013), Thermal Treatment as Sustainable Sewage Sludge Management,
“Environment Protection Engineering” No. 2 Vol. 39, DOI: 10.5277/EPE130205 Podewils W. (2016), Aktualne dane statystyczne dotyczące utylizacji osadów ście-
kowych w Niemczech, “Wodociągi i Kanalizacja”
Radecki W. (2016), Ustawa o odpadach – Komentarz. 4, Wolters Kluwer, Warszawa Raghuvanshi S. (2017), Waste Water Treatment Plant Life Cycle Assessment: Treat-
ment Process to Reuse of Water, “Procedia CIRP” No. 61, p. 761-66, DOI: 10.1016/
j.procir.2016.11.170
Raheem A. (2018), Opportunities and Challenges in Sustainable Treatment and Resource Reuse of Sewage Sludge: A Review, “Chemical Engineering Journal”
No. 337, p. 616-41, DOI: 10.1016/j.cej.2017.12.149
Wójtowicz A. (2013), Modelowe rozwiązania w gospodarce osadowej, Izba Gosp- odarcza “Wodociągi Polskie” oraz Stowarzyszenie Eksploatatorów Obiektów Gospdoarki Wodno-Ściekowej, Bydgoszcz
![Table 2. Change in the number of sewage treatment plants, their capacity in Germany, Austria and France in 2004 and 2013 [in pcs]](https://thumb-eu.123doks.com/thumbv2/9liborg/19490426.0/7.722.45.640.149.508/table-change-number-treatment-capacity-germany-austria-france.webp)
![Figure 1. Sewage sludge production and disposal in selected EU Countries [in thousand tones d.s.]](https://thumb-eu.123doks.com/thumbv2/9liborg/19490426.0/9.722.136.623.139.465/figure-sewage-sludge-production-disposal-selected-countries-thousand.webp)
![Space management in Poland in the light of the cohesion with the European Union : conditions, change directions : [abstract]](data:image/gif;base64,R0lGODlhAQABAIAAAP///wAAACH5BAEAAAAALAAAAAABAAEAAAICRAEAOw==)