EKONOMIA i ŚRODOWISKO
Journal of the Polish Association of Environmental and Resource Economists
E C O N O M I C S A N D E N V I R O N M E N T
No. 1 (76) • 2021
copyright © by: Fundacja Ekonomistów Środowiska i Zasobów Naturalnych Białystok 2021
ISSN 0867-8898 ISSN 2300-6420 (online)
Published by: Fundacja Ekonomistów Środowiska i Zasobów Naturalnych 15-092 Białystok, ul. Sienkiewicza 22
www.fe.org.pl; e-mail: czasopismo@fe.org.pl Publishing: Agencja Wydawnicza EkoPress
Process Manager Andrzej Poskrobko / tel. 601 311 838 Printed by: Partner Poligrafia Andrzej Kardasz www: www.ekonomiaisrodowisko.pl
ECONOMICS AND ENVIRONMENT
Journal of the Polish Association of Environmental and Resource Economists
EKONOMIA I ŚRODOWISKO
Czasopismo Polskiego Stowarzyszenia Ekonomistów Środowiska i Zasobów Naturalnych
T H E S C I E N T I F I C P R O G R A M M E B O A R D
Prof. Zbigniew Bochniarz (USA) • Prof. Tadeusz Borys • Dr Leon C. Braat (Netherlands) Prof. Adam Budnikowski • Prof. Eva Cudlinova (Czech Republic) • Prof. Józefa Famielec Prof. Bogusław Fiedor • Prof. Wojciech J. Florkowski (USA) • Prof. Kazimierz Górka Prof. Włodzimierz Kaczyński (USA) • Prof. Teresa Łaguna • Prof. Rafał Miłaszewski Prof. Bazyli Poskrobko • Prof. Leszek Preisner • Prof. Tomasz Żylicz
E D I T O R I A L T E A M
Editor in chief – Prof. Elżbieta Broniewicz Editors of particular sections – Prof. Stanisław Czaja
Prof. Eugeniusz Kośmicki, Prof. Barbara Kryk Prof. Dariusz Kiełczewski, Prof. Małgorzata Burchard-Dziubińska
The Secretary of Editorial Office – Dr Karolina Ogrodnik
EKONOMIA I ŚRODOWISKO 1 (76) • 2021
www.ekonomiaisrodowisko.pl
5
contents
THEORETICAL AND METHODOLOGICAL PROBLEMS
Rambabu Lavuri, Eddy Jusuf, Ardi Gunardi, Green sustainability: factors fostering and behavioural difference between Millennial and Gen Z: mediating role of green purchase intention ... 8
ENVIRONMENTAL POLICY AND MANAGEMENT
Agnieszka Baran, Sustainable innovations – selected aspects ... 40 Justyna Godawska, Environmental policy stringency and its impact on air pollution
in Poland ... 52
STUDIES AND MATERIALS
Milad Zargartalebi, Sustainability as a competitiveness factor: a quantitative cross-country analysis ... 70 Martin Rovnak, Lenka Stofejova, Peter Adamisin, Matus Bakon, Environmental aspects
of consumer shopping behaviour in packaging-free stores ... 91
GENERAL ENVIRONMENTAL AND SOCIAL PROBLEMS
Jolanta Pakulska, Emissions of major air pollutants as an indicator of quality of life
in Poland in 1990-2017 ... 106 Elena Rudan, Marinela Krstinić Nižić, Zvonimira Šverko Grdić, Effect of circular economy
on the sustainability of cultural tourism (Croatia) ... 120
DISCUSSION AND REVIEWS
Eugeniusz Kośmicki, The review of the book Contemporary gardening lexicon of decorative plants - knowledge for specialists and plant and garden aficionados ... 140 Summaries in Polish ... 145 Information for Authors – Submission Guidelines ... 150
Ekonomia i Środowisko 1 (76) • 2021 Economics and Environment 1 (76) • 2021
THEORETICAL AND METHODOLOGICAL PROBLEMS
PROBLEMY TEORETYCZNE
I METODYCZNE
EKONOMIA I ŚRODOWISKO • 1 (76) • 2021
GREEN SUSTAINABILITY: FACTORS FOSTERING AND BEHAVIOURAL DIFFERENCE BETWEEN MILLENNIAL AND GEN Z: MEDIATING ROLE OF GREEN PURCHASE INTENTION
ABSTRACT: This exploratory study examines the factors that promote green purchasing intentions and understand the differences between the two generations, such as millennial and Generations Z, on green purchasing behaviour. Data collected from 372 respondents from two generations from three southern Indian states. Purposive and snowball samplings were adopted in the selection of respond- ents. The data was analyzed using the IBM SPSS 23.0 package using Factor Analysis, Pearson Corre- lation, Multiple Regression, and t-test. Subjective norms (SNs) had no significant association with Green purchase intentions (GPI). Variables such as media exposure (ME), environmental concern (EC), environmental knowledge (EK), and attitude (EA), Perceived Behavioural Control (PBC) had a signifi- cant impact on the GPI. Shopper’s purchase intention substantially impacted their buying behaviour of green products, and these results supported the TPB model. The ME, SNs, and PBC variables did not show any behavioural differences between the two generations. Still, variables such as EK, EC, EA, and GPI showed a behavioural difference in purchasing green products.
KEYWORDS: Environmental Knowledge, Perceived behavioural, Environmental concern, Generation Z, Millennial, Subjective Norms
Rambabu Lavuri, PhD (ORCID: 0000-0002-0976-8126) – Osmania University, India Eddy Jusuf, Prof. – Universitas Pasundan, Indonesia
Ardi Gunardi, Assistant Prof. (ORCID: 0000-0002-0372-7067) – Universitas Pasundan, Indonesia
Correspondence address:
Jl. Tamansari No. 6-8, 40116, Bandung, Indonesia e-mail: ardigunardi@unpas.ac.id
Rambabu LAVURI • Eddy JUSUF • Ardi GUNARDI
JEL: M31, Q56 No. 1(76) 2021 • pages: 8-38 https://doi.org/10.34659/2021/1/1
EKONOMIA I ŚRODOWISKO 1 (76) • 2021 Theoretical and methodological problems
9
Introduction
Over the last few decades, society is facing an ecological situation and environmental security as tough challenges. Ecological issues such as global warming and exhaustion of natural resources affect consumers’ decisions in purchasing a product directly or indirectly. The enthusiasm in humans and the desire to get the maximum with the least effort resulted in destroying the fundamental supporting frameworks of life, i.e., air, water, and land (Smith, 2009). Businesses and human life have had a great deal of impact on environ- mental issues. Green promotion paved the way for finding the reasoning behind ecological problems such as global warming, biodiversity depletion, ozone degradation, pollution, and deforestation. Awareness among the con- sumers towards the environmental issues and green items is improving at a greater rate (Mahesh & Gomathi, 2016). Green marketing means the mar- keting of goods with more sustainable standards, such as improvements in the manufactured process, products, and packaging to make them more affordable and offer a different form of advertising (Sheikh, Mirza, Aftab
& Asghar, 2014). The World Health Organization report stated that every year in India, 5,27,700 deaths are due to air contamination, and 21% of the transmittable diseases are getting spread because of Water pollution (Mannarswamy, 2011). Sixty-nine percent of the general public agrees that pollution and environmental problems affect their everyday lives (Schlegel- milch, Bohlen & Diamantopoulos, 1996). Consumers are gradually choosing products based on their ecological impact (Grove, Fisk, Pickett & Kangun, 1996). Customers mainly drive the company’s environmental programs and eco-marketing strategy. Companies are now pursuing an eco-marketing plan that incorporates corporate and advertising priorities with ecological protec- tion (Smith & Brower, 2012).
The Theory of Planned Behaviour (TPB) is the cornerstone of the theo- retical approach for green product usage. In many research studies on the green consumption of goods, TPB has been used to estimate humans’ differ- ent behaviours, specifically in the context of green consumption (Paul, Modi
& Patel, 2016; Liobikienė, Mandravickaitė & Bernatonienė, 2016; Kumar, Manrai & Manrai, 2017; Shin, Im, Jung & Severt, 2018). The most famous the- oretical paradigm is explaining the intentions and behaviour of purchasing factors. This model provides an excellent conceptual framework for improv- ing consumers’ preferences for buying green products and understanding the various reasons for individuals’ behaviour. The extended model includes media exposure, environmental knowledge, and environmental concerns as variables.
EKONOMIA I ŚRODOWISKO 1 (76) • 2021 Theoretical and methodological problems
10
Public consciousness and environmental issues are rising in India. Vari- ous studies have shown the willingness of Indian consumers to purchase green goods. Such developments contribute to increasing research interest in green marketing, green goods, green advertising, and green consumer behav- iour. Currently, there is limited research on green consumers in India and green marketing. The study’s centrality focused on factors that foster green buying intentions and examined green purchase behaviour differences between the selected two generations, such as Millennial and Generations Z.
Based on the TPB approach, the research study seeks to expand the TPB to include three additional variables environment concern, knowledge, and media exposure.
Theoretical Framework
TRA (Fishbein & Ajzen, 1975) and TPB are two vital theoretical con- structs that may help understand this analysis. Theory of Reasoned Action (TRA) is the predecessor to Theory of Planned Behaviour (TPB). TRA reveals that the intention to execute the behaviour determines the specific behaviour to be taken. It implies a behavioural sense that arises from two factors, the behavioural attitude and the SNS. The TPB model is an extension of the TRA (Ajzen & Madden, 1986), proposed by Ajzen (1985), to enhance the Rational Idea of Action. It integrates PBC so that behavioural actions derive from behavioural attitudes, SNs, and BC. TPB ranked as the best model for predict- ing intentions (Yadav & Pathak, 2016) and, thus, for predicting behavioural intentions. This model is widely used by social psychologists (Fielding, McDonald & Louis, 2008). The intention is a deliberate action plan that includes explicit behaviour and a choice to act (Patch, Tapsell & Williams, 2005). Previous studies concluded that intent and general opinion are the strongest predictors of behaviour and completely mediate the effects of Atti- tude, SNs, and PBC (Gracia & De Magistris, 2007; Liobikienė et al., 2016).
Some research studies have endorsed the TPB model, PI, and PB as the main predictors in the TPB model (Liobikienė et al., 2016; Yadav & Pathak, 2017).
PI is also a critical factor in adopting Green goods (Rezai, Teng, Mohamed &
Shamsudin, 2012). Paul et al. (2016) have shown how this can contribute to environmental sustainability. Environmental sustainability refers to the abil- ity to preserve qualities of significant value in the physical environment (Jones, Comfort & Hillier, 2011), but the TPB model partly supported Chou, Chen, and Wang (2012); Kim, Njite & Hancer (2013) studies. The extended model includes media exposure, environmental knowledge, and environ- mental concerns as variables. Research hypothesis framed, as shown in fig- ure 1. The figure shows the association of the selected variables.
EKONOMIA I ŚRODOWISKO 1 (76) • 2021 Theoretical and methodological problems
11
Review of literature
Concept of millennial and generation-Z
Generations refer to the assembly of individuals influenced by a given time and whose characteristics were identical over a specified period. Sev- eral scholars agree about five main generations (Urbain, Gonzalez & Gall-Ely, 2013), such as silent generation, Baby Boomers, gen-X, gen-Y (Millennial), and gen-Z (Baycan, 2017).
The concept of Gen Y has no definitive proof of Generation Y period cov- erage. Some of the authors reveal that the people born in between 1978-1994 years; others find individuals who conceived as in between 1980-2000.
Therefore, Generation-Y is called “millennial” (Howe & Strauss, 2003). This generation’s people had witnessed childhood in a world-changing financially, ecologically, politically, socially, and technologically (Urbain et al., 2013).
Generation Y developed with the Internet launch and technological advances that fostered globalization (Djamasbi, Siegel, Skorinko & Tullis, 2011). These people would quickly adapt and exploit innovation from multiple perspec- Figure 1. Conceptual framework of research study
Source: author’s work.
ME
EK
EC
SK GPI GPB
PCB EA
Millennial
Gen Z
EKONOMIA I ŚRODOWISKO 1 (76) • 2021 Theoretical and methodological problems
12
tives (Viswanathan & Jain, 2013). This generation has self-positive feelings, Free-thinking people who are open to ethnic diversity (Yolbulan & Yalman, 2013), well-educated and informed (Urbain et al., 2013), and easy access to information.
The concept of the Gen -Z covers the people born in 1994 and after; on the other hand, people born after 2000 are Generation Z (Geck, 2007; Göksel
& Güneş, 2017). In the digital age, this generation opened its eyes to the world. In this way, the names given to this generation are “Generation I,”
“Versatile Generation,” “Performing multiple tasks,” and “Digital Age” (Göksel
& Güneş, 2017). From a very young age, these people are beginning to use digital technology platforms and have a high data capacity to access informa- tion (Taş, Demirdöğmez, & Küçükoğlu, 2017). Technology has become part of their daily lives to share views and build an efficient partnership between people and the Internet and the social networks (Göksel & Güneş, 2017; Taş et al., 2017).
Purchasing Attitude of generations
Millennial: This generation has a significant proportion of the world’s population. From the last few years, it has higher buying power relative to the remaining generations. Millennials are more interested in spending money on new goods and brands (Viswanathan & Jain, 2013), but not showing brand loyalty (Noble, Haytko & Phillips, 2009) and a cautious attitude towards green purchases (Lu, Bock & Joseph, 2013). Consumer expectations to use eco-friendly goods differ from generation to generation. The results conclude that Generation Y had a solid intention to buy green goods more than Gener- ation Z (Göksu, Koska & Erdem, 2017). Lu et al. (2013) found a strong rela- tionship between customer purchasing preferences and expectations con- cerning green product characteristics such as biodegradability, recycling, and health contribution, which determine the quality of goods, impacting the purchaser’s green purchasing conduct. Thus, this generation has a marketing research target (Baycan, 2017).
Generation Z: Generation Z research remains very small because they are young, linked to luxury shopping, technology, and the Internet, and mostly prefer online shopping rather than offline. Generation Z people are not addicted to brands and like to buy products displayed for themselves (Veiga-Neto, Ferreira, Nodari & Barreto, Miranda, 2018). These purchasers prefer more gluttonous goods than Generation Y. This generation of people has a better attitude towards green goods and a more significant commit- ment to the environment. Knowledge has been collected from formal and informal education sources; SNs have a considerable stimulus to their deci- sion-making processes and affect the GPI and GPB (Noor, Jumain, Yusof,
EKONOMIA I ŚRODOWISKO 1 (76) • 2021 Theoretical and methodological problems
13
Ahmat, & Kamaruzaman, 2017). Sarıtaş and Barutçu (2016) proposed that companies would organize pre-sales and networking efforts for Gen Y and Gen Z purchasers through social media.
Media Exposure (ME)
Several research studies agreed that media exposure played a pivotal role in disseminating information on ecological concerns. The whole and sort of media exposure on the environmental issues regularly have been turned into a significant public issue in society (Lowe & Rudig, 1986; Mitchell, 1990).
Schultz and Lauterborul (1993) explained that media exposure is a combina- tion of various media vehicles which allows viewers and readers to hear and see the message. It is a crucial driver for the communication of information.
It has a significant impact on the purchase intention of shoppers (Bass, 1969).
The most critical influence of media exposure on distribution is that it rap- idly spread awareness of technologies to broad audiences (Rogers, 2003).
There is no question as to whether such media can contribute to a change in drive and feeling (DeFleur & Dennis, 1998). Qader and Zainuddin (2011) found that access to media publicity has a significant impact on customers’
buying intention. It will raise public awareness regarding environmental con- cerns by growing the media’s share. It is changing shoppers’ attitudes towards sustainability and eco-green products and eco-greening the effect of green packaging studies on young consumers’ ecological obligations (Yilmaz & Ilter, 2017; Kardos, Gabor & Cristache, 2019) and shown impact on the purchase intent (Lavuri & Susandy, 2020). Therefore, ME has a solid factor for con- struct EK, EA towards GPI. Thus, the following hypotheses are framed.
H1a: ME has a positive association with EK H1b: ME has a positive association with EA H1c: ME has a positive association with GPI Environmental knowledge (EK)
Many consumers have inadequate environmental knowledge to act appropriately towards the environment (Kempton, Boster & Hartley, 1995).
EK refers to the understanding of shoppers about the effect of product use on the environment (D’Souza, Taghian & Khosla, 2007), revealing how the prod- uct is manufactured in an ecologically sustainable way (Lim, Yong & Suryadi, 2014). It includes the reality, values, and relationships with crucial ecosys- tems, such as environmental knowledge; and individuals’ ecological obliga- tion, contributing to sustainable growth (Taufique, Siwar, Chamhuri & Sarah, 2016). Individual EK has a significant impact on environmental problems and is linked to EA and PBC. Constructive action is a strong view of ecological
EKONOMIA I ŚRODOWISKO 1 (76) • 2021 Theoretical and methodological problems
14
issues (Laroche, Bergeron & Barbaro-Forleo, 2001). Exact data on environ- mental issues should make individuals more informed (Schahn & Holzer, 1990). Osman, Othman, Salahudin, & Abdullah (2016) said that consumers have positive knowledge of green marketing and green products due to a high level of eco-friendly products. Bradley, Waliczek, and Zajicek (1999) students with good environmental attitude high degree of awareness despite low information levels. EK is a significant contributor to consumers’ buying intent (Laroche, Toffoli, Kim & Muller, 1996; Lavuri & Susandy, 2020). Previous studies have shown that EK has a tremendous and positive association with EA (Granzin & Olsen, 1991; Lavuri & Susandy, 2020) and GPI and GPB (Kaiser
& Gutscher, 2003; Lavuri & Susandy, 2020). EK is also increasing in India (Chaudhuri, 2014). Achieving a higher degree of EK leads to much better environmental performance (Rokicka, 2002; Lavuri & Susandy, 2020). It has a good effect on GPI (Wang, Liu & Qi, 2014). However, some research studies have described EK’s impact on attitudes as inaccurate (Bogner, 1998). SNs affect the user’s decision because it is motivated to act on the knowledge they have (Bradley et al., 1999). Yang and Kahlor (2013) suggested that people who behave as per social norms should have paid close attention to informa- tion about the environment and therefore built a more robust knowledge.
With an adequate understanding of the environment, monitoring people’s PBC has improved (Kumar et al., 2017; Asif, Xuhui, Nasiri & Ayyub, 2018;
Lavuri & Susandy, 2020). Therefore, the below-given hypotheses followed.
H2a: EK has a positive association with EA H2b: EK has a positive association with SNs H2c: EK has a positive association with PBC H2d: EK has a positive association with GPI Environmental Concern (EC)
EC refers to peoples’ knowledge about ecological issues, ability, and interest in resolving environmental problems (Hu, Parsa & Self, 2010).
A green buyer is an individual who maintains a strategic distance from any item that could harm any aspect of ecological existence (Elkington, 1994). EC is a significant element in customers’ decision-making process (Diaman- topoulos, Schlegelmilch, Sinkovics & Bohlen, 2003). A growing number of EC customers would increase both the GPI (Aman, Harun & Hussein, 2012;
Lavuri & Susandy, 2020) and the GPB (Hutchins & Greenhalgh, 1997). Thus, the Individual EC was a great incentive to buy.
Likewise, the studies of Prakash and Pathak (2017) and Paul et al. (2016) have shown that EC has a substantial impact on the design of green packaged items. Individual EC affects the other GPI through the exercise of SNs, such as friends, peer groups, and family. They concluded that there was a strong cor-
EKONOMIA I ŚRODOWISKO 1 (76) • 2021 Theoretical and methodological problems
15
relation between EC and GPI. Khan and Mohsin (2017) study shows that interest, social value, and environmental values positively affect consumer preference for green products. Most researchers have mentioned that EC has a positive and significant impact on the EA and GPI (Albayrak, Aksoy & Caber, 2013; Yadav & Pathak, 2016; Lavuri & Susandy, 2020). In Canada, EC has a strong effect on EA towards GPB (Hanson, 2013; Lavuri & Susandy, 2020).
EA of customers has a direct and indirect impact on the EC, and thus EC influ- ences EA and GPI on the GPB (Hartmann & Apaolaza-Ibáñez, 2012).
SN is affected by an EC increase which reduces the sense of trouble. Con- sequently, EC affects the behaviour of friends, peer groups, and family who support or oppose GPB (Paul et al., 2016; Lavuri & Susandy, 2020). EC has positive effects on SNs and PBC for decision-making, which have been highly experienced by EC students rather than by low-level students (Bamberg, 2003). Many customers revisit green hotels because EC, SN, and PBC have indirectly influenced their intentions (Chen & Tung, 2014). Therefore, the hypotheses were followed.
H3a: EC has a positive association with GPI H3b: EC has a positive association with EA H3c: EC has a positive association with SN H3d: EC has a positive association with PBC Subjective Norms (SNs)
A subjective norm refers to the perceived social pressure to perform or not to perform a specific behaviour (Ajzen, 1991; Han, Hsu & Sheu, 2010).
It is an individual opinion that has a strong effect on that individual’s buying decision and behaviour (Park, 2000). Past studies show that family members, peer groups, friends, and colleagues set SNS; and their optimistic perception has a significant impact on the decision and attitudes of individuals to pur- chase green (Teng & Lu, 2016; Paul et al., 2016; Singh & Verma, 2017; Du, Bartels, Reinders & Sen, 2017; Yilmaz & Ilter, 2017; Hansen, Sørensen & Erik- sen, 2018), organic products (Dean, Raats & Shepherd, 2012), and most of the clients are re-visiting to green hotels (Teng, Wu, & Liu, 2015; Chen &
Tung, 2014). Many studies have shown that subjective norms affect green consumption immensely (Zukin & Maguire, 2004). The family members’ val- ues and norms are closely correlated with the green purchasing intention in Thailand (Wiriyapinit, 2007). In the Indian scenario, subjective norms signif- icantly affect buying preferences for green goods (Yadav & Pathak, 2017).
However, the Khare (2015) study found that there is no association between SNs and GPB. Paul et al. (2016) and Lavuri and Susandy (2020) studies con- cluded that there is no significant association between subjective norms and
EKONOMIA I ŚRODOWISKO 1 (76) • 2021 Theoretical and methodological problems
16
GPI Intention. Thus, subjective norms are an essential factor in promoting green purchasing intentions. Therefore, the following hypothesis was framed:
H4a: SNs has a positive association with GPI Environmental Attitude (EA)
Attitude refers to the psychological pattern reflected by determining some degree of favour or disfavour for a specific person (Bonne, Vermeir, Bergeaud-Blackler & Verbeke, 2007). EA is a pro-environmental deciding fac- tor (Wesley, Lee & Kim, 2012; Nagar, 2015). Shoppers who have EA feel like they are part of the World (Zelezny, Chua & Aldrich, 2000). Previous studies have shown that positive EA is a critical factor (Uddin & Khan, 2016), directly affecting the GPI and GPB (Nguyen, Lobo & Nguyen, 2017; Lavuri & Susandy, 2020). The EA of shoppers has a massive effect on GPI and GPB (Zhao, Gao, Wu, Wang & Zhu, 2014; Lavuri & Susandy, 2020) with a strong correlation (Uddin & Khan, 2016; Lavuri & Susandy, 2020). Particularly, Shoppers EA has a good relationship with ecological concern (Straughan & Roberts, 1999;
López & Cuervo-Arango, 2008; Lavuri & Susandy, 2020), apparel buying behaviour (Butler & Francis, 1997), and GPB (Tilikidou, 2007; Lavuri &
Susandy, 2020). EA is a significant variable that affects GPB based on literary reviews. Therefore, the hypothesis was followed.
H5a: EA has a positive association with GPI Perceived Behavioural Control (PBC)
PBC refers to the perception of performing particular conduct is easy or difficult (Ajzen, 1991). A specific behaviour happens if a person is motivated and capable of acting instead of simply having one or no reasons (Zhou, Thøgersen, Ruan & Huang, 2013). According to the TPB model, the formation of prior intention is critical for creating perceived behavioural control. The perceived allowances are perceptive evidence that customers have or using while purchasing goods. Olsen (2004) noted that significant PBC variables, such as convenience and efficiency, affect consumers’ purchasing of food.
Many studies have shown that PBC has the best human predictor. PBC had a positive connection with the consumer intent (Baker, Al-Gahtani & Hubona, 2007), such as organic products /foods (Moser, 2015) and green hotels (Bryła, 2016; Kapuge, 2016; Savita & Verma, 2017; Oroian et al., 2017; Mai- chum, Parichatnon & Peng, 2017; Asif et al., 2018; Lavuri & Susandy, 2020).
The role of PBC is assessing purchasing intention and behaviour of custom- ers towards green purchases (Paul et al., 2016; Yadav & Pathak, 2017; Lavuri
& Susandy, 2020).
H6a: PBC has a positive association with GPI
EKONOMIA I ŚRODOWISKO 1 (76) • 2021 Theoretical and methodological problems
17
Green purchasing intention and behaviour (GPI & GPB)
Intention refers to a person’s willingness to execute a specified behaviour (Yadav & Pathak, 2017) and a motive, like readiness to act. According to TPB, performance is a result of intentions when the behaviour is voluntary. SNs and EA action positively impact the PI to PB (Shashi, Kottala, & Singh, 2015;
Singh & Verma, 2017; Savita & Verma, 2017). In the Yadav and Pathak (2017) study, the relationship between intentions and green purchasing behaviour is positive and strong.
In recent years, it has raised the number of shoppers’ willingness to pur- chase green items. GPB has been measured by some of the ecological concern factors (Lee, 2008; Akehurst, Afonso & Gonçalves, 2012), such as Ecological Attitude (Joshi & Rahman, 2015; Uddin & Khan, 2016), shoppers personality characteristics (Gayathree, 2016), ecological knowledge (Lee et al., 2009), green marketing approaches, product quality and ecological issues (Joshi &
Rahman, 2015; Manongko & Kambey, 2018). These were investigated as fac- tors affecting shoppers’ GPB (Khan & Kirmani, 2015; Kirmani & Khan, 2016;
Adnan, Ahmad & Khan, 2017; Lavuri & Susandy, 2020). Motivating factors, such as social obligation, awareness, ecological concern, social influence, and consumer interests, are the driving factors for green buying behaviour (Arli, Tan, Tjiptono & Yang, 2018; Lavuri & Susandy, 2020).
H7a: GPI has a positive association with GPB
Methods
The present research study has been conducted to understand the fac- tors that foster green purchase intentions and examine the behavioural dif- ferences between two generations related to green purchases. We have used an offline survey method and an online survey method (e-mails) adminis- tered to a non-probability sample of 372 Indian respondents to evaluate the hypothesized relationship in this study. We used snowball and purposive sampling methods to collect data from the specified sample areas, i.e., three States of India (Telangana, Andhra Pradesh, and Tamil Nadu). Initially, a structured questionnaire has used to test the quantitative analysis to assess the proposed models’ relationship. The questionnaire was evaluated by a pilot study of 105 respondents from the two study generations; who expe- rienced purchasing eco-sustainable products. After a pre-test, the question- naire was finalized with few changes to reduce the sample population’s com- plexity. The questionnaire consists of two parts. The first part has five ques- tions relating to the demographic status of two generations. The second part has 29 items divided into eight constructs, such as ME, EA, EK, EC, SNs, PBC,
EKONOMIA I ŚRODOWISKO 1 (76) • 2021 Theoretical and methodological problems
18
GPI, and GPB. To grasp the exposure impact on the green respondents, five items of the ME scale adopted from the studies of Qader and Zainuddin (2011) and Lavuri and Susandy (2020). Similarly, four items assess the respondent’s EA, and the scale was adopted from Anbukarasi and Dheivanai (2017); Lavuri and Susandy (2020). Four items scale was adopted to mea- sure the respondent’s EK level, and the scale was adopted from Asha and Rathiha (2017) and Lavuri and Susandy (2020). Four items of the EC scale was adopted from the studies of Asha and Rathiha (2017) and Lavuri and Susandy (2020). SNs, PBC, GPI, and GPB variables have three items for each, and the scales were adopted from (Demirtas, 2019; Lavuri and Susandy (2020). The researcher used the five-point Likert scale, ranging from 5 = strongly disagree to 1 = strongly agree, to measure green purchasing intentions and purchasing behavioural differences. Overall, 611 question- naires have distributed under non-probability sampling in the three states of India, and 60.8% (372) of the respondents provided feedback. 61.8% of the Telangana; 59.5% of the Andhra Pradesh; 60.4% of the Tamil Nadu. The fol- lowing techniques, such as descriptive statistics, Pearson correlation, multi- ple regressions, and independent t-test, were used to evaluate the data. The researcher used MS-Word, Excel, and SPSS version 23.0 software to analyze the data.
Results
Demographic statistics samples
This section included the sample demographic state over two genera- tion’s variables such as gender, educational background, occupation, and income rates in the participant’s demographic profiles.
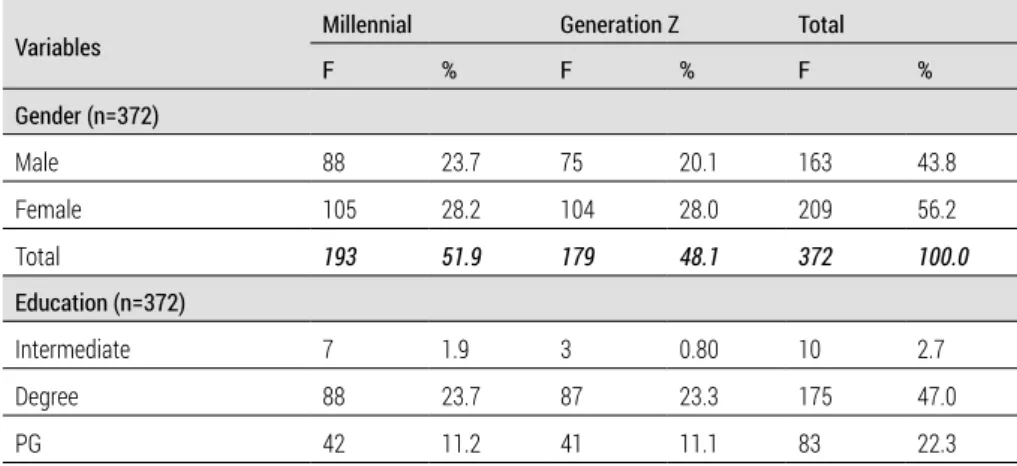
Table 1. Generations of demographic statistics
Variables Millennial Generation Z Total
F % F % F %
Gender (n=372)
Male 88 23.7 75 20.1 163 43.8
Female 105 28.2 104 28.0 209 56.2
Total 193 51.9 179 48.1 372 100.0
Education (n=372)
Intermediate 7 1.9 3 0.80 10 2.7
Degree 88 23.7 87 23.3 175 47.0
PG 42 11.2 41 11.1 83 22.3
EKONOMIA I ŚRODOWISKO 1 (76) • 2021 Theoretical and methodological problems
19
Variables Millennial Generation Z Total
F % F % F %
Above PG 56 15.0 48 12.9 104 27.9
Total 193 51.9 179 48.1 372 100.0
Occupation (n=372)
Govt. Employee 33 8.8 17 4.6 50 13.4
Private employee 61 16.4 171 46.0 232 62.4
Business 2 0.6 6 1.6 8 2.2
Homemaker 31 8.3 29 7.8 60 16.1
Student 9 2.4 13 3.5 22 5.9
Total 193 51.9 179 48.1 372 100.0
Monthly Income level (n=372)
Below 50,000 24 6.4 30 8.1 54 14.5
50,001-1,00,000 36 9.7 41 11.0 77 20.7
1,00,001-1,50,000 111 29.8 80 21.5 191 51.3
1,50,001-2,00,000 13 3.5 13 3.5 26 7.0
2,00,001 and above 9 2.4 15 4.1 24 6.5
Total 193 51.9 179 48.1 372 100.0
Family type (n=372)
Nuclear Family 148 39.8 147 39.5 295 79.3
Joint family 45 12.1 32 8.6 77 20.7
Total 193 51.9 179 48.1 372 100.0
Source: author’s work.
Table 2. Eco-green items recently purchased by consumers
Eco-Friendly Green Products Sample Useable feedback Per cent
Recyclable paper items 67 41 13.7
Compostable paper plates 42 39 12.9
Health and Beauty items 37 26 08.6
Electronic applicants 83 86 28.5
Green packaging bags 64 53 17.6
IT types of equipment 79 56 18.7
Total 372 301 80.9
Note: (n= 80.9 percent; 301 out of 372).
Source: author’s work.
EKONOMIA I ŚRODOWISKO 1 (76) • 2021 Theoretical and methodological problems
20
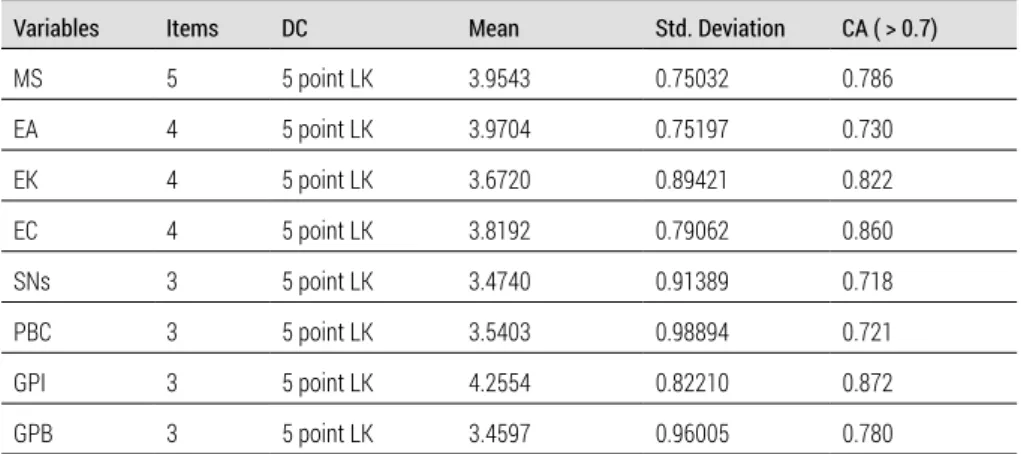
Reliability and validity
The Cronbach alpha test has been conducted to track the sample compo- nent’s internal consistency to award the amount of reliability. Alpha Cron- bach would be higher than 0.7 (DeVellis, 2016); when alpha levels are more than 0.7 – appropriate and 0.8 and above are favoured. The outcomes of the reliability, mean, and standard deviation of the investigations were: reliabil- ity of MS, EA, EK, EC, SNs, PBC, GPI, and GPB were 0.786, 0.730, 0.822, 0.860, 0.718, 0.721, 0.872, and 0.780. The mean values of the scale were 3.9543, 3.9704, 3.6720, 3.8192, 3.4740, 3.5403, 4.2554, and 3.4597 for MS, EA, EK, EC, SNs, PBC, GPI, and GPB. Similarly, scale Std. Deviation values for respected variables were 0.75032, 0.75197, 0.89421, 0.79062, 0.91389, 0.98894, 0.82210 and 0.96005 (see table 3).
Table 3. Scale construction
Variables Items DC Mean Std. Deviation CA ( > 0.7)
MS 5 5 point LK 3.9543 0.75032 0.786
EA 4 5 point LK 3.9704 0.75197 0.730
EK 4 5 point LK 3.6720 0.89421 0.822
EC 4 5 point LK 3.8192 0.79062 0.860
SNs 3 5 point LK 3.4740 0.91389 0.718
PBC 3 5 point LK 3.5403 0.98894 0.721
GPI 3 5 point LK 4.2554 0.82210 0.872
GPB 3 5 point LK 3.4597 0.96005 0.780
DC: Descriptive of scale; LK: Likert Scale; CA: Cronbach Alpha.
ME: Media Exposure; EK: Environmental knowledge; EC: Environmental Concern; EA: Environmental Attitude;
SNs: Subjective Norms; PBC: Perceived behavioural control; GPI: Green purchase intention; GPB: Green purchase behaviour.
Source: author’s work.
Factor analysis
Factor analysis has been used for the detection of factors influencing the actions of consumers buying green goods. The statistical approach consists of finding a way to condense information in various initial variables into more minor variables with zero information loss.
The estimation of the KMO sample is an indicator of the factor analysis’s adequacy to be tested. The broad (0.5-1.0) significance makes the study of the factor acceptable, as the data is internally consistent with important var-
EKONOMIA I ŚRODOWISKO 1 (76) • 2021 Theoretical and methodological problems
21
iables (ME: KMO=0.775; X2 = 525.166; DF = 5 and P<0.001; EA: KMO = 0.749;
X2 = 293.554; DF = 6 and P<0.001; EK: KMO = 0.790; X2 = 532.076; DF = 6 and P<0.001; EC: KMO = 0.672; X2 = 420.391; DF = 6 and P<0.001; SNs: KMO = 0.
719; X2 = 386.112; DF = 3 and P<0.001; PBC: KMO= 0. 724; X2 = 524.031; DF
= 3 and P<0.001; GPI: KMO = 0.729; X2 = 582.188; DF = 3 and P<0.001; GPB:
KMO = 0.703; X2 = 306.549; DF = 3 and P<0.001) have been noted as good.
The sphericity check by Bartlett shows the strength of the interaction between variables. The degree of significance measured was 0.000. The strength of the relation between the variables was high. Therefore, data was reasonable to analyze the elements. The pivot of Varimax was monitored through 29 dimensions relating to 8 unique factors, which were ME (5 items), EA (4 items), EK (4 items), EC (4 items), SNs (3 items), PBC (3 items), GPI (3 items), and GPB (3 items) (see table 4).
Table 4. Exploratory Factor Analysis (EFA)
Variables KMO (NI) X2; DF EV %Var FL
Media exposure (ME) ME1
0.775 (5) 525.166; 5
(P<0.001) 2.717 54.338
.784
ME2 .811
ME3 .727
ME4 .636
ME5 .714
Environmental Attitude (EA) EA1
0.749 (4) 293.554; 6
(P<0.001) 2.219 55.481
.709
EA2 .770
EA3 .784
EA4 .714
Environmental Knowledge (EK) EK1
0.790 (4) 532.076; 6
(P<0.001) 2.611 65.265
.835
EK2 .836
EK3 .840
EK4 .713
Environmental concern (EC) EC1
0.672 (4) 420.391; 6
(P<0.001) 2.322 58.045
.782
EC2 .693
EC3 .833
EC4 .733
EKONOMIA I ŚRODOWISKO 1 (76) • 2021 Theoretical and methodological problems
22
Variables KMO (NI) X2; DF EV %Var FL
Subjective Norms (SNs) SNs1
0. 719 (3) 386.112; 3
(P<0.001) 2.201 73.358
.756
SNs2 .759
SNs3 .754
Perceived behavioural control (PBC) PBC1
0. 724 (3) 524.031; 3
(P<0.001) 2.345 78.170
.755
PBC2 .803
PBC3 .794
Green purchase Intentions (GPI) GPI1
0. 729 (3) 582.188; 3
(P<0.001) 2.398 79.923
.864
GPI2 .906
GPI3 .911
Green purchase Behaviour (GPB) GPB1
0. 703 (3) 306.549; 3
(P<0.001) 2.085 69.499
.831
GPB2 .828
GPB3 .842
Note: X2: Chi-square; DF: Degree of freedom; EV: Eigenvalues; %Var: Percent of variance; FL: Factors Loading; NI:
No. of items.
Source: author’s work.
The exploratory factor analysis (EFA) consists of eight variables, and the 1st variable (ME) in EFA with an eigenvalue of 2.717%, with a total variance of 54.338. The following variables followed: 2nd, 3rd, 4th, 5th, 6th, 7th and 8th with an eigenvalues of 2.219, 2.611, 2.322, 2.201, 2.345, 2.398 and 2.085;
Likewise, these eight variables have an explanatory variance of 55.481%, 65.265%, 58.045%, 73.358%, 78.170%, 79.923% and 69.499%. These fac- tors had a strong effect on green purchase intention (see table 4).
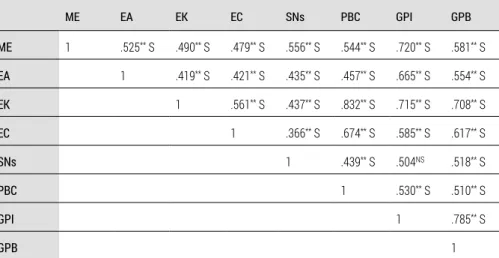
Pearson Correlation
The correlation test determines the linear association among the chosen variables. It providing significance from +1 to -1; +1 implies perfect correla- tion, -1 shows a negative correlation, and 0 does not imply any relationship in this situation. The numerical coefficient values represent the extent of the interaction between variables.
The use of Pearson analysis measures the direct relationship between selected variables such as ME, EA, EK, EC, SNs, PBC, GPI, and GPB. The analy- sis was accurate, with a coefficient ranging from 0.366 to 0.832 for variables
EKONOMIA I ŚRODOWISKO 1 (76) • 2021 Theoretical and methodological problems
23
and the results of the Pearson correlation (n=372) between the eight selected variables. The correlation coefficient statistics reflect the degree of associa- tion between each construct, fostering green purchasing intention and pur- chasing. The results show that ME had positive relationship with EK(r = 0.490**; p<0.01) and EA (r = .525**; p<0.01); had strong relationship with GPI (r = .720**; p<0.01) at 1% significance level, these results were supported by the Schultz and Lauterborul (1993) study. EA is a key factor (Uddin &
Khan, 2016) and had a significant impact on the GPI (r = .665**; p<0.01) at a 1% significance point, which had confirmed by these findings (Nguyen et al., 2017). EK had significant effect on PBC (r = .832**; p<0.01); GPI (r = .715**;
p<0.01) and GPB (r = .708**; p<0.01) at a 1% significance point, and these findings were confirmed by Mostafa (2009) and Birgelen, Semeijn, and Keicher (2009). Likewise, EC had a measurable impact on the GPI (r = .715**;
p<0.01) and GPB (r = .715**; p<0.01) at 1% of significance level, and these results supported the study of Albayrak et al. (2013) and Yadav and Pathak (2016). SNs had positive effect on GPB (r = .518**; p<0.01) and GPI (r = .504**; p<0.01), which were endorsed by Yilmaz and Ilter 2017; Hansen et al.
(2018); Yadav and Pathak (2017). PBC had strong and substantial effect on GPI (r = .530**; p<0.01) and GPB (r = .510**; p<0.01) confirmed by the Yadav and Pathak studies (2017) and Paul et al. (2016). GPI had a strong impact on the GPB (r = .785**; p<0.01) at 1% of the significance level, as confirmed by Yadav and Pathak (2017) (see table 5).
Table 5. Pearson Correlation
ME EA EK EC SNs PBC GPI GPB
ME 1 .525** S .490** S .479** S .556** S .544** S .720** S .581** S EA 1 .419** S .421** S .435** S .457** S .665** S .554** S EK 1 .561** S .437** S .832** S .715** S .708** S
EC 1 .366** S .674** S .585** S .617** S
SNs 1 .439** S .504NS .518** S
PBC 1 .530** S .510** S
GPI 1 .785** S
GPB 1
Note: **: p< 0.01(2 tailed); S: Significant Source: author’s work.
EKONOMIA I ŚRODOWISKO 1 (76) • 2021 Theoretical and methodological problems
24
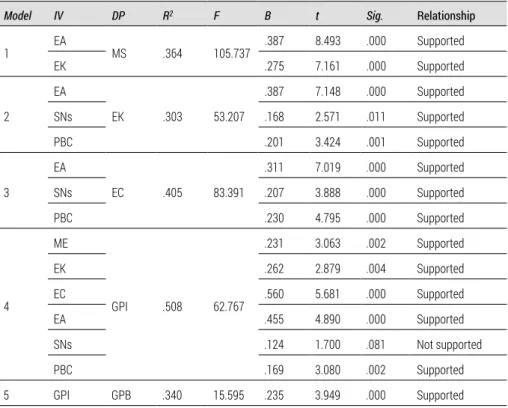
Multiple Regression
Multiple Regressions clarify the relationship and assistance of predictors and dependent factors to understand the predictors’ consistency effect and dependent factors.
Table 6. Multiple regression Results
Model IV DP R2 F B t Sig. Relationship
1 EA
MS .364 105.737 .387 8.493 .000 Supported
EK .275 7.161 .000 Supported
2
EA
EK .303 53.207
.387 7.148 .000 Supported
SNs .168 2.571 .011 Supported
PBC .201 3.424 .001 Supported
3
EA
EC .405 83.391
.311 7.019 .000 Supported
SNs .207 3.888 .000 Supported
PBC .230 4.795 .000 Supported
4
ME
GPI .508 62.767
.231 3.063 .002 Supported
EK .262 2.879 .004 Supported
EC .560 5.681 .000 Supported
EA .455 4.890 .000 Supported
SNs .124 1.700 .081 Not supported
PBC .169 3.080 .002 Supported
5 GPI GPB .340 15.595 .235 3.949 .000 Supported
Note: IV: Independent variable, DP: Dependent Variable.
Source: author’s work.
This section shows the summary results of multiple regressions. Five models were designed to explore the relationship between study variables in this research, such as ME, EK, EC, EA, SNs, PBC, GPI, and GPB. The results showed that the F-values of the five models were statistically significant at 105.737 (M-1), 53.207 (M-2), 83.391 (M-3), and 62.767 (M-4) and 15.595 (M-5). Model 1 indicates that ME had significant effect on EA (b = 0.387, p≤0.001) and EK (b = 0.275, p≤0.001) and causes 36.4% variance independent variables. Likewise, Model 2 reveals that EK had strong effect on the EA (b = 0.387, p≤0.001) and PBC (b = 0.201, p≤0.001) of 53.2% of the variance induced by independent variables. Model 3 reveals that the EC had major
EKONOMIA I ŚRODOWISKO 1 (76) • 2021 Theoretical and methodological problems
25
influence on the EA (b= 0.311, p≤0.001) and PBC (b = 0.230, p≤0.001) the 40.5% of variance explained by the independent variable. For the estimated regression model-4, the overall R2 was 0.508. This means that the predictor explained 50.8% of the variance of the dependent variable. It is evident that EC emerged as the most important variable and had a significant impact on the GPI (b = 0.560, p≤0.001). Likewise, EA had statistical significance on the GPI (b = 0.455, p≤0.001) and EK (b = 0.262, p≤0.001). Still, SNs were not statistically significant and had no impact on the GPI (b = 0.124, p≥0.001), its sig. Value was more than p-value. As a result, it can be inferred that EC sig- nificantly impacted the GPI towards green products. The amount of consumer EA and EK had a significant impact on the GPI towards green products.
Concerning model 5 shows that the overall R2 was 0.340. This means that 34% of variance explained by a predictor, and the F value (15.595) statisti- cally significant at a 1% significance level. GPI had a positive impact on the GPB, and it was seen as statistically significant (b= 0.235, p≤0.001) (see table 6).
Independent sample t-test
An independent t-test can detect the statistical difference between the group’s means. It has been conducted to describe the significance of the mean difference in ME, EK, EC, EA, SNs, PBC, and GPI between the two generations, i.e., Millennial and Generation-Z their GPB.
H8: ME, EK, EC, EA, SNs, PBC, and GPI have significant mean differences with GPB between Millennial and Generation Z.
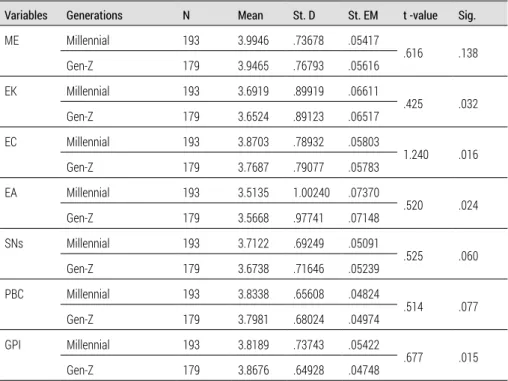
This section shows that variables such as ME, EK, EC, EA, SNs, PBC and GPI had significant mean difference in GPB of the two generations. The results showed that the sig. (2 tailed) values of ME (t = .616; p = 0.138); SNs (t = 0.525;
p = 0.060) and PBC (t = .514; p = 0.077) were more than p-value (>0.05), which means that there was no significant mean difference with GBP between the two-generations. Thus, the findings concluded that the ME, SNs and PBC variables had similar effects on the GPB of millennial and the Gen-Z genera- tions. Similarly, the p values of EK (t = 0.425; p = 0.032); EC (t = 1.240;
p = 0.016); EA (t = .520; p = 0.024) and GPI (t = .677; p = 0.015) were statisti- cally significant (2 tailed), because these variables sig. values were smaller than the p-value (<0.05), which means that there was significant mean differ- ence between two generations. Hence, the findings concluded that the EK, EC, EA and GPI variables had different effects on the GPB of two generations (see table 7).
EKONOMIA I ŚRODOWISKO 1 (76) • 2021 Theoretical and methodological problems
26
Table 7. Independent sample t-test result
Variables Generations N Mean St. D St. EM t -value Sig.
ME Millennial 193 3.9946 .73678 .05417
.616 .138
Gen-Z 179 3.9465 .76793 .05616
EK Millennial 193 3.6919 .89919 .06611
.425 .032
Gen-Z 179 3.6524 .89123 .06517
EC Millennial 193 3.8703 .78932 .05803
1.240 .016
Gen-Z 179 3.7687 .79077 .05783
EA Millennial 193 3.5135 1.00240 .07370
.520 .024
Gen-Z 179 3.5668 .97741 .07148
SNs Millennial 193 3.7122 .69249 .05091
.525 .060
Gen-Z 179 3.6738 .71646 .05239
PBC Millennial 193 3.8338 .65608 .04824
.514 .077
Gen-Z 179 3.7981 .68024 .04974
GPI Millennial 193 3.8189 .73743 .05422
.677 .015
Gen-Z 179 3.8676 .64928 .04748
Note: St.D: Standard deviation; St.EM: Standard Error Mean.
Source: author’s work.
Discussions and Conclusions
Environmental issues are increasing rapidly in India. Eco-consciousness has become a new Mantra of Victory, and people from every life stage are looking at it. This study examines the factors that foster green buying inten- tions and buying behavioural differences between millennials and the Z gen- eration of green goods. Researchers used eight key variables such as ME, EK, EC, EA, SNs, PBC, GPI, and GPB, with 29 items affecting mainly two-genera- tion behaviour in six cities of three states in India. Based on the TPB approach, the research study seeks to expand the TPB to include three additional varia- bles environment concern, knowledge, and media exposure. The findings of the study have shown that consumers are ecologically conscious and con- cerned about environmental sustainability. Consumers are exposed to media exposure, such as television, newspapers and magazines, the outdoors, and the Internet. It plays a critical role in communicating about environmental issues and green goods.
EKONOMIA I ŚRODOWISKO 1 (76) • 2021 Theoretical and methodological problems
27
Concerning the study’s findings, media exposure had a significant impact on EK (H1a), EA (H1b) and directly impacts the GPI and these results and the results confirmed by the studies of Schultz and Lauterborul (1993) and Lavuri and Susandy (2020). In the same way, a high degree of EK leads to a much better environmental performance. Individual EK had a significant impact on environmental problems and was linked to EA and PBC. The find- ings show that it had a strong impact on the EA (H2a), SNs (H2b), PBC (H2c) and GPI (H2d) and these results confirmed by Chaudhuri (2014), Wang et al.
(2014) and Lavuri and Susandy (2020). The findings show that there was a positive relationship between EC, PBC, SNs and GPI. EC had a positive impact on the EA (H3b) and PBC (H3d) and had a powerful impact on the GPI (H3a), these results confirmed by the studies of Granzin and Olsen (1991), Kim, Yun, and Lee (2014) and Lavuri and Susandy (2020). But SNs did not impact GPI (H4), and this results supported by the Lavuri and Susandy (2020). At the same time, EA (H5), PBC (H6) had a significant impact on the GPI (H5) and the result supported by the studies of Uddin and Khan (2016);
Lavuri and Susandy (2020). Finally, study factors such as ME, EC, EA, EK, and PBC had significant effects on customers GPI. These findings sugges t that these factors had a strong incentive to GPI towards GPB. These findings sup- ported the studies of Nguyen et al. (2017); Yadav and Pathak (2017); Lavuri and Susandy (2020). Finally, these findings reveal that these variables had vital fostering for GPI users towards GPB. GPI had a significant and substan- tial impact on the GPB (H7) and was supported by the research of Yadav and Pathak (2017); Lavuri and Susandy (2020).
Regarding the associations of behavioural variations between genera- tions, the ME, SNs, and PBC variables did not show any significant mean dif- ference between the two generations of GPB. This finding indicated that these factors had a comparable impact on the GPB of two generations. Simi- larly, the variables EK, EC, EA, and GPI showed a large mean difference between the two generations of GPB.
The research results concluded that the variables EK, EC, EA, and GPI had different effects on the GPB of the two generations. In contrast, the remaining variables did not indicate any difference to GPB. Research focuses on factors that explore green purchasing behaviour. This context will help policymakers and managers develop and implement strategies to promote green aware- ness and stimulate customer purchase behaviour. This study encourages aca- demics to understand the nature and purpose of the research study and the factors that impact green purchasing behaviour on shoppers. This study ena- bles them to develop a new, innovative model for consumer buying actions.
EKONOMIA I ŚRODOWISKO 1 (76) • 2021 Theoretical and methodological problems
28
Implications, limitations, and future directions
Research implications: The research study had significant implications for the corporate administrators in promoting green products in South India.
The research findings will increase understanding among marketers of two generations of behavioural intentions to buy sustainable goods. Because PBC is closely connected with the GPI, marketers must make attempts to enhance their understanding of all the variables selected in the model proposed. EC found to impact the EA, SNs significantly, and PBC in the Expected Behaviour Model may help marketers target marketers with a strong GPI and GPB response. The GPI has dramatically influenced MS, EK, EC, EA, and PBC among six TPB predictors. This influence can also be made to improve the attitudes of consumers towards GPB. Likewise, suppose green products can be readily accessible with minimal efforts to reach customers. In that case, it can boost customer interest and encourage marketing professionals to increase green demand. As a result, the GPI and the GPB have substantially correlated with PBC.In this way, marketers may consider expanding green options by enhanc- ing R&D accessibility and opening alternative distribution channels (Paul et al., 2016) to improve the accessibility of green goods. Thus, the problem of purchasing sustainable goods is reduced, and consumer perception control is improved. SNS does not affect the GPI. Policymakers need to form societal attitudes about green goods being helpful. Campaigns and ads showing wors- ening environmental conditions can enhance awareness of ecological con- cerns, which may contribute to green consumption.
This will profit in the long run by making green consumption a socially acceptable norm and behaviour that affects individuals’ intentions, attitudes, and behaviours towards green goods. As part of CSR activities, organizations are entitled to participate in these activities, which allow them to benefit dually from improved external reputation and increased green product sales.
The business will have a business strategy that incorporates green sustain- ability, which will also lead to organizations’ sustainable competitiveness.
Finally, this research will help policymakers develop policies and strategies to promote the adoption of GPUs. It helps to ensure environmental protec- tion through a better understanding over two generations of GPI and GPB factors.
Limitations of the study: The study›s geographical area is limited to only six selected cities from three South Indian states. Consequently, the findings and conclusions of the study have their limits. The research used the information continuum with a purposive and snowball approach that does not necessarily generalize the analysis findings. The rural sector has not
EKONOMIA I ŚRODOWISKO 1 (76) • 2021 Theoretical and methodological problems
29
been considered in this research study. In the future, it is possible to discuss the role of green marketing in rural areas.
Future directions: The researchers carefully chose the sample, but the scope for further research exists. The present study only measured two gen- erations of respondents (Millennial and gene Z) deliberately targeting envi- ronmentally friendly green products. Future research may be done on the various cultural and social contexts. It will be possible to investigate the influence of consumer demographic situations such as altruism, psychologi- cal factors, and eco-knowledge on eco-green products. Cross-cultural studies and demographic measures could be helpful for more profound insights across different generations.
The contribution of the authors
Rambabu Lavuri – 60% (conception, literature review, acquisition of data, analysis and interpretation of data).
Eddy Jusuf – 20% (conception, literature review, acquisition of data, analysis and interpretation of data).
Ardi Gunardi – 20% (conception, literature review, acquisition of data, analysis and interpretation of data).
References
Adnan, A., Ahmad, A., Khan, M.N., 2017. Examining the role of consumer lifestyles on ecological behaviour among young Indian consumers. Young Consumers, 18(4), 348-377, https://doi.org/10.1108/YC-05-2017-00699.
Ajzen, I., 1985. From intentions to actions: A theory of planned behaviour. In: Kuhl, J., Beckham, J. (Eds.), Action control: from cognition to behaviour. Springer-Verlag, New York.
Ajzen, I., 1991. The theory of planned behaviour. Organizational Behaviour and Human Decision Processes, 50(2), 179-211, https://doi.org/10.1016/0749- 5978(91)90020-T.
Ajzen, I., Madden, T.J., 1986. Prediction of goal-directed behaviour: Attitudes, inten- tions, and perceived behavioural control. Journal of Experimental Social Psychol- ogy, 22(5), 453-474, https://doi.org/10.1016/0022-1031(86)90045-4.
Akehurst, G., Afonso, C., Gonçalves, H.M., 2012. Re-examining green purchase behav- iour and the green consumer profile: new evidences. Management Decision, 50(5), 972-988, https://doi.org/10.1108/00251741211227726.
Albayrak, T., Aksoy, Ş., Caber, M., 2013. The effect of environmental concern and scep- ticism on green purchase behaviour. Marketing Intelligence & Planning, 31(1), 27-39, https://doi.org/10.1108/02634501311292902.
Aman, A.L., Harun, A., Hussein, Z., 2012. The influence of environmental knowledge and concern on green purchase intention the role of attitude as a mediating var- iable. Journal of Arts and Social Sciences, 7(2), 145-167.
EKONOMIA I ŚRODOWISKO 1 (76) • 2021 Theoretical and methodological problems
30
Anbukarasi, D.M., Dheivanai, M.N., 2017. An analytical study on consumers’ aware- ness towards green fast moving consumer goods in Coimbatore district. Interna- tional Journal of Management Studies, 4(4).
Arli, D. et al., 2018. Exploring consumers’ purchase intention towards green products in an emerging market: The role of consumers’ perceived readiness. Interna- tional Journal of Consumer Studies, 42(4), 389-401, https://doi.org/10.1111/
ijcs.12432.
Asha, P., Rathiha, R., 2017. Consumer Awareness towards Green Products. Interna- tional Journal of Management (IJM), 8(5), 8-14.
Asif, M. et al., 2018. Determinant factors influencing organic food purchase intention and the moderating role of awareness: A comparative analysis. Food Quality and Preference, 63, 144-150, https://doi.org/10.1016/j.foodqual.2017.08.006.
Baker, E.W., Al-Gahtani, S.S., Hubona, G.S., 2007. The effects of gender and age on new technology implementation in a developing country: Testing the theory of planned behaviour (TPB). Information Technology & People, 20(4), 352-375, https://doi.org/10.1108/09593840710839798.
Bamberg, S., 2003. How does environmental concern influence specific environmen- tally related behaviours? A new answer to an old question. Journal of Environ- mental Psychology, 23(1), 21-32, https://doi.org/10.1016/S0272-4944(02)000 78-6.
Bass, F.M., 1969. A New Product Growth for Model Consumer Durables. Management Science, 15(5), 215-227, https://doi.org/10.1287/mnsc.15.5.215.
Baycan, P., 2017. Y Kuşağının Satın Alma Davranışları Üzerinde Sosyal Medyanın Etkisi (No. 53).
Birgelen, M. van, Semeijn, J., Keicher, M., 2009. Packaging and Proenvironmental Con- sumption Behaviour: Investigating Purchase and Disposal Decisions for Bev- arages. Environment and Behaviour, 41(1), 125-146, https://doi.org/10.1177/
0013916507311140.
Bogner, F.X., 1998. The Influence of Short-Term Outdoor Ecology Education on Long- Term Variables of Environmental Perspective. The Journal of Environmental Education, 29(4), 17-29, https://doi.org/10.1080/00958969809599124.
Bonne, K. et al., 2007. Determinants of halal meat consumption in France. British Food Journal, 109(5), 367-386, https://doi.org/10.1108/0070700710746786.
Bradley, J.C., Waliczek, T.M., Zajicek, J.M., 1999. Relationship Between Environmental Knowledge and Environmental Attitude of High School Students. The Journal of Environmental Education, 30(3), 17-21, https://doi.org/10.1080/00958969909 601873.
Bryła, P., 2016. Organic food consumption in Poland: Motives and barriers. Appetite, 105, 737-746, https://doi.org/10.1016/j.appet.2016.07.012.
Butler, S.M., Francis, S., 1997. The Effects of Environmental Attitudes on Apparel Pur- chasing Behaviour. Clothing and Textiles Research Journal, 15(2), 76-85, https://
doi.org/10.1177/0887302X9701500202.
Chaudhuri, D., 2014. Analysis of the Awareness of Green Products in the City of Kolk- ata. Journal of Global Marketing, 27(4), 207-212, https://doi.org/10.1080/0891 1762.2014.880769.
Chen, M.-F., Tung, P.-J., 2014. Developing an extended Theory of Planned Behaviour model to predict consumers’ intention to visit green hotels. International Journal of Hospitality Management, 36, 221-230, https://doi.org/10.1016/j.ijhm.2013.