DETERMINATION OF THE MOST SUITABLE SITES
FOR SHOPPING CENTERS IN GEOGRAPHICAL
REGIONS WITH GIS
Ceren Erdin Gundogdu*
* Department of Business Administration, Yildiz Technical University, Istanbul, 34349, Turkey, E-Mail: ceren_erdin@yahoo.com
Abstract Being a part of social life, Shopping Centers become more popular and they represent the
environments where consumption comes into prominence. However, in the recent years, Shopping Centers are seen as places combining consumption activities and time killing activities. Since number of Shopping Centers is at peak in big cities, attempts are made to open Shopping Centers in places other than big cities in accordance with population density, economic and social data. However, it is observed that geographical location and neighborhood relations are not taken into consideration in location surveys in cities other than major cities. Yet, such variables have major role at decision making stage. In this study a model based on geographical information system (GIS) was created and decision making process was analysed with the purpose of location survey of Shopping Centers to be opened across the geographical regions by taking population density, economic and social data, quality of life, geographical and spatial data. In analysis, ESRI software, ArcGIS software pack, ArcCatalog, ArcMap, ArcToolbox tool boxes and software required for topology development, data conversion and geographical (spatial) analysis.
Paper type: Research paper Published online: 30 April 2013
Vol. 3, No. 2, pp. 109-122 ISSN 2083-4942 (Print) ISSN 2083-4950 (Online)
© 2013 Poznan University of Technology. All rights reserved.
1. INTRODUCTION
Evaluations planned for shopping malls across the country by considering the location selection data and parameters can also be executed by considering all of the settlement areas, in other words, geographical regions of the country. However, interaction of settlement areas with others in their own geographical regions can be stronger than that of the interaction across the country. Under the light of this assumption, it has been planned to make an evaluation on geographical region basis. The data collected in our research titled "GIS BASED SITE SELECTION FOR SHOPPING CENTERS IN TURKEY" were also used in this study and the same method was implemented for evaluation of the data. Initially, settlement areas (cities) in 7 different geographical regions of the country gathered together and evaluation charts were created. The approaches and the modeling formula implemented for site selection across the country were used in the same manner and the cities were evaluated on regional basis.
2. RESULTS
2.1. Evaluation and Presentation of Results
Evaluation of the data indicated to be used at the country level shall increase chance of the rational decision makings of decision makers on geographical region basis. For this reason, considering the total number of shopping centers in a region, their distribution by the cities in the region and other parameters on regional basis, it was evaluated separately for 7 different geographical regions of the country. Furthermore, the areal size, total population, population density, economic development, contribution to national income, population growth rate and similar data were taken into consideration.
Presentation of the evaluation results is in below order:
a. Geographical (spatial) and socio economic (semantic) data used in evaluation b. The location of the geographical region in Turkey and graphic (two dimensional) presentation of site selection results for the region
c. Graphic presentation (two dimensional) of site selection results of the geo-graphical region.
2.2. Marmara Region
Covers 8.5% of the country with an area of 67.308 km². Population is about 20 million and population density is 320 people/km2. Economy of the region is
a developed economy and 20% of the country national income is provided from this region. 79% of the populations live in cities. Population growth rate is 0.27%.
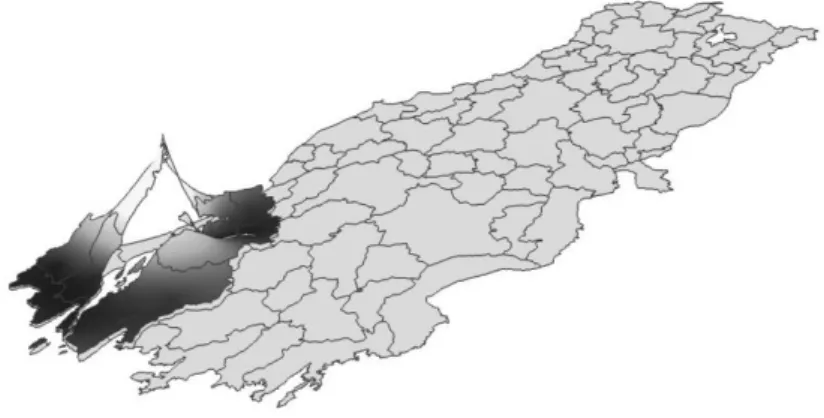
Marmara Region is the most developed region of the country on socio economic terms; there are 11 cities in the region and 124 shopping centers, in different numbers in every city, apart from one of them. Istanbul is the leading city in the region, in which the highest number of shopping centers of the region and Turkey are located. The cities with proper sites for shopping centers in the region with an area of 73.100 km² where about 22 million people (1/4 of Turkey population) live are respectively Istanbul, Bursa, Kocaeli, Balıkesir and Sakarya (Table 1,Figure1-2).
Table 1 Geographical (spatial) and socio economic (semantic) data of Marmara Region
Pl a ka ko d u Ad A la n (km ²) İl n ü fu su (ki şi ) N ü fu s yo ğ u n lu ğ u (/ km ²) M e r ke z n ü fu su (ki şi ) E n Ya kı n İ l KM Z e n g in li k(m e vd u a t/ ki şi ) A V M S a yı sı K ir a . A .m ² E ko n o m i E ğ iti m S a ğ lı k G ü ve n li k K e n t H a ya tı K ü ltü r -S a n a t Ya şa m K a lti te si M e r ke z n ü fu s % x y Yü zd e D e ğ e r le r 10 Balıkesir 14442 1152323 81 215436 Manisa 137 4841 4 40 87 85 75 31 78 48 68 18,70 27,88 39,65 3,61 11 Bilecik 4181 225381 52 34105 Eskişehir 80 2380 0 0 76 79 26 43 79 57 49 15,13 29,98 40,14 0,68 16 Bursa 11087 2605495 250 2287981 Bilecik 95 5325 10 200 74 55 70 36 63 92 60 87,81 29,07 40,18 20,56 17 Çanakkale 10201 508769 54 110000 Tekirdağ 188 3987 2 20 89 95 68 25 93 54 80 21,62 26,42 40,15 1,74 22 Edirne 6241 390428 64 119298 Kırklareli 62 5174 2 20 77 92 89 30 65 50 88 30,56 26,55 41,68 1,61 34 İstanbul 5170 13255685 2551 11008790 Tekirdağ 132 19252 97 2910 98 80 50 85 98 95 94 83,05 28,99 41,04 100,00 39 Kırklareli 6056 332791 53 53221 Edirne 62 5342 0 0 81 75 56 90 74 81 79 15,99 27,23 41,73 1,05 41 Kocaeli 3635 1560138 432 294875 Sakarya 37 5238 8 80 97 65 60 40 71 82 77 18,90 29,90 40,76 4,87 54 Sakarya 4895 872872 180 283752 Kocaeli 37 2441 5 50 47 43 36 81 75 90 51 32,51 30,40 40,77 3,55 59 Tekirdağ 6345 798109 126 107191 Kırklareli 121 4459 5 50 86 49 22 68 43 41 42 13,43 27,51 40,98 2,22 77 Yalova 847 203741 241 70118 Kozaeli 65 4494 2 20 80 91 30 34 96 91 62 34,42 29,24 40,65 0,92 Toplam 73100 21905732
Fig. 1 The location of the Marmara Region in Turkey (above) and graphic representation
Fig. 2 Marmara Region graphical representation (three-dimensional)
2.3. Aegean Region
Covers 10.1% of the country with an area of 93.139 km². It is the 5th largest region. Population is about 10 million and population density is 105 people/km2. It is in the 2nd place in industry after Marmara Region. 61% of the populations live in cities. Population growth rate is 0.16%.
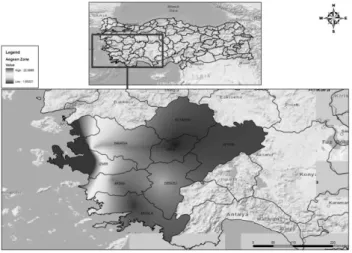
Aegean Region is one of the developed regions of the country on socio economic terms. There are 8 cities in the region with different sizes and a total of 35 shopping centers in different numbers in every city (at least one). The area of the region by geographical borders is 89.110 km² and total population is about 10 million. There are 14 shopping centers in the largest city of the region, Izmir. The cities which are the most proper sites for shopping center are respectively Izmir, Denizli, Manisa and Aydın (Table 2, Figure 3-4).
Table 2 Geographical (spatial) and socio economic (semantic) data of Aegean Region
P la ka ko d u Ad A la n (km ² ) İl n ü fu su (ki şi ) N ü fu s yo ğ u n lu ğ u (/ km ² ) M e r ke z n ü fu su (ki şi ) E n Y a kı n İ l KM Z e n g in li k(m e vd u a t/ ki şi ) A V M S a yı sı K ir a . A .m ² E ko n o m i E ğ iti m S a ğ lı k G ü ve n li k K e n t H a ya tı K ü ltü r -S a n a t Y a şa m K a lti te si M e r ke z n ü fu s % x y Y ü zd e D e ğ e r le r 3 Afyonkarahisar 14532 697559 49 128516 Kütahya 100 2713 12 120 52 52 66 41 77 53 53 18,42 30,55 38,76 2,18 9 Aydın 7922 989862 126 192267 Muğla 99 4957 6 60 59 77 77 23 88 59 64 19,42 27,84 37,84 3,16 20 Denizli 11716 931823 80 350000 Aydın 126 5480 4 80 69 73 81 26 82 88 71 37,56 29,09 37,78 4,17 35 İzmir 11811 3948848 329 2232265 Manisa 36 8387 14 480 96 86 92 27 70 69 92 56,53 27,17 38,45 22,57 43 Kütahya 12119 590496 49 166665 Eskişehir 78 2203 1 10 78 61 67 69 94 46 74 28,22 30,00 39,42 2,25 45 Manisa 13120 1379484 105 214345 İzmir 36 2960 8 80 62 45 74 38 84 47 55 15,54 27,39 38,61 3,97 48 Muğla 12716 817503 64 43845 Aydın 99 7897 6 60 93 94 52 33 97 49 84 5,36 28,37 37,18 1,89 64 Uşak 5174 338019 63 137001 Afyon 117 5758 2 20 85 69 55 63 83 89 73 40,53 29,41 38,67 1,65 Toplam 89110 9693594
Fig. 3 The location of the Aegean Region in Turkey (above) and graphic representation of
the area (two-dimensional) (bottom)
Fig. 4 Aegean Region graphical representation (three-dimensional)
2.4. Black Sea Region
Covers 18% of the country with an area of 143.537 km² and it is the 3rd largest geographical region of the country. Population is about 8.4 million and population density is 59 people/km2. (Turkey average is 83 people/km2). It is the second region with the lowest population density. Population growth rate is 0.4% (Turkey population growth is 0.1834%). 51% of the population lives in the rural area (Turkey average is 35%).
There are no shopping centers in 10 cities in the region and 13 shopping centers in the other 5 cities.
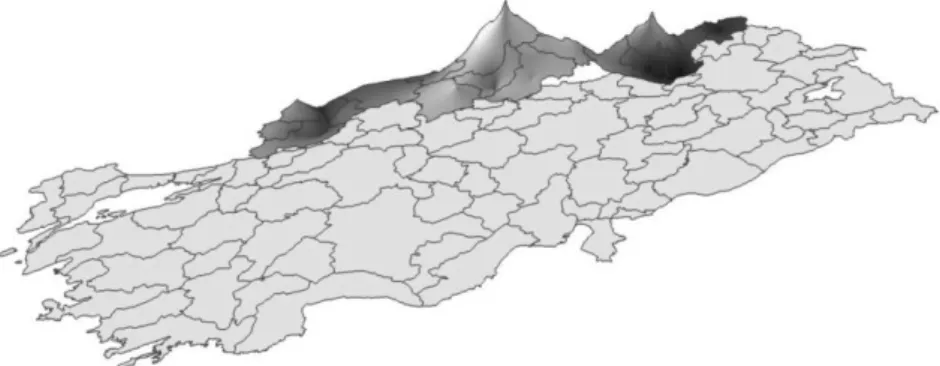
The priority order of the cities in the region according to the site selection results for new shopping centers in the region is Samsun, Trabzon, Ordu and Çorum (Table 3, Figure 5-6).
Table 3 Geographical (spatial) and socio economic (semantic) data of Black Sea Region Pl a ka ko d u Ad A la n (km ²) İl n ü fu su (ki şi ) N ü fu s yo ğ u n lu ğ u (/ km ²) M e r ke z n ü fu su (ki şi ) E n Ya kı n İ l KM Z e n g in li k(m e vd u a t/ ki şi ) A V M S a yı sı K ir a . A .m ² E ko n o m i E ğ iti m S a ğ lı k G ü ve n li k K e n t H a ya tı K ü ltü r -S a n a t Ya şa m K a lti te si M e r ke z n ü fu s % x y Yü zd e D e ğ e r le r 5 Amasya 5731 334786 59 74393 Çorum 92 2578 0 0 71 70 41 39 64 43 48 22,22 35,85 40,67 1,16 8 Artvin 7493 164759 22 23157 Rize 159 3130 1 10 95 82 63 91 89 86 91 14,06 41,82 41,19 0,52 14 Bolu 10716 271208 33 84565 Düzce 45 3337 1 10 57 90 96 49 86 94 93 31,18 31,60 40,74 1,14 19 Çorum 12833 535405 42 161321 Amasya 92 2775 1 10 88 48 61 99 58 77 89 30,13 34,93 40,55 2,13 28 Giresun 7151 419256 61 83636 Ordu 44 3357 2 20 92 64 76 42 60 67 72 19,95 38,41 40,91 1,38 29 Gümüşhane 6125 129618 20 30270 Bayburt 78 1832 0 0 49 83 80 59 55 44 61 23,35 39,48 40,46 0,48 37 Kastamonu 13473 361222 27 64606 Karabük 122 2893 2 20 84 57 62 37 95 74 67 17,89 33,78 41,39 1,15 52 Ordu 5894 719183 121 141000 Giresun 44 2109 1 10 60 41 64 46 51 64 46 19,61 37,89 40,98 2,28 53 Rize 3792 319637 81 78144 Trabzon 74 2773 0 0 75 71 78 92 67 73 85 24,45 40,51 41,03 1,16 55 Samsun 9474 1252693 138 363180 Amasya 131 3262 3 30 64 60 86 57 62 83 83 28,99 36,34 41,31 4,78 57 Sinop 5858 202740 35 30502 Samsun 165 3523 0 0 73 76 69 83 90 98 90 15,04 35,14 42,03 0,64 60 Tokat 9912 617802 62 113100 Sivas 108 1733 1 10 55 56 57 54 61 45 50 18,31 36,56 40,33 1,91 61 Trabzon 4495 763714 164 214949 Rize 75 4049 3 30 79 84 94 96 68 87 96 28,15 39,74 41,00 2,90 67 Zonguldak 3470 619703 188 104276 Bartın 89 6068 2 20 82 59 87 51 81 72 87 16,83 31,79 41,45 1,92 69 Bayburt 4043 74412 20 32285 Gümüşhane 78 2124 0 0 65 74 51 89 53 61 63 43,39 40,22 40,26 0,40 74 Bartın 1960 187758 90 35992 Karabük 88 4608 0 0 53 58 49 24 80 71 47 19,17 32,33 41,63 0,66 78 Karabük 2420 227610 55 100749 Bartın 88 3444 2 20 68 87 71 44 92 58 69 44,26 32,63 41,20 1,16 81 Düzce 3641 338188 132 129118 Bolu 45 2257 1 10 45 66 79 28 57 39 44 38,18 31,16 40,84 1,53 Toplam 118481 7539694
Fig. 5 The location of the Black Sea Region in Turkey (above) and graphic representation
Fig. 6 Black Sea Region graphical representation (three-dimensional)
2.5. Central Anatolia Region
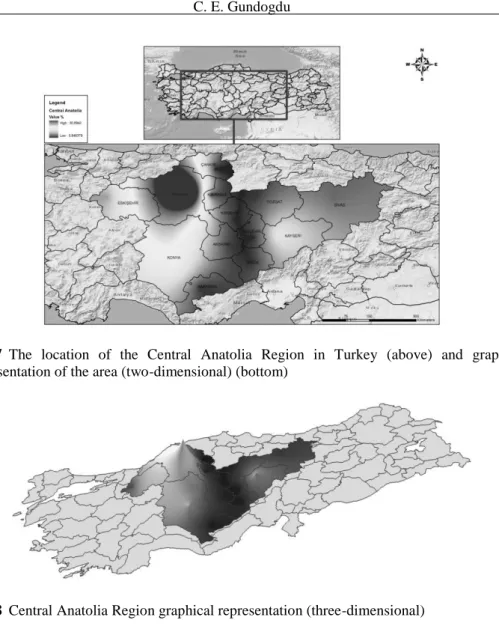
Central Anatolia Region is a geographical region with a population of about 12 million covering 13 cities. The area of the region is 163.057 km². There are no shopping centers in 4 of 13 cities in the region. There are 40 shopping centers in total in other 9 cities. Considering the distribution of shopping centers by cities, Ankara (capital city) ranks first in the region, which is the second in country listing with 25 shopping malls.
The priority order of the cities in the region according to the site selection results for shopping centers in the region is Ankara, Konya, Kayseri, Eskişehir and Sivas (Table 4, Figure 7-8).
Table 4 Geographical (spatial) and socio economic (semantic) data of Central Anatolia
Region Pl a ka ko d u Ad A la n (km ²) İl n ü fu su (ki şi ) N ü fu s yo ğ u n lu ğ u (/ km ²) M e r ke z n ü fu su (ki şi ) E n Ya kı n İ l KM Z e n g in li k(m e vd u a t/ ki şi ) A V M S a yı sı K ir a . A .m ² E ko n o m i E ğ iti m S a ğ lı k G ü ve n li k K e n t H a ya tı K ü ltü r -S a n a t Ya şa m K a lti te si M e r ke z n ü fu s % x y Yü zd e D e ğ e r le r 6 Ankara 25615 4771716 195 3203362 Çankırı 131 20334 31 930 99 99 98 65 39 96 99 67,13 32,85 39,92 30,99 18 Çankırı 8411 179067 24 62508 Kırıkkale 105 2305 2 20 58 78 54 48 72 56 56 34,91 33,62 40,59 0,80 26 Eskişehir 13904 764584 55 482793 Kütahya 78 6382 5 100 90 96 91 72 69 99 97 63,14 30,52 39,79 4,83 38 Kayseri 17116 1234651 72 1064164 Nevşehir 81 4352 5 50 67 68 85 84 37 63 78 86,19 35,46 38,72 9,66 40 Kırşehir 6434 221876 35 88105 Nevşehir 91 4085 1 10 56 88 44 56 48 62 52 39,71 34,16 39,15 1,08 42 Konya 40824 2013845 52 1112768 Karaman 119 2944 6 60 66 47 83 79 38 80 70 55,26 32,50 37,87 11,37 50 Nevşehir 5438 282337 52 67864 Aksaray 75 4162 1 10 70 72 35 82 56 97 65 24,04 34,72 38,63 1,05 51 Niğde 7318 337931 46 78088 Nevşehir 82 2223 1 10 43 63 45 75 44 51 43 23,11 34,68 37,97 1,18 58 Sivas 28129 642224 22 251776 Tokat 108 2965 1 10 41 53 93 29 28 68 58 39,20 37,03 39,74 2,97 66 Yozgat 14083 476096 34 73930 Kırşehir 112 2233 1 10 35 39 38 86 47 55 41 15,53 34,83 39,83 1,41 68 Aksaray 8051 377505 50 129949 Nevşehir 75 3491 1 10 50 40 39 21 23 60 31 34,42 34,01 38,37 1,64 70 Karaman 8816 232633 26 105384 Konya 119 3340 1 10 83 54 65 95 87 42 82 45,30 33,20 37,18 1,21 71 Kırıkkale 4589 276647 61 205078 Ankara 77 2087 1 10 63 67 95 32 45 79 86 74,13 33,50 39,84 1,95 Toplam 188728 11811112
Fig. 7 The location of the Central Anatolia Region in Turkey (above) and graphic
representation of the area (two-dimensional) (bottom)
Fig. 8 Central Anatolia Region graphical representation (three-dimensional)
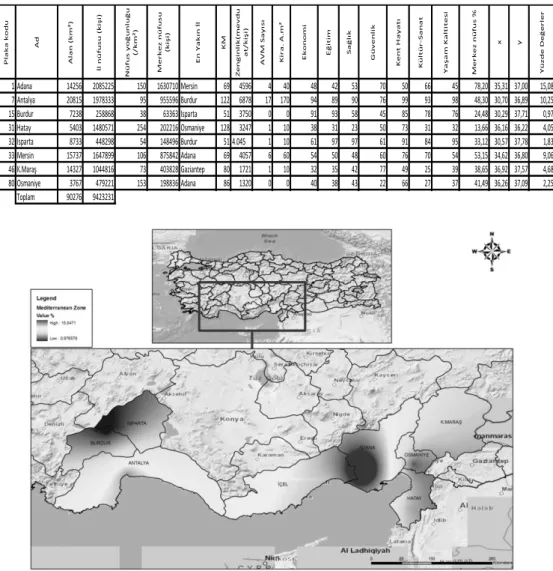
2.6. Mediterranean Region
Covers 15% of the country with an area of 122.927 km². Ranks 4 by size. Population is about 9 million and population density is 71 people/km2. 60% of populations live in cities. Population growth rate is 0.22%.
There are 8 cities in the region and a total of 25 shopping centers apart from two cities. Antalya ranks first with 13 shopping centers. As a result of the research and evaluation, the most suitable cities for shopping centers are respectively Adana, Antalya, Mersin and Kahramanmaraş (Table 5, Figure 9-10).
Table 5 Geographical (spatial) and socio economic (semantic) data of Mediterranean Region P la ka ko d u Ad A la n (km ² ) İl n ü fu su (ki şi ) N ü fu s yo ğ u n lu ğ u (/ km ² ) M e r ke z n ü fu su (ki şi ) E n Y a kı n İ l KM Z e n g in li k(m e vd u a t/ ki şi ) A V M S a yı sı K ir a . A .m ² E ko n o m i E ğ iti m S a ğ lı k G ü ve n li k K e n t H a ya tı K ü ltü r -S a n a t Y a şa m K a lti te si M e r ke z n ü fu s % x y Y ü zd e D e ğ e r le r 1 Adana 14256 2085225 150 1630710 Mersin 69 4596 4 40 48 42 53 70 50 66 45 78,20 35,31 37,00 15,08 7 Antalya 20815 1978333 95 955596 Burdur 122 6878 17 170 94 89 90 76 99 93 98 48,30 30,70 36,89 10,25 15 Burdur 7238 258868 38 63363 Isparta 51 3750 0 0 91 93 58 45 85 78 76 24,48 30,29 37,71 0,97 31 Hatay 5403 1480571 254 202216 Osmaniye 128 3247 1 10 38 31 23 50 73 31 32 13,66 36,16 36,22 4,05 32 Isparta 8733 448298 54 148496 Burdur 51 4.045 1 10 61 97 97 61 91 84 95 33,12 30,57 37,78 1,83 33 Mersin 15737 1647899 106 875842 Adana 69 4057 6 60 54 50 48 60 76 70 54 53,15 34,62 36,80 9,06 46 K.Maraş 14327 1044816 73 403828 Gaziantep 80 1721 1 10 32 35 42 77 49 25 39 38,65 36,92 37,57 4,68 80 Osmaniye 3767 479221 153 198836 Adana 86 1320 0 0 40 38 43 22 66 27 37 41,49 36,26 37,09 2,25 Toplam 90276 9423231
Fig. 9 The location of the Mediterranean Region in Turkey (above) and graphic
Fig. 10 Mediterranean Region graphical representation (three-dimensional)
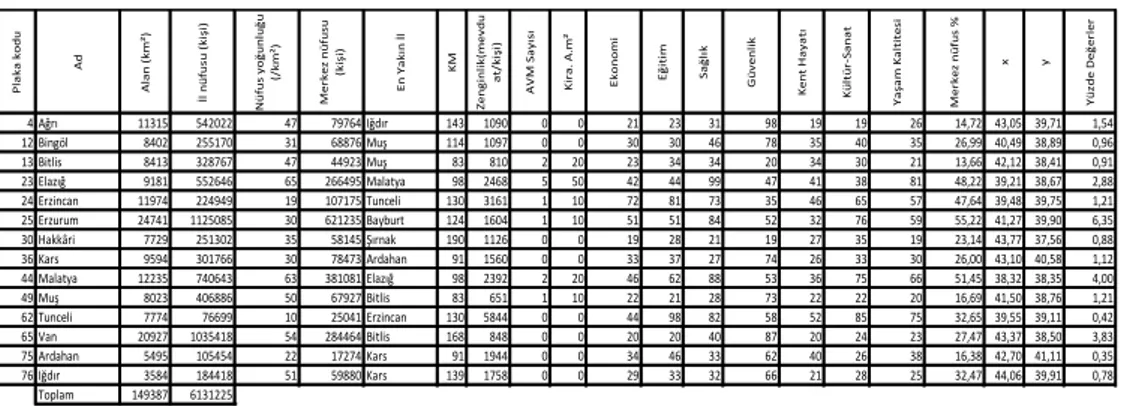
2.7. Eastern Anatolia Region
Covers 21% of the country with an area of 165.436 km² and it is the largest geographical region covering 21% of the country. Population is over 6 million and population density is 38 people/km2. It is the region with the lowest population density. 48% of the populations live in rural areas. It is the geographical region with the lowest population growth rate of 0.14% after Black Sea Region.
There are 14 cities in the region, no shopping centers in 9 cities and a total of 6 shopping centers in other 5. Distribution of the shopping centers by cities is one shopping center, apart from only one city. According to the research and evaluation results, the most suitable cities for shopping centers are respectively Erzurum, Malatya, Van and Elazığ. (Table 6, Figure 11-12).
Table 6 Geographical (spatial) and socio economic (semantic) data of Eastern Anatolia
Region Pl a ka ko d u Ad A la n (km ²) İl n ü fu su (ki şi ) N ü fu s yo ğ u n lu ğ u (/ km ²) M e rke z n ü fu su (ki şi ) E n Ya kı n İ l KM Z e n g in li k(m e vd u a t/ ki şi ) A V M S a yı sı K ir a . A .m ² E ko n o m i E ğ iti m S a ğ lı k G ü ve n li k K e n t H a ya tı K ü ltü r-S a n a t Ya şa m K a lti te si M e rke z n ü fu s % x y Yü zd e D e ğ e rl e r 4 Ağrı 11315 542022 47 79764 Iğdır 143 1090 0 0 21 23 31 98 19 19 26 14,72 43,05 39,71 1,54 12 Bingöl 8402 255170 31 68876 Muş 114 1097 0 0 30 30 46 78 35 40 35 26,99 40,49 38,89 0,96 13 Bitlis 8413 328767 47 44923 Muş 83 810 2 20 23 34 34 20 34 30 21 13,66 42,12 38,41 0,91 23 Elazığ 9181 552646 65 266495 Malatya 98 2468 5 50 42 44 99 47 41 38 81 48,22 39,21 38,67 2,88 24 Erzincan 11974 224949 19 107175 Tunceli 130 3161 1 10 72 81 73 35 46 65 57 47,64 39,48 39,75 1,21 25 Erzurum 24741 1125085 30 621235 Bayburt 124 1604 1 10 51 51 84 52 32 76 59 55,22 41,27 39,90 6,35 30 Hakkâri 7729 251302 35 58145 Şırnak 190 1126 0 0 19 28 21 19 27 35 19 23,14 43,77 37,56 0,88 36 Kars 9594 301766 30 78473 Ardahan 91 1560 0 0 33 37 27 74 26 33 30 26,00 43,10 40,58 1,12 44 Malatya 12235 740643 63 381081 Elazığ 98 2392 2 20 46 62 88 53 36 75 66 51,45 38,32 38,35 4,00 49 Muş 8023 406886 50 67927 Bitlis 83 651 1 10 22 21 28 73 22 22 20 16,69 41,50 38,76 1,21 62 Tunceli 7774 76699 10 25041 Erzincan 130 5844 0 0 44 98 82 58 52 85 75 32,65 39,55 39,11 0,42 65 Van 20927 1035418 54 284464 Bitlis 168 848 0 0 20 20 40 87 20 24 23 27,47 43,37 38,50 3,83 75 Ardahan 5495 105454 22 17274 Kars 91 1944 0 0 34 46 33 62 40 26 38 16,38 42,70 41,11 0,35 76 Iğdır 3584 184418 51 59880 Kars 139 1758 0 0 29 33 32 66 21 28 25 32,47 44,06 39,91 0,78 Toplam 149387 6131225
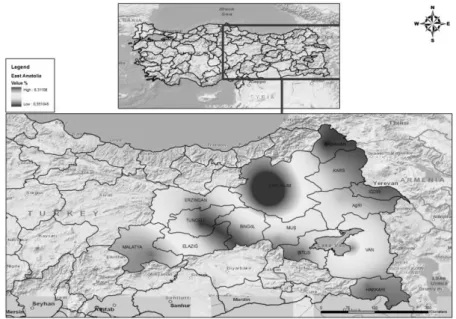
Fig. 11 The location of the Eastern Anatolia Region in Turkey (above) and graphic representation of the area (two-dimensional) (bottom)
Fig. 12 Eastern Anatolia Region graphical representation (three-dimensional)
2.8. Southeastern Anatolia Region
It is the smallest geographical region of the country with an area of 59.176 km2 and the population density is 113 people/km2. Population growth rate is 0.25%.
62% of the populations live in cities. 1/7 of the country petroleum is collected from this region.
There are 8 cities in the region. There no shopping centers in 5 of the cities. There are 8 shopping centers in total in other 3 cities. The city with this highest number of shopping centers is Gaziantep with 5 shopping centers. According to the research and evaluation results, the most suitable cities for shopping centers are respectively Gaziantep, Diyarbakır, Şanlıurfa, Batman and Adıyaman. (Table 7, Figure 13-14).
Table 7 Geographical (spatial) and socio economic (semantic) data of Southeastern
Anatolia Region P la ka ko d u Ad A la n (km ² ) İl n ü fu su (ki şi ) N ü fu s yo ğ u n lu ğ u (/ km ² ) M e r ke z n ü fu su (ki şi ) E n Y a kı n İ l KM Z e n g in li k(m e vd u a t/ ki şi ) A V M S a yı sı K ir a . A .m ² E ko n o m i E ğ iti m S a ğ lı k G ü ve n li k K e n t H a ya tı K ü ltü r -S a n a t Y a şa m K a lti te si M e r ke z n ü fu s % x y Y ü zd e D e ğ e r le r 2 Adıyaman 7572 590935 84 178538 K.Maraş 164 1143 0 0 39 32 29 67 42 34 33 30,21 38,28 37,76 2,30 21 Diyarbakır 15162 1528958 102 545983 Mardin 95 1266 5 50 27 25 72 71 30 32 34 35,71 40,21 37,93 6,51 27 Gaziantep 7194 1700763 249 1253513 K.Maraş 80 2314 12 240 36 29 59 64 54 37 40 73,70 37,35 37,09 11,73 47 Mardin 9097 744606 85 65072 Diyarbakır 95 903 0 0 28 24 19 97 24 29 27 8,74 40,74 37,32 1,78 56 Siirt 5465 300695 55 98281 Batman 87 845 0 0 25 26 37 88 33 36 29 32,68 41,94 37,93 1,23 63 Şanlıurfa 19091 1663371 89 385588 Adıyaman 109 759 2 20 26 19 24 93 29 20 22 23,18 38,79 37,17 5,62 72 Batman 4671 510200 110 246678 Siirt 87 999 1 10 31 27 47 55 25 52 28 48,35 41,13 37,90 2,63 73 Şırnak 7296 430109 60 52743 Siirt 97 810 0 0 24 22 20 94 31 23 24 12,26 42,45 37,53 1,14 Toplam 75548 7469637
Fig. 13 The location of the Southeastern Anatolia Region in Turkey (above) and graphic representation of the area (two-dimensional) (bottom)
Fig. 14 Southeastern Anatolia Region graphical representation (three-dimensional)
3. CONCLUSION
In this study carried out with the purpose of selecting optimal shopping center locations on regional basis, an analysis was performed in GIS environment upon loading semantic data on geographical (spatial) data. Analysis results indicated the potential areas of shopping centers in an easily understandable format by every decision maker. When results are reviewed numerically or graphically, it is observed that potential areas of shopping centers coincide with life quality in general, however the results are negative and contrary to what is expected in some cities. It is observed that parameters such as urban life, culture-art as well as economic data play an important role in selection of optimal shopping center locations. It is observed that there is a high potential for shopping center sector on regional basis. In conclusion, it is a fundamental condition for decision makers to evaluate geographical (spatial) and semantic data together with reasonable care for rational investments.
REFERENCES
Akad, Ö., Taşkın, Ç., Özdemir, A., (2006), Buying Behaviour of International Shopping Center Consumers- An Application in Bursa, [in: Turkish] Anadolu University
Journal of Social Sciences, Vol: 6 (2), 13-30.
AVMYOD, (2009), Development of shopping centers in Turkey, [in:Turkish] (http://www.ayd.org.tr./TR/Databank), (04.04.2010).
Baudrillard, J., (2010), Consumer Society, [in: Turkish], İstanbul: Ayrıntı Press.
Bayar, R.. (2005), Location Choice for Shopping Mall Centers Using GIS: Case Study Ankara. Journal of Geographical Sciences, Vol: 3 (2), 19–38.
Church, R.L., Murray, A.T. (2009), Business Site Selection, Location Analysis and GIS. Hoboken, New Jersey: John Wiley&Sons Inc.
Erdin Gündoğdu C. (2011), “Suitable Location Selection Optimization for Shopping Centres and Geographical Information System GIS”, China-USA Business Review, ISSN 1537-1514, Vol. 10, No. 8, pp. 711-718.
Erdin Gündoğdu C. (2012), “GIS Based Sıte Selectıon For Shoppıng Centers In Turkey”, (to be published).
ESRI. (1999), ARCGIS, Arc Catalog, Arc Map, Arc Toolbox Users Manual. Environmental Systems Research Institute Inc., Redlands, A.B.D.
Eva Gayrimenkul-Akademetre. (2011), Eva Real Estate Appraisement and Consultancy- Akametre Research and Strategic Planning of July-August, [in: Turkish].
ICSC-AMPD. (2006), ICSC Shopping Center Standards, [in: Turkish] .Arasta avm, Vol: 49, 48-51.
Longley, P.A., Batty, M.. (1996), Spatial Analysis: Modelling in a GIS Environment. New York: John Wiley&Sons Inc.
Malczewski, J. (1999), GIS and Multicriteria Decision Analysis. New York: John Wiley & Sons, Inc.
Mavi, B. (2011), 81 Cities Life Quality Research 2011, [in: Turkish] Published in CNBC-e BUSINESS September 2011.
Özaydın, G., Özgür, E.F. (2009), A Revaluation on Shopping Malls as Grand Scale Urban Projects in Case of İstanbul, [in: Turkish] Journal of Architecture, ISSN 1300-4212,Vol:347, 55-69.
SONAR. (2009), Shopping Centers Preference Survey Report, [in:Turkish],
(http://www.ampd.org/members), (16.03.2010).
Terzi F., Mutlu, H. and Dokmeci, V. (2006), Retail Potential of Districts of Istanbul, Journal of Retail and Leisure Property, 5 (4), 314–325.
TÜİK (2010), “2006–2007–2008 Consumption Expenditure Statistics”. Prime Ministry Republic of Turkey Turkish Statistical Institute Vol:26.
Yırtıcı, H.. (2005), The Spatial Organization of Contemporary Capitalism, [in: Turkish], Istanbul: Bilgi University Press.
BIOGRAPHICAL NOTES
Ceren Erdin Gundogdu was born in Istanbul-Turkey in 1973. In 1997 she was
graduated form Marmara University (Turkey) Faculty of Economic and Administrative Sciences and in 2001 she completed here master thesis about Economic Policy at Istanbul University (Turkey). She wrote her doctoral thesis about “Fuzzy Goal Programming” and gained a Ph.D. degree in 2007 from Istanbul University. Since 2002 she is an academic staff of Department of Business Administration of Yildiz Technical University (Turkey). She has a lot of articles and presentations both in Turkish and in English. She is also reviewer and editor of some international journals. Her academic fields are especially “decision making”, “fuzzy goal programming”, “geographical information systems (GIS)” and “simulation”.