T
rends
in
The
prevalence
of
psychoacTive
substance
use
among
I
ława
’
s
junIor
hIgh
school
sTudenTs
in
2001–2014
on
The
background
of
oTher
surveys
resulTs
t
rendy
w
rozpowszechnIanIu
używanIa
substancjI
psychoaktywnych
wśród
IławskIch
gImnazjalIstów
w
latach
2001–2014
na
tle
wynIków
Innych
badań
Krzysztof Bobrowski
Institute of Psychiatry and Neurology, Department of Public Health, Youth Prevention Unit ̔Pro-M’, Warsaw, Poland
Instytut Psychiatrii i Neurologii, Zakład Zdrowia Publicznego, Pracownia Profilaktyki Młodzieżowej „Pro-M”, Warszawa, Polska Alcohol Drug Addict 2017; 30 (4): 223-248 DOI: https://doi.org/10.5114/ain.2017.73875
Correspondence to/Adres do korespondencji: Krzysztof Bobrowski, Instytut Psychiatrii i Neurologii, Zakład Zdrowia Publicznego,
Pracownia Profilaktyki Młodzieżowej „Pro-M”, ul. Sobieskiego 9, 02-957 Warszawa, phone: +48 22 4582 216, e-mail: kbob@ipin.edu.pl Authors’ contribution/Wkład pracy autorów: No ghostwriting declared./Nie występuje zjawisko ghostwriting.
Submitted/Otrzymano: 02.11.2017 • Accepted/Przyjęto do druku: 15.01.2018
Abstract
Introduction: The main aim of this paper is to present trends in the prevalence of psychoactive substance use among students from Iława, in com-parison with trends observed in the ESPAD and the Warsaw/Mokotów studies.
Material and methods: The Iława study has been conducted since December 2001, repeated in years 2005, 2010, 2012 and 2014, in the whole local popu-lation of 15-year old students (300 to 500 participants in each edition) applying always the same procedure. Trends in the prevalence of smoking, drinking alcohol and other psychoactive substance use were analysed. Results: The last edition of the Iława study from 2014 revealed declines in the majority of sub-stance use prevalence indicators over the last
Streszczenie
Wprowadzenie: Głównym celem pracy była pre-zentacja trendów w rozpowszechnieniu używa-nia substancji psychoaktywnych wśród gimna-zjalistów iławskich, na tle trendów w badaniach ESPAD oraz mokotowskich.
Materiał i metody: Badania iławskie prowadzo-no w 2001 r. i były powtarzane w 2005, 2010, 2012 i 2014 r., w całej lokalnej populacji 15-letnich uczniów (około 300 do 500 osób w każdej edycji ba-dań), zawsze według tej samej procedury. Analizo-wano trendy w rozpowszechnieniu palenia papiero-sów, picia alkoholu oraz używania innych substancji psychoaktywnych.
Wyniki: Ostatnia edycja badań iławskich z 2014 r. przyniosła wyniki pokazujące spadki w okresie dwóch lat większości wskaźników używania
substan-two years. In the same period, the consumption of designer drugs increased slightly (from 2.4 to 5.2%) and the drug use rate remaining quite high (21%).
Discussion: Long-term trends in the prevalence of cigarette, alcohol and drug use (including al-cohol abstinence rates) in Iława study are clear-ly reflected the trends identified in nationwide survey ESPAD. Compared to the general popu-lation, prevalence of frequent drinking (the last 30 days) and binge drinking was lower among Iława’s students and long-term trends were closer to the trends of the Warsaw students’ subpopula-tion (Mokotów district).
Conclusions: The rather high percentage of drugs consumers suggests the need for greater control of supply on the illegal market. It is advisable to include universal prevention programmes among young people and prepare educators to conduct an intervention. These analyses have highlighted the need for more frequent monitoring of the ep-idemiological situation and the need for the de-velopment of binge drinking measurement stan-dards.
Keywords: Alcohol, Binge drinking, Illegal and designer drugs, Epidemiology, Adolescents
cji psychoaktywnych. W tym samym okresie wzro-sła nieznacznie konsumpcja dopalaczy (z 2,4% do 5,2%), a wskaźnik używania narkotyków, po dużym wzroście w 2010 r., pozostał na dość wysokim pozio-mie, około 21%.
Omówienie: Długoterminowe trendy w zakresie rozpowszechnienia palenia papierosów, picia alko-holu (odsetek abstynentów) oraz używania innych substancji psychoaktywnych w badaniach iławskich stanowią dość wierne odzwierciedlenie trendów identyfikowanych w badaniach ogólnopolskich ESPAD. W porównaniu z populacją ogólną roz-powszechnienie częstego picia alkoholu (ostatnie 30 dni) i upijania się (binge drinking) w populacji młodzieży iławskiej było mniejsze, a długotermi-nowe trendy bliższe były trendom w mokotowskiej subpopulacji młodzieży warszawskiej.
Wnioski: Dość duże odsetki konsumentów narko-tyków sugerują konieczność większej kontroli ich podaży na nielegalnym rynku. Wskazane jest obję-cie młodzieży programami profilaktyki uniwersalnej oraz przygotowanie wychowawców do podejmowa-nia działań interwencyjnych. Przeprowadzone anali-zy uwidoczniły potrzebę częstszego monitorowania sytuacji epidemiologicznej oraz wypracowania wła-ściwych standardów pomiaru upijania się.
Słowa kluczowe: alkohol, upijanie się, narkotyki, dopalacze, epidemiologia, młodzież
■ w
prowadzenIePrezentując badania iławskie, kilka słów trzeba poświęcić charakterystyce samego miasta. Iława ma ponad 700-letnią historię. Założona zosta-ła jako miasto krzyżackie, następnie przez kilka wieków była w granicach Prus, potem Niemiec i dopiero w 1945 r. stała się miastem polskim. Jest malowniczo położona nad najdłuższym jeziorem w Polsce – Jeziorakiem, które wraz z kanałem el-bląskim tworzy szlak wodny prowadzący aż do Bałtyku. Otoczona licznymi rezerwatami przyro-dy, posiada duże walory rekreacyjne i turystyczne. W ostatnim 25-leciu cechował miasto dynamiczny rozwój inwestycyjny oraz bardzo niski w skali wo-jewództwa warmińsko-mazurskiego poziom bez-robocia (około 6%).
Iława jest miastem powiatowym, liczącym oko-ło 33 tys. mieszkańców. Miasta tej wielkości (do
■ i
nTroducTionIn presenting the Iława study, we ought to devote a few words to the characteristics of the town itself. Iława’s history stretches back over 700 years to when it was founded by the Order of Teutonic Knights. Afterwards it became part of Prussia for a number of centuries, then Germany, before becoming a Pol-ish town in 1945. Its picturesque location on Jezior-ak, the longest lake in Poland, together with the El-bląg canal, forms a watercourse leading all the way to the Baltic. Surrounded by numerous nature re-serves, it boasts many recreational and touristic at-tractions. The last 25 years have been characterised by dynamic investment-led development and a very low level of unemployment (around 6%) considered in terms of the Warmia and Mazury region.
Iława is a district administrative centre with around 33,000 residents. Cities of this size (up
to 50,000 residents) are characterised by a high-er-than-national-average prevalence of alco-hol problems (especially among males) and on the other hand a lower prevalence of drug-use re-lated problems. Residents of small towns enjoy rel-atively good mental health as demonstrated by at least the rather low suicide rate compared to larger urban centres [1].
The recreational nature of the surroundings may have significance for young persons’ life-style and favour tendencies to drink alcohol and the use of other psychoactive substances. On the other hand, the large number of local sport clubs with considerable achievements and a de-veloped cultural scene in the city may favour the development of young people’s interests and passions protecting them from involvement in problem behaviour.
The results of the Iława studies have for many years formed the important empirical base for the local prevention programme construction [2]. Successive study reports and results, articles are published and presented to representatives of the most important local institutions [3]. In-formation on the studies also reaches a significant part of Iława’s residents [4].
Various types of preventative activity has been developed based on the conclusions drawn from studies including the systematic realisation of ev-idence-based universal prevention programmes on a wider scale addressed to 10-to-13-year-old school students.
This work presents the long-term trends in the prevalence of psychoactive substance use among 13-to-15-year-old school students in Iława observed between 2001 and 2014 [5-8]. We have compared these with trends identi-fied in Polish nationwide studies carried out within the European School Survey Project on Alcohol and Drugs (ESPAD) [9-11] as well as studies conducted over 30 years in the Warsaw district of Mokotów by the Institute of Psy-chiatry and Neurology Youth Prevention Unit ‘Pro-M’ [12-16].
One can mention a number of advantages of relating the results of local population studies to that of other studies. Generally, this greatly broad-ens the possibility of assessing the results of local studies. Comparison of long-term trends allows us to conclude whether the course of change in the prevalence of alcohol or drugs use is similar
50 tys. mieszkańców) charakteryzują się wyższym od przeciętnego w Polsce rozpowszechnieniem proble-mów alkoholowych (szczególnie wśród mężczyzn), a z drugiej strony – niższym rozpowszechnieniem problemów związanych z używaniem narkotyków. Mieszkańcy niewielkich miast cieszą się względnie dobrą kondycją psychiczną, o czym świadczy cho-ciażby dość niski wskaźnik samobójstw w porów-naniu z większymi miejscowościami [1].
Rekreacyjny charakter otoczenia może mieć znaczenie dla stylu życia młodzieży i sprzyjać tendencjom do picia alkoholu i używania innych substancji psychoaktywnych. Z drugiej strony, mnogość iławskich klubów sportowych o znaczą-cych osiągnięciach i rozwinięta działalność kultu-ralna na terenie miasta mogą sprzyjać rozwojowi zainteresowań i życiowych pasji młodzieży, a tym samym chronić ją przed angażowaniem się w za-chowania problemowe.
Wyniki badań iławskich od wielu lat stanowią ważną, merytoryczną podstawę konstrukcji miej-skiego programu profilaktyki [2]. Publikowane ko-lejne raporty i wyniki badań oraz artykuły prezento-wane są przedstawicielom najważniejszych instytucji lokalnych [3]. Informacja o badaniach dociera także do znacznej części mieszkańców Iławy [4].
W związku z wnioskami płynącymi z badań rozwijano różnego typu działania profilaktyczne, m.in. na szerszą skalę zaczęto systematycznie re-alizować sprawdzone, skuteczne programy profi-laktyki uniwersalnej adresowane do uczniów klas IV–VI szkół podstawowych.
W pracy prezentowane są długoterminowe trendy w rozpowszechnieniu używania substancji psychoaktywnych wśród gimnazjalistów w Iła-wie, obserwowane w latach 2001–2014 [5–8]. Porównujemy je z trendami wynikającymi z ba-dań ogólnopolskich, prowadzonych w ramach Europejskiego Programu Badań Ankietowych ESPAD (European School Survey Project on Alco-hol and Drugs) [9–11] oraz z badań realizowanych od ponad 30 lat na warszawskim Mokotowie przez Pracownię Profilaktyki Młodzieżowej „Pro-M” In-stytutu Psychiatrii i Neurologii [12–16].
Można wymienić kilka korzyści, jakie daje odnie-sienie wyników lokalnych badań populacyjnych do wyników innych badań. Mówiąc ogólnie, poszerza to znacznie możliwości oceny wyników lokalnych badań. Porównanie długoterminowych trendów pozwala stwierdzić, czy przebieg zmian w rozpo-wszechnieniu używania alkoholu czy narkotyków
for local and national studies or different. It is therefore possible to assess whether and in what period of time the observed changes are in accor-dance with national (or Warsaw) trends and are likely to be derivative of general trends or whether they reflect local specifics. And finally, data from other studies may provide a point of reference for the assessment of the current scale of the prev-alence of psychoactive substance use in a given population.
Both the Iława study and the two remain-ing research projects were conducted among 15-year-old school students, which gives us the basis for comparison of results. However the studies differ in terms of the times of their realisation. In the case of the Mokotów study, we have a two years difference in relation to the Iła-wa study edition in 2014. The Iłathe Iła-wa study and ESPAD were last conducted in the same school year, though with a half-year time difference. The above circumstances show that the ESPAD study results are a more current point of refer-ence for the assessment of the epidemiological situation in the population of Iława students than the Mokotów study.
In attempting to compare the results of various population studies, we encounter further prob-lems and limitations. Above all, there are differ-ent scopes of study so we only have the possibility of comparison in a narrow range of variables. Fur-thermore, in relation to the same analysed vari-ables, different indicators were applied in different studies. And even if they are analogical, they are often measured on the basis of respondents’ an-swers to survey questions formulated in a different way [17].
The above problems do not concern compar-isons of the Iława and Mokotów studies because the range of survey questions in both studies is nearly identical. And even if sometimes dif-ferent indicators or a difdif-ferent method of their calculation were applied, access to databases gave the opportunity to standardise and con-vert the results. Many more problems appear in the comparison of Iława or Mokotów studies with ESPAD due to differences in survey ques-tions. There is however a number of analogical indicators that create the possibility of compar-ing the study results.
It is also worth mentioning the important events on the national drugs scene in 2007–2016,
jest podobny w badaniach lokalnych i ogólnopol-skich, czy też różny. Można zatem próbować ocenić, czy i w jakim okresie obserwowane zmiany są zgod-ne z trendami ogólnopolskimi (lub warszawskimi) i prawdopodobnie stanowią pochodną ogólnych trendów czy też odzwierciedlają, być może, lokalną specyfikę. I w końcu, dane z innych badań mogą sta-nowić punkt odniesienia dla oceny aktualnej skali rozpowszechnienia używania substancji psychoak-tywnych w określonej populacji.
Zarówno badania iławskie, jak i dwa pozostałe projekty badawcze są prowadzone wśród uczniów klas III gimnazjum, co daje podstawę do porów-nania wyników. Badania różnią się natomiast ter-minami, w których je realizowano. W przypadku badań mokotowskich mamy dwuletnie przesunię-cie w czasie pomiaru w stosunku do edycji badań iławskich z 2014 r. Badania iławskie i ESPAD pro-wadzono ostatnio w tym samym roku szkolnym, ale z półrocznym przesunięciem terminów. Powyższe okoliczności pokazują, że wyniki badania ESPAD są bardziej aktualnym punktem odniesienia dla oceny sytuacji epidemiologicznej w populacji iławskich gimnazjalistów niż badań mokotowskich.
Podejmując próbę porównywania wyników różnych badań populacyjnych, napotykamy jesz-cze inne problemy i ogranijesz-czenia. Przede wszyst-kim bywają różne zakresy badań, mamy zatem możliwość dokonywania porównań tylko w obrę-bie wąskiej puli zmiennych. Z kolei w odniesieniu do tych samych analizowanych zmiennych, w róż-nych badaniach bywają stosowane inne wskaźniki. A jeśli nawet są one analogiczne, to często obli-czane na podstawie odpowiedzi respondentów na różnie formułowane pytania ankietowe [17].
Powyższe problemy nie dotyczą porównywa-nych tu wyników badań iławskich i mokotowskich, ponieważ w obu badaniach pula pytań ankieto-wych jest niemal identyczna. I nawet jeśli stosowa-ne były czasem instosowa-ne wskaźniki czy inny sposób ich obliczania, dostęp do baz danych dawał możliwość ujednolicenia i przeliczenia wyników. Dużo więcej problemów pojawia się przy porównaniach badań iławskich czy mokotowskich z ESPAD ze względu na różnice w pytaniach ankietowych. Jest jednak kilka analogicznych wskaźników, które dają moż-liwość porównania wyników badań.
Warto jeszcze wspomnieć o istotnych wydarze-niach w latach 2007–2016 na krajowej scenie nar-kotykowej, które mogły mieć znaczenie dla obser-wowanych trendów lokalnych czy ogólnopolskich.
which could have had a bearing on the observed local or national trends. In this time we noted great changes in the supply and availability of so called new psychoactive substances, known pop-ularly as designer drugs or legal highs. The Polish specialists in this area, P. Jabłoński and A. Mal-czewski [18: 3], defined them as ‘different kinds of substances and products revealing supposed or actual psychoactive effects. These substances could be of natural or synthetic origin and their defining feature is the fact they are not on any list of controlled substances under international or national law’.
According to the Supreme Audit Office there were around 50 outlets with designer drugs func-tioning in the whole country in 2007, and then in 2008–2010, their number drastically increased to nearly 1400 [19]. In October 2010, the Chief Sanitary Inspectorate, due to the increasing num-ber of cases of severe designer drug poisonings, took the decision to close all of this kind of shops. The distribution of designer drugs was drasti-cally limited. From 2011, this started to gradu-ally re-establish itself though on a more limited scale via the internet and the reopening of points of sale in cities, which in 2014 and 2015 amount-ed to over 200, and then halvamount-ed in number in 2016 [18, 20].
The basic aims of the presented work were as follows:
1. Assessment of the current prevalence of psy-choactive substances use in the population of 15 year-old students in Iława, mainly in relation to the data from the national ESPAD survey.
2. Analysis of long-term trends in the prevalence of alcohol drinking and use of other psychoac-tive substances by Iława school students against the background of trends observed in the na-tional ESPAD studies and Mokotów study real-ised in Warsaw.
3. Analysis of changes in the availability of new psychoactive substances and an attempt to answer whether these were reflected in the re-sults of population studies and observed trends.
W tym okresie mieliśmy do czynienia z gwał-townymi zmianami w podaży i dostępności tzw. nowych substancji psychoaktywnych, zwanych potocznie „dopalaczami”. Polscy specjaliści w tej dziedzinie, P. Jabłoński i A. Malczewski [18: 3], określają je jako: „różnego rodzaju substancje i produkty wykazujące rzekome lub faktyczne działanie psychoaktywne. Substancje te mogą być pochodzenia naturalnego lub syntetycznego, a ich cechą wyróżniającą jest fakt, że nie znajdują się w wykazach substancji kontrolowanych prawem międzynarodowym czy krajowym”.
Według ustaleń Najwyższej Izby Kontroli, w 2007 r. na terenie całego kraju funkcjonowało około 50 sklepów z dopalaczami, a następnie w la-tach 2008–2010 ich liczba drastycznie wzrosła do blisko 1400 [19]. W październiku 2010 r. Główny Inspektorat Sanitarny (GIS), w związku z narasta-niem liczby ciężkich zatruć dopalaczami, podjął decyzję o zamknięciu wszystkich tego typu skle-pów. Dystrybucja dopalaczy została raptownie ograniczona. Od 2011 r. zaczęła się stopniowo od-radzać, choć w ograniczonej skali, przez internet oraz ponownie uruchamiane w miastach punkty sprzedaży, których liczba w latach 2014 i 2015 przekroczyła 200, a następnie spadła o połowę w 2016 r. [18, 20].
Zasadnicze cele prezentowanej pracy były na-stępujące:
1. Ocena aktualnego rozpowszechnienia substancji psychoaktywnych w populacji klas III iławskich gimnazjalistów, w odniesieniu głównie do danych z ogólnopolskich badań ESPAD.
2. Analiza długoterminowych trendów w rozpo-wszechnieniu picia alkoholu i używania innych substancji psychoaktywnych przez iławskich gimnazjalistów na tle trendów obserwowanych w ogólnopolskich badaniach ESPAD oraz w ba-daniach mokotowskich, realizowanych w War-szawie.
3. Analiza zmian w dostępności nowych sub-stancji psychoaktywnych i próba odpowiedzi na pytanie, czy znalazły one odzwierciedlenie w wynikach badań populacyjnych i obserwo-wanych trendach.
■ M
aTerial and MeThodsResearch procedure
The Iława survey study is realised according to the same procedure since 2001. These are carried out with the auditorium survey method during one 45-minute lesson, in a manner assuring the main-tenance of individual students’ class and school anonymity. The students are informed of the ano-nymity and of the voluntary basis of participation in the study. Written information is prepared spe-cially for parents together with a request to report to the school any problems or questions relevant to the matter. Depending on the decision of the school director, information is sent to all parents or they may read it at the school, where it is also possible to see the content of the survey questionnaire.
The school study is organised by the Mayor of Iława’s representative for family, prevention and addiction problems as well as the Centre for Psy-choeducation, Addiction Prevention and Family Assistance. The surveyors are persons from out-side the school system, university students – vol-unteers cooperating with the Centre or its young employees. The surveyors are trained and receive written instructions according to which they in-form the respondents about the studies and meth-od of answering the survey questions.
The Mokotów studies and ESPAD, which pres-ent a reference point to the Iława research, are realised according to very similar standard pro-cedures [11, 16]. There were certain differences concerning organisation. In the ESPAD studies, contacts with the schools are part of the surveyors and local research coordinators scope of duties. In the Mokotów studies, the study team is responsi-ble for organisation and coordination, and they employ the surveyors, who are usually university students. It has occurred that, due the lack of fi-nancial resources of study, research workers have done the surveying work.
Research of groups
The Iława studies were carried out between 2001 and 2014 in five editions. According to initial assumptions, they were supposed to be repeated systematically every four years. There were, how-ever, exceptions. The period between two editions (2005–2010) was extended to 5 years at the main or-ganising Representative’s request. The time of study result announcement coincided awkwardly with
■ m
aterIał I metodyProcedura badań
Iławskie badania ankietowe realizowane są we-dług tej samej procedury od 2001 r. Prowadzone są metodą audytoryjną w czasie jednej 45-minutowej lekcji, w sposób zapewniający zachowanie anonimo-wości poszczególnym uczniom, klasom i szkołom. Uczniów informuje się o anonimowości oraz o zasa-dzie dobrowolności udziału w badaniach. Specjalnie dla rodziców przygotowana jest pisemna informacja o badaniach, wraz z prośbą o zgłaszanie do szko-ły wszelkich problemów lub pytań związanych z tą sprawą. W zależności od decyzji dyrekcji, powieloną informację wysyła się wszystkim rodzicom lub mogą oni przeczytać ją w szkole, gdzie jest również możli-wość zapoznania się z treścią ankiety.
Organizacją badań w szkołach zajmuje się Peł-nomocnik Burmistrza Iławy ds. Rodziny, Profilak-tyki i Rozwiązywania Problemów Uzależnień oraz Ośrodek Psychoedukacji, Profilaktyki Uzależnień i Pomocy Rodzinie. Funkcję ankieterów pełnią osoby spoza systemu oświaty, studenci – wolonta-riusze współpracujący z Ośrodkiem lub jego mło-dzi pracownicy. Ankieterzy są szkoleni i otrzymu-ją pisemną instrukcję, według której informui otrzymu-ją uczniów o badaniach i sposobie odpowiadania na pytania ankietowe.
Badania mokotowskie i ESPAD, stanowiące odniesienie dla badań iławskich, realizowane są według bardzo podobnych standardowych pro-cedur [11, 16]. Pewne różnice dotyczą ich organi-zacji. W badaniach ESPAD kontakty ze szkołami należą do zadań ankieterów i lokalnych koordy-natorów badań. W badaniach mokotowskich or-ganizacją i koordynacją badań zajmuje się zespół badawczy, który zatrudnia ankieterów, najczęściej studentów. Zdarzało się, że z powodu niedostatku środków finansowych na naukę w rolę ankieterów wcielali się pracownicy naukowi.
Badane grupy
Badania iławskie prowadzone były w latach 2001–2014 w pięciu edycjach. Według wstępnych założeń miały być powtarzane systematycznie co cztery lata. Były jednak wyjątki. Okres między kolejnymi edycjami badań (2005–2010) wydłu-żono do 5 lat na prośbę Pełnomocnika, główne-go organizatora badań. Czas ogłaszania wyników badań zbiegał się bowiem niefortunnie z okresem kampanii przed wyborami samorządowymi.
Po-local government election campaigning. Further-more, in the face of the great dynamic of indicator change and the increase of the prevalence of sub-stance use between 2005 and 2010, additional stud-ies were carried out (2012) in order to more precise-ly monitor the epidemiological situation [8].
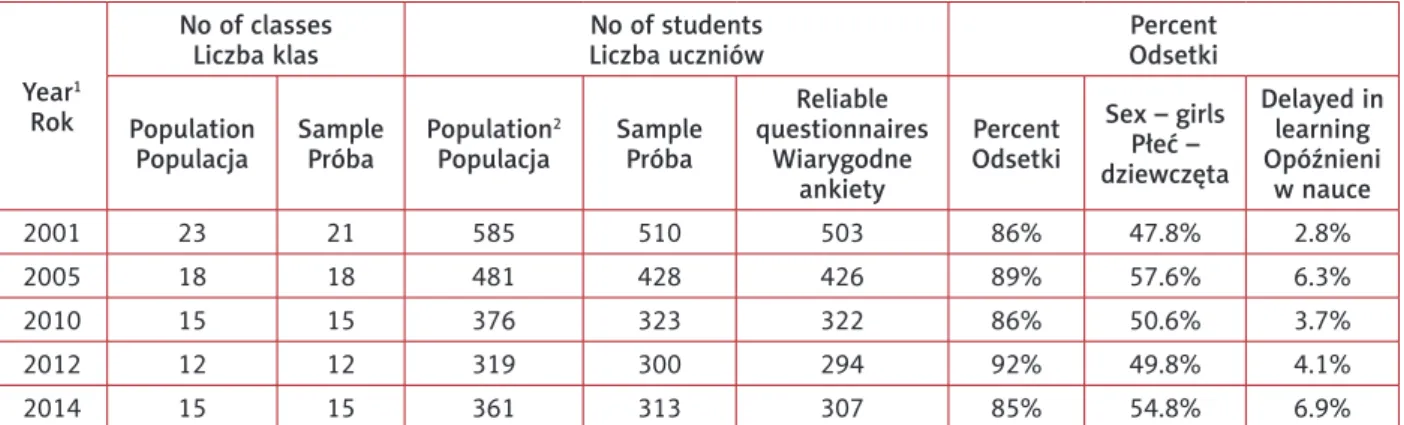
Due to the small size of the Iława population, no sample was taken and the study covered the en-tire population of 15 year-old school students. As table I shows, the size of the study group ranged from around 500 students in 2001 to around 300 in the last editions in 2012 and 2014. Depending on the edition, 85% to 92% of 15 year-old students in the Iława schools returned their surveys cor-rectly filled in.
The proportion of girls in the studied groups varied in each edition between 47.8% and 54.8% and the older students repeating the year ranged from 2.8% to 6.9%.
In the compared trends, we took into ac-count five of the last Mokotów studies from 2000 to 2016 and ESPAD from 1999 to 2015. In the Mokotów studies, we usually selected at least a half of 15-year-old classes at random in the area of three Warsaw districts – Mokotów, Ursynów and Wilanów, and the samples numbered usually a thousand or more students (760 in the last edi-tion). In the national ESPAD study, the random selection was two-stage. First the schools were drawn, followed by a selection of one class from each school. The samples in these studies includ-ed over 2200 15-year-old students (older students involved in the ESPAD studies were not taken into account in our research).
nadto, wobec dużej dynamiki zmian wskaźników i wzrostu rozpowszechnienia używania substancji między 2005 i 2010 r., w 2012 r. przeprowadzono dodatkowe badania w celu bardziej dokładnego monitorowania sytuacji epidemiologicznej [8].
Ze względu na niewielką liczebność iławskiej populacji nie dobierano próby, a badania obejmo-wały całą populację uczniów z klas III miejskich gimnazjów. Jak pokazano w tabeli I, wielkość badanej grupy wahała się od około 500 uczniów w 2001 r. do około 300 w ostatnich edycjach w la-tach 2012 i 2014. W zależności od edycji, 85% do 92% uczniów klas III iławskich gimnazjów odda-wało poprawnie wypełnione ankiety.
W kolejnych edycjach odsetek dziewcząt w ba-danych grupach był zmienny i wynosił od 47,8% do 54,8%, a odsetek uczniów starszych rocznikiem, prawdopodobnie „drugorocznych”, wahał się od 2,8% do 6,9%.
W porównaniach trendów uwzględniono pięć ostatnich edycji badań mokotowskich z lat 2000– 2016 oraz ESPAD z okresu 1999–2015. W bada-niach mokotowskich zwykle dobierano losowo co najmniej połowę wszystkich klas III z terytorium obejmującego trzy dzielnice Warszawy: Moko-tów, Ursynów i Wilanów, a próby liczyły zwykle tysiąc i więcej uczniów (w ostatniej edycji – 760). W ogólnopolskich badaniach ESPAD dobór loso-wy był dwustopnioloso-wy. Najpierw losowano szko-ły, a następnie jedną klasę z każdej szkoły. Próby w tych badaniach liczą ponad 2200 gimnazjalistów z III klas (pominięto tutaj uczniów II klas szkół ponadgimnazjalnych także badanych w ESPAD). Table I. Characteristic of the sample and its size in subsequent studies
Tabela I. Charakterystyka próby oraz jej liczebność w kolejnych edycjach badań
Year1
Rok
No of classes
Liczba klas No of studentsLiczba uczniów OdsetkiPercent Population
Populacja SamplePróba Population
2
Populacja SamplePróba
Reliable questionnaires Wiarygodne ankiety Percent Odsetki Sex – girls Płeć – dziewczęta Delayed in learning Opóźnieni w nauce 2001 23 21 585 510 503 86% 47.8% 2.8% 2005 18 18 481 428 426 89% 57.6% 6.3% 2010 15 15 376 323 322 86% 50.6% 3.7% 2012 12 12 319 300 294 92% 49.8% 4.1% 2014 15 15 361 313 307 85% 54.8% 6.9%
1 Also studied were 13 year-old school students as were 17 year-olds in 2001, though this data was not included in the study./Badano
jeszcze uczniów klas I gimnazum, a w 2001 r. także uczniów klas II szkół ponadgimnazjalnych starego typu; dane na ten temat pominięto.
Tools and indicators
As has already been mentioned, the majority of questions applied in the Iława studies, concerned drinking alcohol and the use of other psychoac-tive substances were sourced from the Mokotów studies [21]. As a result, the variable indicators for both studies were identical. In order to make long-term trend comparisons of the prevalence of psychoactive substance use, a number of indica-tors were selected that were most similar to those applied in ESPAD studies.
Cigarette smoking
In the Iława and Mokotów studies, students’ answers to the question ‘Do you smoke ciga-rettes?’ were the basis for the creation of two in-dicators. The first defined the percentage of ac-tual cigarette smokers and the second described the percentage of daily smokers. In the ESPAD study, current smoking was measured (from 2003) on the basis of the question ‘How often have you smoked cigarettes in the last 30 days?’ One of the answer categories described the dai-ly cigarette smoking. On the basis of data from 2003 to 2015 revealed in the ESPAD research report [11], it was possible to calculate the val-ues of similar indicators as in the Iława and Mokotów studies.
Drug use
There are no questions on the frequency of marijuana or other drug use in the Iława and Mokotów studies, only general question. Stu-dents were asked whether they had used any il-licit drugs (including inhalants) in the last year, with the choice of any five answer categories: no, it has not happened, yes, one or two times, yes, a several times, yes, a dozen and so times or yes more than a dozen and so times. The main indica-tor was the percentage of young people who de-clared they had used any illicit drugs at least once in the last year.
In the ESPAD reports there is only data on the frequency of the use of particular psychoactive substances. In these circumstances, we attempt-ed to estimate the indicator of any illicit drug use (including inhalants) on the basis of information available from ESPAD on the use of marijuana (or hashish) in the last 12 months.
Narzędzia i wskaźniki
Jak już wspomniano, większość pytań ankie- towych stosowanych w badaniach iławskich, do-tyczących picia alkoholu i używania innych substan-cji psychoaktywnych, zaczerpnięto z kwestionariu-sza używanego w badaniach mokotowskich [21]. W konsekwencji także wskaźniki zmiennych były w obu badaniach identyczne. Do porównań długo-terminowych trendów w rozpowszechnieniu uży-wania substancji psychoaktywnych wybrano kilka wskaźników, najbardziej podobnych do tych stoso-wanych w badaniach ESPAD.
Palenie papierosów
W badaniach iławskich i mokotowskich od-powiedzi uczniów na pytanie: „Czy palisz papie-rosy?”, były podstawą do skonstruowania dwóch wskaźników. Pierwszy określał odsetek aktualnych palaczy papierosów, a drugi opisywał odsetek pa-lących papierosy codziennie. W badaniach ESPAD bieżące palenie mierzone było (od 2003 r.) na pod-stawie pytania: „Jak często paliłeś papierosy w cią-gu ostatnich 30 dni?”. Wśród kategorii odpowiedzi wyróżniano także codzienne palenie papierosów. Na podstawie danych z lat 2003–2015, przytacza-nych w raporcie z badań ESPAD [11], możliwe było obliczenie wartości podobnych wskaźników, jak w badaniach iławskich i mokotowskich.
Używanie narkotyków
W badaniach iławskich i mokotowskich nie ma pytań o częstość używania marihuany czy innych narkotyków, lecz jest pytanie ogólne. Uczniowie byli pytani o używanie w ostatnim roku „środków narkotyzujących”, z wyborem jednej z pięciu kate-gorii odpowiedzi: nie zdarzyło się, tak – jeden lub dwa razy, tak – kilka razy, tak – kilkanaście razy oraz tak – więcej niż kilkanaście razy. Głównym wskaźnikiem był odsetek młodzieży deklarującej używanie jakichkolwiek „środków narkotyzują-cych” przynajmniej raz w ciągu ostatniego roku.
W raportach ESPAD publikowane są tylko dane dotyczące częstości używania poszczególnych sub-stancji psychoaktywnych. Wobec takich okolicz-ności, na użytek niniejszej pracy podjęto próbę oszacowania wskaźnika używania jakichkolwiek „środków narkotyzujących” na podstawie dostęp-nych informacji z ESPAD o używaniu w ostatnich 12 miesiącach marihuany (lub haszyszu).
In annual reports from youth population sur-veys in the US Monitoring the Future (MTF) [22], the percentages of class 10 students who had used any illicit drugs (including inhalants) in the last year was published, together with the percent-ages using marijuana or hashish. On the basis of data from the last 20 years, it was calculated that the proportion between the abovementioned two indicators was on average 1.17. The estimated indicators for further ESPAD studies were calcu-lated by multiplying by that figure (1.17) the per-centage of students using marijuana at least once in the last year. It ought to be explained that American studies were used here due to the lack of Polish research that would allow the estima-tion of the proporestima-tion between the two indicators discussed here.
Designer drugs use
The inspiration to develop diagnostic ques-tions on the prevalence of designer drugs was the Public Opinion Research Centre (CBOS) study on young people [18, 23, 24]. The surveys, both in for the Iława and ESPAD studies, design-er drugs wdesign-ere defined in a vdesign-ery similar manndesign-er as ‘substances acting on the psyche and sold in spe-cialist shops or on the internet’. The use of design-er drugs in the last 12 months was the only in-dicator applied for comparison of results of both studies. In the Iława study, students were asked ‘Did you use designer drugs…’ and in the ESPAD study ‘How many times have you used designer drugs…?’ The answer categories were analog-ical from 0/not once, 1-2 times to 10-19 times. In the Iława study, the last category was 20 times or more and in ESPAD there was an additional seventh category 40 times or more.
In the Mokotów studies, unlike the other re-search, students were not asked specifically about designer drugs, and no definition was provided ei-ther. There were however questions on the types of psychoactive substances used and respondents could select designer drugs from a list of different substances. Due to such a great difference in the con-tent of questions, it was decided that in the scope of designer drug use it was possible to compare only the results of the Iława and ESPAD studies.
Drinking alcohol
In the Mokotów, like in Iława studies, respon-dents were asked about the last case of drinking
W raporcie z badań populacyjnych młodzie-ży w USA Monitoring the Future (MTF) [22], re-alizowanych corocznie, prezentowane są odsetki uczniów z klas 10, którzy w ostatnim roku uży-wali jakichkolwiek nielegalnych substancji, w tym środków wziewnych, a także odsetki używających marihuany lub haszyszu. Na podstawie danych z ostatnich 20 lat obliczono, że proporcja między powyższymi dwoma wskaźnikami wynosiła śred-nio 1,17. Estymowane wskaźniki dla kolejnych edycji badań ESPAD obliczono, mnożąc przez tę liczbę odsetki uczniów używających marihuany przynajmniej raz w ostatnim roku. Należy wyja-śnić, że posłużono się amerykańskimi badaniami ze względu na brak polskich badań, które umożli-wiałyby oszacowanie proporcji między omawiany-mi tu wskaźnikaomawiany-mi.
Używanie dopalaczy
Inspirację do opracowania pytań diagnozują-cych rozpowszechnienie dopalaczy stanowiły ba-dania młodzieży CBOS [18, 23, 24]. W ankietach, zarówno badań iławskich, jak i ESPAD, dopalacze definiowano w bardzo podobny sposób: „«Dopa-lacze» lub «smarty» to substancje działające na psychikę, sprzedawane w specjalnych sklepach lub przez internet”. Do porównań wyników obu ba-dań wykorzystano tylko jeden wskaźnik – używa-nie dopalaczy przynajmużywa-niej raz w ciągu ostatnich 12 miesięcy. W badaniach iławskich pytano uczniów: „Czy używałeś «dopalaczy»…?”, a w ESPAD: „Ile razy używałeś «dopalaczy»…?”. Kategorie odpowiedzi były analogiczne: od 0/ani razu, 1–2 razy do 10–19 razy. W badaniach iław-skich ostatnia kategoria to 20 lub więcej razy, a w ESPAD była dodatkowa, siódma: 40 lub więcej razy.
W badaniach mokotowskich, w odróżnieniu od pozostałych badań, nie zadawano uczniom osob-nego pytania o używanie dopalaczy, nie podano również ich definicji. Pytano natomiast o rodzaje używanych substancji psychoaktywnych i w odpo-wiedzi badani mogli zaznaczyć dopalacze na kilku-punktowej liście substancji. W związku z tak duży-mi różnicaduży-mi w treści pytań ankietowych uznano, że w zakresie używania dopalaczy możemy porów-nać tylko wyniki badań iławskich i ESPAD.
Picie alkoholu
W badaniach mokotowskich, i w ślad za nimi w badaniach iławskich, pytano respondentów
specific alcoholic beverages like beer, wine (in-cluding champagne and home-made wine) and vodka (and other strong liquor like whisky, gin or cognac), when this took place and how much they had drunk. Respondents could choose cate-gories like I never drank. Other possible answers to the question ‘when?’ included 8 categories from over a year ago to 1 to 4 days ago. It was on this basis that the indicators analysed in this work were calculated; that is ‘the percentage of alcohol abstainers’ and ‘the percentage of alcohol drinkers in the last 30 days’. The concept of abstinence was defined as, together with other Polish researchers, ‘not drinking any alcoholic beverages in the last 12 months immediately prior to the moment of study’ [25: 7].
In the ESPAD survey, another more general type of question was applied about the frequency of alcohol drinking in the last 12 months and last 30 days ‘How many times (if at all) did you drink some alcohol beverage like beer, wine, vodka or other liquor?’ Despite the differences in the ques-tion formulathe ques-tion, it was possible to count analo-gous indicators of alcohol drinking like in the Iła-wa and Mokotów studies.
Binge drinking
All the three compared studies analysed the indicator concerning binge-drinking ep-isodes. This is the main indicator of alcohol drinking levels recommended for use in popula-tion studies for institupopula-tions significant for federal health policy in the USA like the National Insti-tute on Alcohol Abuse and Alcoholism (NIAAA) and Substance Abuse and Mental Health Services Administration (SAMHSA). This indicator is defined as drinking, on one occasion in the last 30 days (sometimes in the last two weeks) as much alcohol as to deliver a blood alcohol con-centration (BAC) at the level of at least 80 mg/ dl or 0.8‰ [26]. That level of BAC is equivalent to drinking around five ‘standard drinks’ by a sta-tistically typical adult male and around four by female. Standard drinks (containing each around 14 g of ethanol) are defined by amount of liquid of the commonly served portions of various alco-holic beverages.
Respondents from the Iława and Mokotów studies answered the question ‘how much did you drink’ by choosing ‘I never drank’ or one of the six remaining categories. Each of these
de-o ostatni przypadek picia poszczególnych napojów alkoholowych: piwa, wina (w tym m.in. szampana, wina domowego) oraz wódki (i innych mocnych trunków jak whisky, gin czy koniak) – kiedy miał miejsce i ile wtedy wypili. Respondenci mogli wybrać kategorię nigdy nie piłem. Inne możliwe odpowiedzi na pytanie „kiedy?” obejmowały 8 kategorii: od prze-szło rok temu do 1 do 4 dni temu. Na tej podstawie obliczano analizowane w niniejszej pracy wskaźniki, czyli „odsetki alkoholowych abstynentów” oraz „od-setki pijących alkohol w ciągu ostatnich 30 dni”. Po-jęcie abstynencji zdefiniowano, za innymi polskimi badaczami, jako „niepicie żadnego napoju alkoholo-wego w okresie ostatnich 12 miesięcy, bezpośrednio poprzedzających moment badania” [25: 7].
W ankiecie ESPAD zastosowano inny, bardziej powszechny typ pytań o częstość picia alkoholu w okresie ostatnich 12 miesięcy i ostatnich 30 dni: „Ile razy (jeśli w ogóle) zdarzyło Ci się pić jakiś na-pój alkoholowy, tzn. piwo, wino, wódkę lub inny napój spirytusowy?”. Pomimo różnicy w sformu-łowaniu pytań możliwe było obliczenie analogicz-nych wskaźników picia alkoholu, jak w badaniach iławskich i mokotowskich.
Upijanie się (binge drinking)
We wszystkich trzech porównywanych projek-tach badawczych analizowany jest wskaźnik doty-czący epizodów upijania się, nazywany w krajach anglosaskich binge drinking. Jest to główny wskaź-nik intensywności picia alkoholu (drinking levels), polecany do stosowania w badaniach populacyj-nych przez instytucje znaczące dla federalnej poli-tyki zdrowotnej w USA, takie jak National Institu-te on Alcohol Abuse and Alcoholism (NIAAA) oraz Substance Abuse and Mental Health Services Admi-nistration (SAMHSA). Wskaźnik ten jest definio-wany jako wypicie przy jednej okazji, w ostatnich 30 dniach (czasem ostatnich dwóch tygodniach) takiej ilości alkoholu, która daje jego stężenie we krwi (blood alcohol concentration – BAC) na po-ziomie co najmniej 80 mg/dl, czyli 0,8‰ [26]. Taki poziom BAC ma odpowiadać wypiciu przez statystycznego dorosłego mężczyznę około pięciu „standardowych drinków”, a przez kobietę – około czterech. Standardowe drinki (zawierające każdy około 14 g etanolu) określane są przez podane ob-jętości zwykle serwowanych porcji różnych napo-jów alkoholowych.
Respondenci z badań iławskich i mokotowskich w odpowiedzi na pytanie: „Ile wtedy wypiłeś?”,
scribed the drinking of a definite number of mea-sures appropriate to a given type of liquor as are usually served and in the appropriate size stat-ed in millilitres. So in the case of beer, the basic size was a 500 ml bottle, for wine it was a glass of 200 ml and for vodka a large shot of 50 ml. It was on this basis that the Mokotów and Iława studies defined the binge-drinking indicator as the drinking on one occasion of at least three measures of beer, wine or vodka in the period of 30 days prior to the study. Assuming that the average ethanol content of beer at 5%, wine at 10% and vodka at 40%, it may be reckoned that the above-defined three measures are equivalent to the consumption of at least 60 ml of pure ethyl alcohol.
Up to now, students’ gender and body weight were not included in the definition of binge-drink-ing in the Mokotów and Iława studies. The same amount of consumed ethanol, depending on the above factors may give an entirely different lev-el of organism intoxication understood as blood alcohol concentration. In order to verify this, we estimated the BAC level for hypothetical average 15-year-old students using the Widmark formu-la [27-31]:
BAC [‰] = A [g] / (W [kg] * r) – βt [‰] where: A – the amount of consumed ethanol [ml]
multi-plied by its density – 0.789 g/ml W – body weight in kilogrammes
r – reduction coefficient (Widmark factor) taking into account the proportions of water mass in the organism to total body mass and water con-tent in the blood – that is approximately 0.68 for boys and 0.55 for girls
βt – amount of alcohol eliminated from the or-ganism in an hour multiplied by the number of hours since the first drink
In calculating the average student body defined on the basis of Polish centile norms and values for the 50th centile, separately for girls and boys with
an average age of 15.5 years [32]. According to the NIAAA definition, it was found that the time of alcohol consumption was two hours. The co-efficient of alcohol elimination β was estimated at around 0.15 g/l/h [28: 13]. With the above as-sumptions and three measures of consumed alco-hol (60 ml of ethanol) the estimated level of BAC intoxication was 0.83‰ for boys and 1.26‰ for girls. This showed that while the indicator was adequate for boys, it required correction for girls.
wybierali nigdy nie piłem lub jedną z sześciu po-zostałych kategorii. Każda z nich opisywała wypi-cie określonej liczby miar, właściwych dla danego trunku, tak jak zwykle są serwowane oraz w odpo-wiadającej im objętości podanej w mililitrach. I tak w przypadku piwa podstawową miarą była butelka (500 ml), dla wina „lampka” (200 ml) i dla wódki – duży kieliszek (50 ml). Na tej podstawie w bada-niach mokotowskich i iławskich od wielu lat defi-niowano wskaźnik upijania się (binge drinking) jako wypicie w okresie 30 dni poprzedzających badania, przy jednej okazji co najmniej trzech miar – piwa, wina lub wódki. Zakładając przeciętną zawartość etanolu w piwie na 5%, w winie na 10% i w wód-ce na 40%, można obliczyć, że wyżej określone trzy miary odpowiadają konsumpcji co najmniej 60 ml czystego alkoholu etylowego (etanolu).
Do tej pory w badaniach mokotowskich i iław-skich, definiując upijanie się (binge drinking), nie uwzględniano płci i masy ciała uczniów. Ta sama ilość wypitego etanolu, w zależności od powyższych czynników, może dawać zupełnie różne poziomy intoksykacji organizmu, rozumianej jako poziom koncentracji alkoholu we krwi (BAC). Aby to zwe-ryfikować, oszacowano poziom BAC dla hipotetycz-nych, przeciętnych uczniów i uczennic klas III gim-nazjum, wykorzystując wzór E. Widmarka [27–31]: BAC [‰] = A [g] / (W [kg] * r) – βt [‰] gdzie: A – ilość wypitego etanolu [ml] pomnożona przez
jego gęstość (0,789 g/ml) W – masa ciała w kilogramach
r – współczynnik redukcji (Widmark factor) uwzględniający proporcję masy wody w orga-nizmie do całkowitej masy ciała oraz zawartość wody we krwi, który wynosi w przybliżeniu 0,68 dla chłopców i 0,55 dla dziewcząt
βt – ilość alkoholu eliminowana z organizmu w cią-gu godziny pomnożona przez liczbę godzin upływających od momentu rozpoczęcia kon-sumpcji alkoholu
W obliczeniach masę ciała przeciętnego ucznia określono na podstawie polskich norm centylo-wych i wartości dla 50. centyla, osobno dla dziew-cząt i chłopców, przy średniej wieku 15,5 roku [32]. Zgodnie z definicją NIAAA założono, że czas kon-sumpcji alkoholu wynosił dwie godziny. Współ-czynnik eliminacji alkoholu β oszacowano na oko- ło 0,15 g/l/h [28: 13]. Przy powyższych założe-niach i trzech porcjach wypitego alkoholu (60 ml etanolu) oszacowany w obliczeniach poziom in-toksykacji BAC wyniósł: dla chłopców 0,83‰ i dla
It was accepted that for girls the consumption of two alcoholic measures, that is at least 40 ml of ethanol, was appropriate for BAC intoxication at around 0.74‰. Following the coefficient correc-tion, the BAC values for boys and girls are similar and close to the definition of binge drinking val-ue – 0.8‰. This confirms the validity of the cor-rected indicator in the structural aspect. It was also verified if the corrected indicator may be re-garded as valid in the correlational aspect. Taking advantage of data from five Iława study editions, we compared the percentages of drunk students during the last 30 days provided by the corrected binge drinking indicator together with the sub-jective indicator of drunkenness, in other words according to the respondents own assessment. As it turned out, in the four study editions the value of both indicators did not vary significantly with only in the 2005 study the differences being statis-tically significant (McNemar’s chi-square = 7.683; p = 0.006).
The indicator known as binge drinking is also analysed in the ESPAD studies. It was construct-ed on the basis of answers to the survey question ‘Think of the last 30 days. How many times (if at all) have you drunk five or more «drinks» in a row in that time? («drink» here means a glass of wine, a bottle of beer, a small shot of vodka or other liquor or glass of low-percentage cocktail)’. The term ‘low-percentage’ was not defined, nei-ther was the size of the alcoholic beverage por-tions, i.e. the ‘small shot’ of vodka or the ‘glass’ of wine. Apart from that, the indicator was not differentiated as regards gender. One can there-fore expect differences in the indicator levels in our studies and ESPAD caused by differences in the definition of standard portions of alcohol (or rather due to a lack of sufficient precision of defi-nition).
Data analysis
The results of the Mokotów studies are calcu-lated for filtered data without considering older students who had repeated a class. Meanwhile, in the reports of the Iława studies and ESPAD, the re-sults are for the whole studied sample without this kind of exception. Therefore, we calculated the val-ues for the Mokotów study indicators including the older students who had repeated a year.
The percentage indicators were calculated in relation to the number of persons providing
cer-dziewcząt – 1,26‰. Wynika stąd, że wskaźnik jest adekwatny dla chłopców, a w przypadku dziew-cząt wymaga korekty. Przyjęto więc dla dziewdziew-cząt konsumpcję dwóch porcji napoju alkoholowego, czyli co najmniej 40 ml etanolu i obliczono, że taka ilość odpowiada intoksykacji (BAC) na po-ziomie około 0,74‰. Po skorygowaniu wskaźnika, wartości BAC są podobne dla dziewcząt i chłop-ców i bliskie definicyjnej wartości 0,8‰ dla binge drinking. Potwierdza to trafność skorygowanego wskaźnika w aspekcie strukturalnym. Sprawdzono także, czy skorygowany wskaźnik można uznać za trafny w aspekcie korelacyjnym. Wykorzystując dane z pięciu edycji badań iławskich, porównano odsetki upijających się uczniów w ostatnich 30 dniach, jakie dawał skorygowany wskaźnik binge drinking oraz subiektywny wskaźnik upijania się, czyli według własnej oceny badanych. Okazało się, że w czterech edycjach badań wartości obu wskaź-ników nie różniły się znacząco, a jedynie w bada-niach z 2005 r. różnice były istotne statystycznie (chi-kwadrat McNemara = 7,683; p = 0,006).
W badaniach ESPAD także analizowany jest wskaźnik nazywany binge drinking. Skonstruowano go na podstawie odpowiedzi na pytanie ankietowe: „Pomyśl o ostatnich 30 dniach. Ile razy (jeśli w ogóle) wypiłeś pięć lub więcej «drinków» z rzędu? («Drink» oznacza tu kieliszek wina, butelkę piwa, mały kieli-szek wódki lub innego napoju spirytusowego albo szklankę niskoprocentowego koktajlu)”. Nie zdefi-niowano przy tym pojęcia „niskoprocentowy” i nie określono liczbowo pojemności porcji napojów al-koholowych – „małego kieliszka” wódki czy „kielisz-ka” wina. Ponadto nie różnicowano wskaźnika pod względem płci. Można spodziewać się rozbieżności w poziomach wskaźników w naszych badaniach i ESPAD spowodowanych przez różnice definicyjne standardowych porcji alkoholu (czy też przez brak dostatecznej precyzji w definicjach).
Analiza danych
Wyniki badań mokotowskich obliczane są dla danych filtrowanych, z pominięciem uczniów star-szych rocznikiem, „drugorocznych”. Tymczasem w raportach z badań iławskich i ESPAD podaje się wyniki dla całej badanej próby, bez tego rodzaju wyłączeń. Z tego powodu przeliczono wartości wskaźników dla badań mokotowskich z uwzględ-nieniem uczniów „drugorocznych”.
Wskaźniki procentowe obliczano, odnosząc liczbę osób udzielających określonej odpowiedzi
do całkowitej liczebności badanej grupy (lub pod-grupy), wraz z brakami danych. Nie prezentowano wyników dla podgrup kobiet i mężczyzn z dwóch powodów: dla uproszczenia i większej czytelności porównań wyników różnych badań oraz ponieważ w ostatniej edycji badań iławskich stwierdzono brak istotnych różnic w poziomie wskaźników ze względu na płeć.
Różnice wartości wskaźników między poszcze-gólnymi edycjami badań iławskich analizowano, wykorzystując testy chi-kwadrat. W związku z tym w opisie wyników określenia „wzrost” lub „spa-dek” oznaczają z reguły istotne statystycznie zmia-ny, a „nieznaczny” czy „nieznaczący” wzrost lub spadek oznacza zmiany nieistotne statystycznie.
W analizach trafności wskaźnika upijania się (binge drinking) zastosowano wariant testu dla grup zależnych – chi-kwadrat McNemara.
Do obliczeń wykorzystano pakiet statystyczny SPSS 15.0.
■ w
ynIkIPalenie papierosów
Odsetki 15-letnich uczniów iławskich gimna-zjów aktualnie palących papierosy podlegały wy-raźnym wahaniom w ciągu ostatnich kilkunastu lat. Jak pokazano na rycinie 1, najpierw był okres znaczącego spadku z 34% do 22%, następnie w la-tach 2005–2010 okres wzrostu do 37% i w ostat-nich latach ponowny spadek do 26%.
Dane z ostatnich edycji badań wskazują na duże podobieństwo rozpowszechnienia bieżą-cego palenia papierosów wśród młodzieży iław-skiej, warszawskiej oraz w próbie ogólnopolskiej. W przypadku badań iławskich i ogólnopolskich badań ESPAD uzyskano nawet identyczne odsetki uczniów aktualnie palących papierosy, tj. 26,4%. Pewna różnica dotyczyła większej dynamiki wzro-stu wartości wskaźnika w badaniach iławskich (w latach 2005–2010 wzrost o 15,5 punktów procen-towych) niż w badaniach ESPAD (w latach 2007– 2011 wzrost tylko o 8 punktów procentowych).
Drugi wskaźnik, codzienne palenie papiero-sów, zmieniał się w czasie podobnie jak opisane wyżej bieżące palenie (ryc. 2). W badaniach iław-skich obserwujemy początkowo spadek wartości wskaźnika, a następnie wzrost i ponowny spadek, ze stabilizacją na poziomie około 12% w ostatnich latach. Linia łącząca poszczególne punkty po-miaru ma kształt wielomianowy, analogiczny jak tain answers to the total of the studied group (or
subgroup) together with lacking data. The results for male and female subgroups were not present-ed for two reasons: for simplification and greater clarity of compared results of various studies and as in the last edition of the Iława studies there was a lack of significant difference of indicator levels as regards gender.
Differences in the indicator values between particular Iława study editions were analysed us-ing chi-square tests. Therefore, in the discussion of results, the terms ‘increase’ or ‘decrease’ usually mean statistically significant changes, and the term ‘small’ rise or fall refers to statistically insignificant changes.
In the analysis of the validity of the binge-drink-ing indicator, we applied McNemar’s chi-square test variant for dependent groups.
The statistics package SPSS 15.0 was employed for calculation of results.
■ r
esulTsCigarette smoking
The percentage of 15 year-old Iława’s school students who currently smoke cigarettes has clear-ly varied over the course of the last several years. As Figure 1 demonstrates, first there was a period of marked falls from 34% to 22% and then be-tween 2005–2015 a period of growth to 37% and in the last years a new fall to 26%.
Data from the last study edition indicates a large similarity of prevalence of current cigarette smoking among Iława and Warsaw students and the national sample as well. In the case of the Iła-wa studies and the ESPAD national study, even identical percentages of cigarette smoking stu-dents were gained; i.e 26.4%. There was a certain difference with respect to the growth dynam-ic of the Iława study inddynam-icator (15.5% growth in 2005–2010) compared to the ESPAD studies (only 8% in 2007–2011).
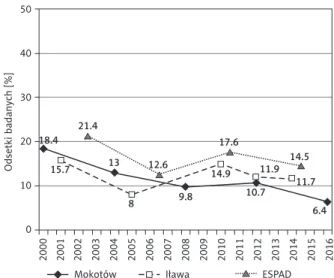
The other indicator – daily cigarette smok-ing – changed over time in similar fashion as described above current smoking (Fig. 2). In the Iława studies, at first we observed a fall in the indicator values, then a rise followed by an-other fall with a stabilisation at around 12% in re-cent years. The line joining all the measurement points is multinomial in shape and is analogous to the line illustrating changes in the indicator
for the ESPAD studies, though it is located a few percentage points lower on the chart. This means that the proportion of daily smokers in the Iława studies are systematically somewhat lower com-pared to those for young people in the national studies. In the school year 2014/2015 these were 11.7% and 14.5% respectively. The changes in this indicator in the Mokotów studies were somewhat different as there was a systematic fall in the dai-ly smokers percentage from 18.4% in 2000 to 6.4% in 2016. The only exception was a minimal, one per cent rise in the indicator between 2008 and 2012.
Drinking alcohol
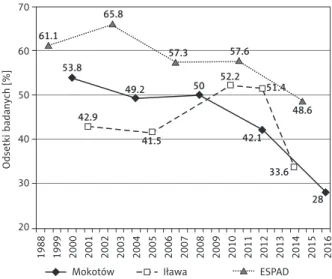
In the Iława studies we observe a basic rising tendency for the number of alcohol abstainers (not drinking in the last year) from 18% in 2001 to 30% in 2014, interrupted by a period of slight fall in 2005–2010 (Fig. 3). These changes are very simi-lar to the national sample, in which the abstinence indicator rose between 1999 and 2015 by around 10% to reach levels close to the Iława study results (28%) in 2015.
The changes in the abstinence indicator for the Mokotów studies were different. The shape of trend curve may be described with the aid of an exponential function. At first, in 2000-2008, the abstinence indicator remained at a
simi-linia obrazująca zmiany wskaźnika w badaniach ESPAD, ale znajduje się kilka punktów procen-towych niżej na wykresie. Oznacza to, że odsetki osób palących codziennie w badaniach iławskich są systematycznie nieco niższe w porównaniu z odsetkami młodzieży w badaniach ogólnopol-skich. W roku szkolnym 2014/2015 wynosiły one odpowiednio: 11,7% i 14,5%. Zmiany tego wskaź-nika w badaniach mokotowskich przebiegały nie-co inaczej – następowały systematyczne spadki odsetka codziennie palących: z 18,4% w 2000 r. do 6,4% w 2016 r. Wyjątkiem był minimalny, jed-noprocentowy wzrost wartości wskaźnika między 2008 i 2012 r.
Picie alkoholu
W badaniach iławskich obserwujemy zasadniczo tendencję wzrostową odsetka alkoholowych absty-nentów (niepijący w ostatnim roku) – z 18% w 2001 r. do 30% w 2014 r., przerwaną okresem nieznacznego spadku w latach 2005–2010 (ryc. 3). Zmiany te są bardzo podobne jak w próbie ogólnopolskiej, w któ-rej wskaźnik abstynencji wzrósł w latach 1999–2015 o około 10 punktów procentowych i osiągnął w 2015 r. wartość zbliżoną do wyniku z badań iławskich (28%). Zmiany wartości wskaźnika abstynencji w ba-daniach mokotowskich przebiegają inaczej. Kształt krzywej trendu można by opisać za pomocą funk-cji wykładniczej. Początkowo, w latach 2000–2008, Figure 1. Current cigarette smoking. Comparison of trends
among 15-year-old students observed in different stud-ies: Iława, Mokotów and ESPAD
Rycina 1. Palący papierosy. Porównanie trendów wśród uczniów klas III gimnazjum, obserwowanych w bada-niach iławskich, mokotowskich i ESPAD
2000 2001 2002 2003 2004 2005 2006 2007 2008 2009 2010 2011 2012 2013 2014 2015 2016 50 40 30 20 10 0 Odsetki badanych [%]
Mokotów Iława ESPAD
36.2 34.1 32.1 27.1 21.8 21.7 32.8 37.3 31.5 31 29.8 26.4 23.8 2000 2001 2002 2003 2004 2005 2006 2007 2008 2009 2010 2011 2012 2013 2014 2015 2016
Mokotów Iława ESPAD
50 40 30 20 10 0 Odsetki badanych [%]
Figure 2. Everyday cigarette smoking. Comparison of trends among 15-year-old students observed in different studies: Iława, Mokotów and ESPAD
Rycina 2. Codzienne palenie papierosów. Porównanie trendów wśród uczniów klas III gimnazjum, obserwowa-nych w badaniach iławskich, mokotowskich i ESPAD
18.4 15.7 21.4 13 8 9.8 12.6 17.6 14.5 11.7 11.9 14.9 10.7 6.4
lar level to remaining studies and gradually in-creased to 23% in 2008. Since then, the number of abstainers doubled in Mokotów and in 2016 reached 46%, clearly exceeding the abstinence levels shown among young people in Iława and the national sample.
A further indicator is drinking any kind of alcohol in the last 30 days (Fig. 4). In the Iła-wa studies at first between 2001 and 2005 the in-dicator values were stable at 42–43%. These were clearly lower over this period compared to the indicator values from the Mokotów studies (by around 8%) and very different to the na-tional levels, which were lower by around 20%. In the subsequent time period of 2005 to 2010, there was a dynamic rise in the indicator for the Iława studies to 52% while in the remain-ing studies this was a period of stabilisation and the start of marked falls in the Mokotów studies. Between 2010 and 2014, the direction of trends converges again as we note a dynamic decrease in the number of drinking young peo-ple in the last 30 days in all studies. However, the fall in the Iława studies is more dynamic and reached almost 20%, with 14% in the Mokotów studies and almost 10% in ESPAD. Therefore, the indicator values of the Iława studies and ESPAD diverges with in the last edition of both
wskaźnik abstynencji utrzymywał się na podob-nym poziomie jak w pozostałych badaniach, stop-niowo zwiększając się do 23% w 2008 r. Od tego czasu odsetek abstynentów na Mokotowie zwięk-szył się dwukrotnie i w 2016 r. osiągnął 46%, prze-wyższając wyraźnie odsetki abstynentów wśród młodzieży iławskiej i z próby ogólnopolskiej.
Kolejny wskaźnik to picie jakiegokolwiek na-poju alkoholowego w ostatnich 30 dniach (ryc. 4). W badaniach iławskich początkowo, między 2001 a 2005 r., wartości wskaźników utrzymywały się na stabilnym poziomie 42–43%. W tym okresie były wyraźnie niższe w porównaniu z wartościami wskaź-ników z badań mokotowskich (o około 8 punktów procentowych) i bardzo odbiegały od ogólnopol-skich (niższe o około 20 punktów procentowych). W następnym przedziale czasu (2005–2010) nastę-puje dynamiczny wzrost wartości wskaźnika w ba-daniach iławskich do 52%, podczas gdy w pozosta-łych badaniach jest to okres stabilizacji wskaźników i początek wyraźnych spadków w badaniach mo-kotowskich. W latach 2010–2014 kierunki trendów stają się znowu zbieżne – we wszystkich badaniach obserwujemy dynamiczne spadki odsetków mło-dzieży pijącej alkohol w ostatnich 30 dniach. Przy czym spadek w badaniach iławskich jest najbardziej dynamiczny i sięga blisko 20 punktów procento-wych, w badaniach mokotowskich 14, a w badaniach Figure 3. Abstainers (didn’t drink alcohol in the past year).
Comparison of trends among 15-year-old students ob-served in different studies: Iława, Mokotów and ESPAD
Rycina 3. Abstynenci (niepijący alkoholu w ostatnim roku). Porównanie trendów wśród uczniów klas III gim-nazjum, obserwowanych w badaniach iławskich, mo-kotowskich i ESPAD 1988 1999 2000 2001 2002 2003 2004 2005 2006 2007 2008 2009 2010 2011 2012 2013 2014 2015 2016 50 40 30 20 10 0 Odsetki badanych [%]
Mokotów Iława ESPAD
18 16.1 17.9 15.1 23.2 18.9 21.1 22.7 21.7 30.1 21.1 22.1 28.3 1988 1999 2000 2001 2002 2003 2004 2005 2006 2007 2008 2009 2010 2011 2012 2013 2014 2015 2016
Mokotów Iława ESPAD
70 60 50 40 30 20 Odsetki badanych [%]
Figure 4. Any alcohol use in the past 30 days. Compar-ison of trends among 15-year-old students observed in different studies: Iława, Mokotów and ESPAD
Rycina 4. Picie jakiegokolwiek alkoholu w ostatnich 30 dniach. Porównanie trendów wśród uczniów klas III gimnazjum, obserwowanych w badaniach iławskich, mokotowskich i ESPAD 61.1 65.8 53.8 42.9 49.2 50 41.5 52.2 48.6 28 42.1 57.6 33.6 46.3 30.3 57.3 51.4
Figure 5. Binge drinking in the past 30 days. Comparison of trends among 15-year-old students observed in differ-ent studies: Iława, Mokotów and ESPAD
Rycina 5. Upicie się w ostatnich 30 dniach, wskaźnik obiektywny. Porównanie trendów wśród uczniów klas III gimnazjum, obserwowanych w badaniach iławskich, mokotowskich i ESPAD 1988 1999 2000 2001 2002 2003 2004 2005 2006 2007 2008 2009 2010 2011 2012 2013 2014 2015 2016 50 40 30 20 10 0 Odsetki badanych [%]
Mokotów Iława ESPAD
46.5 36.3 42 26.9 24.3 37.7 24.5 26.3 20.7 32.9 20.9 19.2 31.6 1988 1999 2000 2001 2002 2003 2004 2005 2006 2007 2008 2009 2010 2011 2012 2013 2014 2015 2016
Mokotów Iława ESPAD
50 40 30 20 10 0 Odsetki badanych [%]
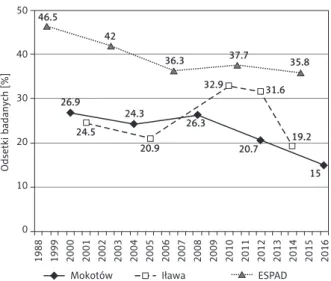
Figure 6. Any drug use at least once in the past year. Comparison of trends among 15-year-old students ob-served in different studies: Iława, Mokotów and ESPAD (ESPAD – indicator values were estimated based on marijuana use data)
Rycina 6. Używanie jakichkolwiek środków narkotyzu-jących co najmniej raz w ostatnim roku. Porównanie trendów wśród uczniów klas III gimnazjum, obserwo-wanych w badaniach iławskich, mokotowskich i ESPAD (ESPAD – wartości wskaźnika oszacowano na podsta-wie danych dotyczących używania marihuany)
14.4 20.6 17.9 17.9 12.8 17 16.8 26.2 21.2 18.6 22.7 22.5 35.8 10.3 23.5
Figure 7. Any designer drug use at least once in the past year. Comparison of short-term trends among 15-year-old students observed in Iława and ESPAD study
Rycina 7. Używanie dopalaczy co najmniej raz w ostatnim roku. Porównanie krótkoterminowych trendów wśród uczniów klas III gimnazjum, obserwowanych w badaniach iławskich i ESPAD
2010 2011 2012 2013 2014 2015 50 40 30 20 10 0 Odsetki badanych [%] ESPAD Iława 14 7.1 2.4 5.2 6.9 14.7 15
studies from the school year 2014–2015 to 34% and 49% respectively.
Binge drinking in the last 30 days
The binge-drinking indicator value among the Iława school students fell slightly from 25% to 21% in 2001–2005, and then rose significantly in 2010 to 33% to fall back to 19% in 2014 (Fig. 5). The changes in the indicator were quite similar in the Mokotów studies up to 2008, after which, instead of further growth as in the Iława studies, we observed a fall in the values from 26% to 15% in 2016. So the trends in both studies are similar with the exception of 2008 to 2012 when they were divergent.
The binge-drinking indicator applied in the ESPAD research (with a different structure to ours) reveals a higher estimate for binge-drinking school students compared to the other studies. These differences were considerable and reached 20%. In 1999–2007, the indicator values fell sys-tematically from 47% to 36% and then remained stable at that level until 2015.
Drug use
As shown in Fig. 6, the lines joining the mea-surement points converge in the Iława studies and ESPAD. This means that in both studies the number of students using drugs at least once in the last year is almost identical over several years. In the Iława studies the start indicator val-ue was around 18% in 2001, then a fall to 10% in 2005 followed by a very clear rise to 26% in 2012 and a slight fall to around 21% in 2014.
The changes in the indicator values were differ-ent in the Mokotów studies. Up to 2004, the num-ber of users was slightly higher than in the Iława studies but these equalled out in 2008 at around 17% and only to then rise slightly to reach 15% in the last study edition.
Designer drugs use
According to the Iława studies from the end of 2010, 14% of 15 year-old school students had used designer drugs at least once in the past year (Fig. 7). This number fell to 2.4% in 2012 followed by a slight rise to 5.2% at the end of 2014. ESPAD data, which included only two readings from the spring of 2011 and 2015, indicate a stabilisa-tion of designer drug consumers during the last
ESPAD to blisko 10 punktów. Skutkiem tego wartości wskaźników w badaniach iławskich i ESPAD oddala-ją się i w ostatniej edycji obu badań z roku szkolnego 2014/2015 wynoszą odpowiednio: około 34% i 49%.
Upijanie się w ostatnich 30 dniach
Wśród iławskiej młodzieży wartość wskaźnika upijania się (binge drinking) w latach 2001–2005 nieznacznie spadła z 25% do 21%, a następnie zna-cząco wzrosła w 2010 r. do 33%, by w 2014 r. spaść do 19% (ryc. 5). Dość podobnie przebiegały zmiany wskaźnika w badaniach mokotowskich do 2008 r., po czym, zamiast dalszego wzrostu jak w badaniach iławskich, obserwujemy spadek wartości wskaźnika z 26% do 15% w 2016 r. Tak więc trendy w obu ba-daniach są zbliżone, z wyjątkiem okresu 2008–2012, kiedy podążyły w różnych kierunkach.
Wskaźnik binge drinking stosowany w bada-niach ESPAD (inaczej skonstruowany niż w na-szych badaniach) dawał wyższe oszacowania od-setków upijającej się młodzieży w porównaniu z pozostałymi badaniami. Różnice te były znacz-ne i sięgały 20 punktów procentowych. W latach 1999–2007 wartości wskaźnika systematycznie spadały – z 47% do 36%, a następnie pozostawały stabilne na tym poziomie aż do 2015 r.
Używanie narkotyków
Jak obrazuje rycina 6, linie łączące punkty po-miaru w badaniach iławskich i ESPAD pokrywają się. Oznacza to, że w obu badaniach odsetki uczniów używających narkotyków przynajmniej raz w ostat-nim roku są na przestrzeni kilkunastu lat niemal identyczne. W badaniach iławskich, począwszy od około 18% używających w 2001 r. i spadku wartości wskaźnika do 10% w 2005 r., obserwujemy bardzo wyraźny wzrost do 26% w 2012 r. i następnie nie-znaczny spadek do około 21% w 2014 r.
Inaczej przebiegały zmiany wartości tego wskaź-nika w badaniach mokotowskich. Do 2004 r. odset-ki używających były nieco wyższe niż w badaniach iławskich, ale wyrównały się w 2008 r. na poziomie około 17%, aby następnie po nieznacznym wzroście osiągnąć w ostatniej edycji badań poziom 15%.
Używanie dopalaczy
Według danych z badań iławskich, w końcu 2010 r. 14% gimnazjalistów używało dopalaczy przynajmniej raz w ostatnim roku (ryc. 7). Odsetek ten spadł do 2,4% w 2012 r. i następnie wzrósł nieznacznie do 5,2%