STUDIES IN PHYSICAL CULTURE AND TOURISM Vol. 15, No. 3, 2008
MAGDALENA KRZYKAŁA1, JAN KONARSKI2 1
Department of Anthropology and Biostatistics, University School of Physical Education in Poznań, Poland 2
Department of Theory of Sport, University School of Physical Education in Poznań, Poland
BODY COMPOSITION OF FIELD HOCKEY PLAYERS IN VIEW
OF THE ENVIRONMENTAL INDEX METHOD
Key words: field hockey, body build, environment Perkal indexes, sport anthropology.
ABSTRACT
The aim of the paper was to examine the significance of athletes’ body height in the final sort ranking as well as differences in body height between field hockey teams participating in a field hockey tournament. The study consisted of measurement of 11 selected somatic features in 83 hockey players representing five countries. The complex of Perkal’s method for environmental index in Milicer’s modification was employed in the analysis. The results reveal that the presented method can be useful in sport practice. The obtained results will make it possible to create a hypothetical player’s model to help coaches in their selection of individual training loads, which combined with an adequately balanced diet will assure achievement of expected training and sport results.
INTRODUCTION
Factors conditioning success in sport can be physiological, psychological, technical and tactical [2]. Body size and build are also significant factors in some sports [4, 13]. The importance of morpho-logy varies from sport to sport and depends on one’s given training stage. The literature on the subject has placed a considerable emphasis on size per se and physique, most often assessed as the Heath-Carter anthropometric somatotype [8]. Such studies have been largely focused on adult athletes. In contrast, the literature on youth competitors representing different sports is more varied. Some studies concentrate on changes connected with physical growth and maturation, while others follow the adult athlete model, i.e., physical characteristics of young athletes in different sports [15, 16]. Several problems visible in studies of
young athletes should be noted. Sport success at a young age is no guarantee of success at an older, more specialized age. Dropping out of a sport is common as young athletes progress from childhood through adolescence. Dropping out may be a youngster’s own choice, or it may be related to the specific sport system, i.e., systematic selection and exclusion of young athletes during the develop-mental process [17].
Although the literature on the size and physique of athletes is reasonably extensive, some sports are less represented than others. A case in point is field hockey. Representative studies of this sport include research by Toriola et al. [24], Scott [20], Reilly and Borrie [19], and Elferink-Gemser et al., [6, 7]. Less known are studies of Polish field hockey players by Drozdowski [3], Drozdowski and Michałowska [4], Strzelczyk [21], Strzelczyk et al. [22] and Krzykała [11].
Correspondence should be addressed to: Magdalena Krzykała, Department of Anthropology and Biostatistics University School of Physical Education in Poznań, Poland, ul. Królowej Jadwigi 27/39, 61-871 Poznań, Poland, tel./fax. +48 61 835 52 60, e-mail: krzykala@awf.poznan.pl
Magdalena Krzykała, Jan Konarski
An important influence on the development of field hockey has been the replacement of the natural playing surface with the synthetic one [19]. Although the player’s forward leaning position is common in field hockey, the extent of the forward lean is far greater on the artificial turf. This change was related, in part, to the running technique, stick length and changes in tactics. On an artificial surface, the characteristic position of a player features a greater lean forward for most of the game. This results from specific defensive tactics and the use of a shorter stick, held generally with the left hand in the upper part and the right hand in the middle. The changes of the grip position depend on specific game situations. Field hockey has also become faster and more dynamic, resulting in new tactics and changes in selection, development and preparation of players [20, 10].
The purpose of this study was twofold: (1) to compare the physique of field hockey players from different countries taking part in an international tournament; and (2) to assess the relationship, if any, between the players’ somatic characteristics and the team’s position in the final tournament ranking.
METHODS
The sample included 83 players from teams participating in the 9th Elimination Tournament for the Field Hockey Men’s European Championship, which took place in Poznań on 8-14 July 2002. The players came from five countries: Poland, Sweden, France, Slovenia and Croatia. Players from two other countries competing in the tournament, i.e. Scotland and Hungary, did not participate in the study.
The study was approved by the ethics committee of the University School of Physical Education in Poznań. Permission to conduct the study was granted by the tournament organizing committee and team representatives; individual players gave their informed consent.
The following dimensions were measured following the protocol described in Drozdowski [5]: body height (cm) and body mass (kg); flexed arm and calf circumferences (cm); subscapular, abdominal, triceps and medial calf skinfold thicknesses (mm); and biepicondylar (humerus) and bicondylar (knee) widths (cm). Body height was measured using a field anthropometer; body mass
was measured using an electronic scale to 500 mg. Circumferences, skinfold thicknesses and skeletal breadths were measured in the standard way.
In addition to the body size, the selected dimensions provided indexes of three components of body build [13, 14]: linearity (m1): body height; muscularity (m2): flexed arm and calf circum-ferences, elbow and knee widths; and adiposity (m3): four skinfold thicknesses. Each dimension was converted to a z-score (standard score) as follows:
z = (Xi – Xm) / SD,
where: Xi was the individual trait value, Xm – the mean value of the trait for the total sample of players, and SD was standard deviation of the trait for the total sample of athletes.
Perkal indexes were calculated as follows: ∑Z /P,
where: Z was the normalized value and P was the number of traits in one factor.
The general dimension index (M) was also calculated as follows:
M = m1 + m2 + m3 / 3
It is the arithmetic average of three components of body build (structural factors) – length muscularity and adiposity. First, individual characteristics were calculated and then traits of the whole team.
The index presented in standard deviation units indicated the general dimension (build) of a given team relative to the other teams in the sample. A positive value of M index means that the examined team is generally larger than the control team; negative – that it is generally smaller.
The internal variability index was calculated. Milicer’s modification [18, 14] of Perkal’s Environmental Index allows the estimation in internal proportions of the players – in this case combined for each given team. Perkal’s index was calculated by subtracting from every structural factor for each individual the general value:
ml – M; m2 – M; m3 – M.
where: M – general dimension index, m1 – linearity, m2 – muscularity, m3 – adiposity.
The indexes were assigned three-point values (internal proportion code) which provided an
indication of the share of each structural factor in the overall body build. A positive sign of envi-ronmental index indicated the dominant development of the respective factor in the body build of an individual; a negative sign indicated less significant development of the respective factor in the body build of an individual. A harmonic or balanced body build approximated the mean for the group, i.e., the value of environmental index close to zero. Environmental indexes were also transfor-med into distribution points for each specified factor (Table 2).
RESULTS
Means and standard deviations for age and all anthropometric dimensions for each of the five teams and for the total sample are summarized in Table 1.
The index of general body build (M) for each team is summarized in Table 2.
The index of body build was quite similar for the teams from France, Slovenia and Croatia. The indexes of general body size were close to each other and at the same time higher than the group average, i.e. 0.
The lowest value of M index (–1.03) and also the lowest internal variability (0.29) was character-ristic of the Polish team (Table 2). The Polish team was characterized by low body height, low fat adiposity and better development of muscularity. All structural factors (length, muscularity, adipo-sity) were relatively similar in the Polish team. By transforming the environmental index value for the Polish team into distribution points of every specified factor a value of 2-2-1 (see Tab. 1) was noted.
For the Swedish team, the distinctive element was lack of deviation from the reference range, i.e., the average of all teams. The Swedes also had the highest bracket values for body height, as did the Croatian and Slovenian players. Using the envi-ronmental point scale this team was characterized as 5-4-3.
Table 1. Point scales of environmental indexes
Points Perkal’s environmental index 1 –x to –1.07 2 –1.06 to –0.57 3 –0.56 to –0.18 < mean 4 –0.17 to 0.18 mean 5 0.19 to 0.57 6 0.58 to 1.06 7 1.07 to x > mean
Players from France featured the highest level of skeleton robustness, while the team from Slovenia demonstrated the highest adiposity (in addition to low body height). The Slovenian competitors were also characterized by a large general body size, as represented by the M index. Players from Croatia were the tallest and had relatively high body mass with large arm and calf circumferences, as compared to those of other teams (Figure 1).
Table 2. Arithmetic averages of players’ age, training periods, final places in the competition and environmental indexes of structure factors and inner – personal variability index of the studied teams
National team n Age (year) Training period (year) Final ranking place M index Linearity index Muscularity index Adiposity index Point scale Inter-personal changeability index Scotland* – – – I – – – – – – Poland 18 26.2 14.6 II –1.03 –0.90 –1.01 –1.19 2–2–1 –0.29 France 17 24.9 17.9 III 0.37 –0.03 0.55 0.59 3–5–5 0.62 Sweden 18 26.2 11.8 IV –0.06 0.15 –0.09 –0.25 5–4–3 0.40 Hungary* – – – V – – – – – – Croatia 15 25.3 13.2 VI 0.41 0.82 0.19 0.22 6–5–5 0.60 Slovenia 15 21.7 9.4 VII 0.52 0.19 0.52 0.84 5–5–6 0.65
* Seven teams participated in the tournament but two teams (Scotland and Hungary) did not give their consent to participate in anthropometric measurement.
Magdalena Krzykała, Jan Konarski
Perkal’s index describes the relationship between features of each player or team. Large differences suggest disproportions in body build. If the index value is close to zero it describes weighted body proportions of a player or a team. The point of using Perkal’s index in this analysis (and not finishing the analysis on the stage-specific factors or general body build M index) was clear, especially in the case of the teams from France and Croatia. The figures of general body value M index were 0.37 and 0.41. Body dimensions in the control group were similar. The value of M index in this case does not differentiate between those teams, but even makes them similar, while the discussed teams are completely different (see Tab 2). The estimation of structural internal proportions showed several differences (Fig. 2).
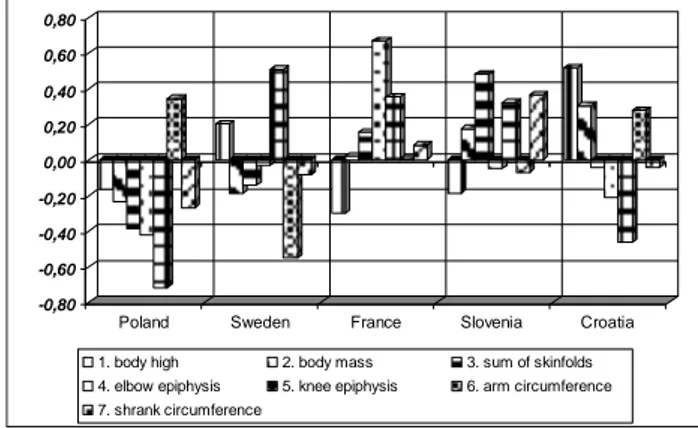
The French team featured a slight reduction of length factor (–0.03) and a high positive index values for adiposity (+0.59) and muscularity (+0.55). The Croatian team was greater in length (+0.82) but at a similar level of adiposity and muscularity. For the Polish team, all the structural features bore a negative sign (Tab. 2).
-1,50 -1,00 -0,50 0,00 0,50 1,00
Poland Sweden France Slovenia Croatia
Linearity Muscularity Adiposity
Figure 1. Morphological features of studied teams (after normalization on M and SD of all teams)
DISCUSSION
Perkal’s environmental indexes differ from team to team. There is, however, a clear trend. Positioning in the general classification is thought to be ‘forced’ by the reduction of the linearity factor. The above dependencies find their reflection in a player’s morphologic image, which is probably combined with the hockey players’ position during the match. The player’s speed factor combined with the linear dimensions of equipment used in the game, i.e. the stick, causes a preference of medium and short players over tall ones. Additionally, large body height may be an unfavorable factor as it may overload the spinal column [20].
Łaska-Mierzejewska [14] suggests that, in general, top-level competitors feature a very high advantage of one structural factor over another, whereas among lower level players this difference is insignificant. In the case of the studied teams, no significant differences at the level of specific factors were noted even though all the teams were competing at a high sport level. Common sense suggests that some body build components may present a potential risk. For example, a relatively low body height and a high fat mass are potential limitations in professional sport. In a 70-minute game, excess adipose tissue is an unwanted load for the player and presents an additional energetic burden [23]. Distances of 8,500 – 12,000 m are regularly covered in field hockey matches [10], and the burden of excess fatness can be magnified under such conditions.
-0,80 -0,60 -0,40 -0,20 0,00 0,20 0,40 0,60 0,80
Poland Sweden France Slovenia Croatia
1. body high 2. body mass 3. sum of skinfolds 4. elbow epiphysis 5. knee epiphysis 6. arm circumference 7. shrank circumference
Figure 2. Components of body build for each team after normalization
Polish field hockey players featured the lowest general body size relative to the reference group (M = –1.03). The Swedish players also had a negative score for general body size (M = –0.06), but further analysis indicated this was due only to muscularity and adiposity. In contrast, players from France, Slovenia and Croatia were generally bigger than the reference group (0.37, 0.52, 0.41, respectively). However, all three teams differed in
the proportional contributions of specific structural elements.
In summary, the body build of the studied players may potentially influence the final result. Although the observed differences in body build are not consistently clear, those that are apparent appear to be related to the ranking place of the respective teams in the final results.
In conclusion, at this sports level, even a small deviation from the ‘model’ (required set of proportions of all structural elements) may affect the final results. The presented method allows us to perceive the differences of individual factors when general body build is similar among the teams or players. A potentially confounding factor is experience. Players on the Polish and French teams were the most experienced ones and were also older, on the average, as compared with the other three teams. The potential interaction of experience and somatic characteristics needs further consideration. The obtained results enable deve-lopment of a universal model of a player, allowing a better targeted choice of talented sports partici-pants at an early level of their sports development. Coaches using this approach can simplify their choice of individual training levels, which combined with an appropriate balanced diet should ensure better training and sports results contributing to the player’s or the team’s sports success.
REFERENCES
[1] Barnes M.J., Kentwell R.G.R., Field hockey: the coach and the player. Allyn and Bacon. Boston, University of Iowa, 1990.
[2] Bompa T.O., Periodization. Theory and method-logy of training. 4th ed. Champaign, IL: Human Kinetics, 1999.
[3] Drozdowski Z., Antropologia sportowa (Sports anthropology), Podręczniki Nr 12, Warszawa-Poz-nań, 1972.
[4] Drozdowski Z., Michałowska A., Hokeiści na trawie w świetle typologii A. Wankego (Field hockey players in the light of A. Wanke’s typology), Wychowanie Fizyczne i Sport, 1997, 1-2. [5] Drozdowski Z., Antropometria w wychowaniu
fizycznym (Anthropometry in physical education). Podręczniki nr 24, University School of PE in Poznań, 1998.
[6] Elferink-Gemser M.T., Visscher C., Lemmink K.A.P.M., Psychological characteristic of talented
youth athletes in field hockey, basketball, volleyball, speed skating, and swimming. The Sports Psychologist, 2005.
[7] Elferink-Gemser M.T., Visscher C., Maj van Dujin, Lemmink K.A.P.M., Development of the internal endurance capacity in elite and sub-elite youth field hockey players. British Journal of Sports Medicine 2006, 40, pp. 340-345.
[8] Heath B.H., Carter L.J., A modified somatotype method. Am. J. Phys. Anthropol. 1967, 27 (1), pp. 57-74.
[9] Konarski J., Characteristics of external and internal loads in field hockey competitions and training. Doctoral dissertation, University School of Physical Education in Poznań, 2003.
[10] Konarski J., Strzelczyk R., Characteristics of selected parameters of external load of players during a match and training on the example of field hockey (in:) New ideas in sport sciences: current issues and perspectives. Part 1 International Association of Sport Kinetics 2003, Library series Vol. 15, pp. 128-131.
[11] Krzykała M., Studia związku sportowej aktywności fizycznej i komponentów ciała, Dysertacja doktor-ska. (Doctoral dissertation) University School of Physical Education Poznań, 2002.
[12] Łaska-Mierzejewska T., Wpływ naturalnej selekcji i oddziaływania treningu na budowę ciała zawod-ników gier zespołowych (Influence of natural selection and training effect on body composition of team games players), Sport Wyczynowy, 1973, 3-4. [13] Łaska-Mierzejewska T., Antropologia w sporcie
i wychowaniu fizycznym (Anthropology in sport and physical education), Biblioteka Trenera, COS, Warszawa 1999.
[14] Łaska-Mierzejewska T., Ocena budowy soma tycz-nej człowieka (Assessment of human body build), (in:) Zastosowanie metod naukowych na potrzeby sportu (The application of scientific method for sport practice) T. Ulatowski ed., PTNKF Library, vol. XI, Warsaw 2002.
[15] Malina R.M., Physical activity and training: Effects on stature and the adolescent growth spurt. Medicine and Science in Sports and Exercise, 1994, 26, pp. 759-766.
[16] Malina R.M., Eisenmann J.C., Cumming S.P., Ribeiro B. and Aroso J., Maturity-associated variation in the growth and functional capacities of youth football (soccer) players 13-15 years.
European Journal of Applied Physiology, 2004, 91,
pp. 555-562.
[17] Malina R.M., Beunen G., Growth and maturation: Methods of monitoring, (in:) The Young Athlete,
Magdalena Krzykała, Jan Konarski
H. Hebestreit and O. Bar-Or, eds, Malden, MA: Blackwell Publishing, 2008, pp. 430-442.
[18] Milicerowa H., Klasyfikacja somatotypologiczna jako metoda pomocnicza w badaniach nad rozwo-jem dzieci i młodzieży (Somatotypological classi-fication as an auxiliary method in studies of children and youth growth), Wychowanie Fizyczne
i Sport, 1959, vol. III, 4, pp. 403-427.
[19] Reilly T., Borrie A., Physiology applied to field hockey. Sports Med 1992; 14, pp. 10-26.
[20] Scott P.A., Morphological characteristics of elite male field hockey players. The Journal of Sports
Medicine and Physical Fitness, 1991; Vol. 31,
No 1, pp. 57-61.
[21] Strzelczyk R., Porównanie wieku, wzrostu i ciężaru ciała hokeistów na trawie z innymi polskimi reprezentacjami na Igrzyskach w Monachium (Comparison of age, body height and body mass of Polish field hockey players with other Olympic teams during the Munich Olympics). Monographs of the University School of Physical Education in Poznań 1974, 49.
[22] Strzelczyk R., Konarski J., Karpowicz K., Janow-ski J., Changes in the main abilities of field hockey players during the preparatory period leading up to main competition. Acta Universitatis Plackinae Olomusiensis Gymnica 2001, vol. 31, 2, pp. 17-21. [23] Thoden J.S., Wilson B.A., MacDougall J.D.,
Wenger H.A., Greed H.J. (eds.). Physiological Testing of the Elite Athlete. Canada: Mutual Press Ltd, 1982.
[24] Triola A.L., Salokun S.O., Matur D.N., Somatotype characteristic of male sprinters, basketball, soccer, and field hockey players. Int J Sport Med 1985, 6 (6), pp. 344-346.