INDUSTRIAL PLANTS PERFORMANCE EVALUATION
USING DYNAMIC DEA
Aldona Kluczek*
* Insitute of Organization of Production Systems, Faculty of Production Engineering, Warsaw University of Technology, Warsaw, 02-524 Poland,
Email: a.kluczek@wip.pw.edu.pl
Abstract: The objective of the paper is to evaluate the energy efficiency performance of industrial plants based on energy audit measures using dynamic Data Envelopment Analysis. The paper demonstrates a three-stage DEA based on slacks-based measure approach to evaluate the energy efficiency of U.S. industrial plants. Also, a 3-step approach to select relevant variables to be employed in slacks-based measure model. The paper has revealed inefficiencies of industrial plants, which were considered as efficient ones examined individually in energy audit procedure. The results indicate that half of analysed plants are not performing at high energy efficiency, given a total of 6 facilities were operating efficiently. It shows that these industrial plants appear to have the potential to reduce their energy use and cost. Moreover, the results were enriched with the additional analysis of input excesses and output shortfalls and further suggestions for improving energy efficiency are provided.
Paper type: Research Paper Published online: 28 October 2016
Vol. 6, No. 5, pp. 465–476
DOI: 10.21008/j.2083-4950.2016.6.5.8 ISSN 2083-4942 (Print)
ISSN 2083-4950 (Online)
© 2016 Poznan University of Technology. All rights reserved.
Keywords: dynamic DEA, energy efficiency, industrial plants, slacks-based measure ap-proach
1. INTRODUCTION
Efforts to increase energy efficiency and reduce environmental footprint of these facilities have expanded or gained significant traction in USA (Thollander, Backlund, Trianni & Cagno, 2013). The major energy saving opportunities are probably bound to manufacturing processes optimization and energy process inte-gration within manufacturing plants and energy intensive manufacturing industry (Saidur & Mekhilef, 2010; Yingjian, Jiezhi, Qi &Yafei, 2010; Noro & Lazzarin, 2014), and others. Currently available energy efficient and cost-effective technolo-gies can improve energy performance efficiencies in lighting, heating, cooling, refrigeration, transportation, and other areas throughout the U.S. programs (Ander-son & Newell, 2004; Thollander, Backlund, Trianni & Cagno, 2013). Further, the energy efficiency can be improved by a wide variety of technical actions including e.g. refurbishing equipment; replacing and retiring obsolete equipment, process lines to new and state of art technologies or using heat management to decrease heat loss and waste energy (Xue, Wu, Zang, Dai & Chang, 2015).
The potential for energy efficiency improvements remains untapped, especially in the SME sector in the European Union, where energy consumption is not always seen as a major cost factor. An evaluation of plants performance is an essential action thorough energy audits in identifying energy saving opportunities and devis-ing goals for energy improvement. The analysis of energy – intensity plants has cantered traditionally on the analysis of economies (cost and energy savings) under the implicit assumption that all companies are efficient (Saidur & Mekhilef, 2010; Yingjian, Jiezhi, Qi &Yafei, 2010; Noro & Lazzarin, 2014). The empirical evi-dence is often based on aggregate data at country or industry level, or disaggregate firm level data in industrial and developing countries. Energy losses in manufactur-ing processes remain unavoidable even if all potential savmanufactur-ings are exploited as the results of energy audits. Because of the above features, DEA has widely been used for the measurement of technology productivity improvement or processes and optimal allocation of resources in various manufacturing sectors (Onüt & Soner, 2007; Zaim, 2004). Furthermore, due to its measurement of technical change, DEA-SBM has gained popularity in energy efficiency analysis in many fields (Grösche, 2008; Moritaa, Hirokawa & Zhu, 2015). Hence, DEA-SBM was applied in measure and benchmark companies performance as an effective method for per-formance analysis with multiple inputs and outputs.
The objective of the paper is to evaluate the energy efficiency performance of industrial plants based on energy audit measures in order to separate efficient and inefficient manufacturers from the set of plant considered as efficient ones. Twelve industrial plants are considered as decision making units whose efficiencies were determined by energy-efficiency solutions recommended during energy audits. A DEA-SBM model is employed in improvement to illustrate the application of the model based on the U.S. industrial plants.
2. ENERGY EFFICIENCY MEASUREMENT FRAMEWORK
2.1. DEA and Different Efficiency Concepts
The measurement of efficiency in production units is defined as the quotient of the weighted sum divided by the weighted sum of the effects of inputs. Lovell de-fines the efficiency of a production unit in terms of a comparison between observed and optimal values of its output and input (Lovell, 1993). The comparison can take the form of the ratio of observed to maximum potential output obtainable from the given input, or the ratio of minimum potential to observed input required to pro-duce the given output. In these two comparisons the optimum is defined in terms of production possibilities, and efficiency is technical (Daraio & Simar, 2007).
In determining the variables inputs and outputs expert knowledge or accepted practices can be useful (Morita & Avkiran, 2009). The selection of the inputs and outputs became in the concern of researchers since this issue can lead to misleading conclusions due to the different structures of the sectors (Saricam & Erdumlu, 2012) and company`s performance (Duzakin & Duzakin, 2007).
According to Charnes, Cooper & Rhodes, 1981, DMU is to be rated as fully ef-ficient on the basis of available evidence if and only if the performances of other DMUs do not show that some of its inputs or outputs can be improved without worsening some of its other inputs or outputs.
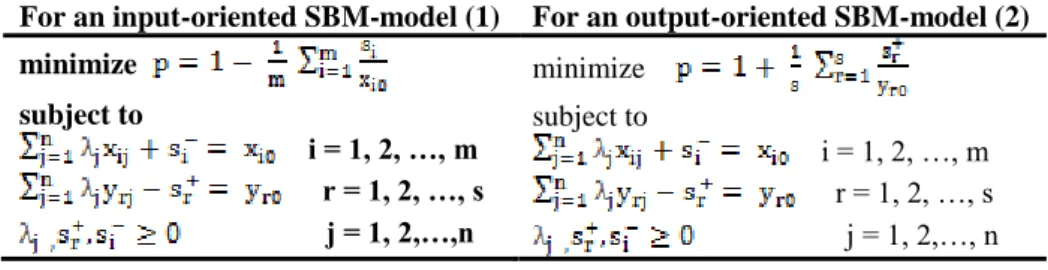
Table 1. The notation for an input- and output-oriented SBM-model
For an input-oriented SBM-model (1) For an output-oriented SBM-model (2)
minimize subject to i = 1, 2, …, m r = 1, 2, …, s j = 1, 2,…,n minimize subject to i = 1, 2, …, m r = 1, 2, …, s j = 1, 2,…, n
Various DEA models have been established as basic model modifications of C2R model, which initially proposed by Charnes, Cooper & Rhodes, 1981. In this way, improving energy efficiency of industrial processes can be achieved by using the Slack-Based Measure Model (SBM). SBM model developed by Tone, 2002, can be used to measure company-level inefficiency providing an unambiguous measure of effectiveness. Efficiency is measured only by additional variables s+ and s–. The variables s+ and s– measure the distance of inputs Xλ and outputs Yλ of a virtual unit from those of the unit evaluated (Xo). The numerator and the denominator of the objective function of model (1) measures the average distance of inputs and outputs, respectively, from the efficiency threshold. DMU (xio, yro) in
model (2) is SBM-efficient unit, if p* = 1, that means si * +
= 0, si *-
variables for input and output in optimal solution. It provides an efficiency score between 0 and 1. The model formulas depending on either the input or output orientation, to ensure that the result is found from variables, which are under managerial control is expressed in Table 1, (Thanassoulis, 2003).
Other approach which extends existing SBM Network Data Envelopment Analysis is presented by Lozano, 2015. In this model the input and output slacks are measured at the system level instead of at the process level giving freedom to the different processes to increase some inputs or decrease some outputs. There-fore, it leaves a room for further research related to the relationship between the overall efficiency of the system and the efficiency of its processes (Lozano, 2015).
2.2. Empirical study of efficiency using SBM-DEA
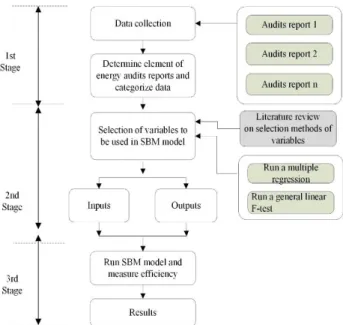
The procedure for SBM-DEA measures energy efficiency of industrial plants in three stages (Fig. 1). In the first phase the author focuses on identifying the key elements of energy audits reports that provide the database to evaluate efficiency of industrial plants.
Fig. 1. Structure of research framework
Relevant elements of energy audits that can be attributed to efficiency im-provements are categorized into inputs and outputs in order to select appropriate variables. In the second stage multiple regression is used to select variables in order to be evaluated using SBM-DEA model. Then, based on the application of SBM model, the experimental results will be evaluated in the third step. In this study, the
data was collected for twice in 2013 and 2014 respectively. Quantitative measures data of various processes were obtained by means of energy audits. This study is built upon the results of energy audits carried out by the author with the Industrial Assessment Center`s experts at the University of Michigan.
2.2.1. Data collection
Manufactures must meet criteria described in Alhourani & Saxena, 2009. The analysis was established for 12 facilities from the industries classified to the North American Industry Classification System (NAICS) based on production-oriented principles as industrial performance consists of fluid power valves and hose fit-tings, manufacturing processed milk products, metal coating, semiconductor and related device manufacturing, motor vehicle brake system manufacturing.
2.2.2. Determining elements of energy audits reports
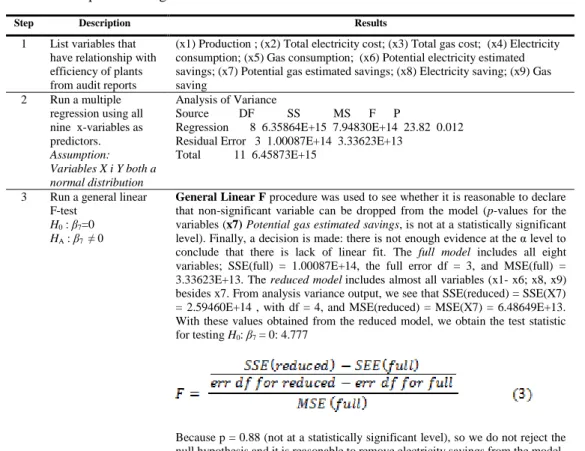
Table 2. Steps for setting variablesStep Description Results
1 List variables that have relationship with efficiency of plants from audit reports
(x1) Production ; (x2) Total electricity cost; (x3) Total gas cost; (x4) Electricity consumption; (x5) Gas consumption; (x6) Potential electricity estimated savings; (x7) Potential gas estimated savings; (x8) Electricity saving; (x9) Gas saving
2 Run a multiple regression using all nine x-variables as predictors. Assumption: Variables X i Y both a normal distribution Analysis of Variance Source DF SS MS F P
Regression 8 6.35864E+15 7.94830E+14 23.82 0.012 Residual Error 3 1.00087E+14 3.33623E+13
Total 11 6.45873E+15
3 Run a general linear F-test
H0 : β7=0
HA : β7 ≠ 0
General Linear F procedure was used to see whether it is reasonable to declare
that non-significant variable can be dropped from the model (p-values for the variables (x7) Potential gas estimated savings, is not at a statistically significant level). Finally, a decision is made: there is not enough evidence at the α level to conclude that there is lack of linear fit. The full model includes all eight variables; SSE(full) = 1.00087E+14, the full error df = 3, and MSE(full) = 3.33623E+13. The reduced model includes almost all variables (x1- x6; x8, x9) besides x7. From analysis variance output, we see that SSE(reduced) = SSE(X7) = 2.59460E+14 , with df = 4, and MSE(reduced) = MSE(X7) = 6.48649E+13. With these values obtained from the reduced model, we obtain the test statistic for testing H0: β7 = 0: 4.777
Because p = 0.88 (not at a statistically significant level), so we do not reject the null hypothesis and it is reasonable to remove electricity savings from the model.
The elements for determining energy efficiency found in the audit reports such actual cost of energy, cost savings, energy conservation opportunities, and produc-tion, are based upon the observations, measurements of industrial plant operations performed by the IAC team during the plant visit.
2.2.3. Selection of variables
In order to select significant variables to be evaluated in SBM model, the author provided a 3-step process where in the first step x-variables are distributed from energy audits reports (Table 2). In the second step the variables are run by a multi-ple regression and in the third step a general linear F-test to see whether it is rea-sonable to declare that non-significant variable can be dropped from the model.
Then, X-variables are categorized into input (I) and output (O) to be evaluated on SBM model as shown in Table 3. The outputs of each plant are potential elec-tricity estimated savings (Y1), elecelec-tricity savings (Y2), gas savings (Y3) was measured. The input data include production (X1), total electricity cost (X2), total gas cost (X3), electricity consumption (X4), total gas consumption (X5).
2.2.4. SBM-DEA evaluation and results analysis
The results of an energy efficiency measures based on application of a slacks-based measure model in DEA model for efficient manufacturing plants individually are presented in Table 4. With data in Table 2, the technical efficiency of facilities through DEA Solver Pro 5.0 is calculated.
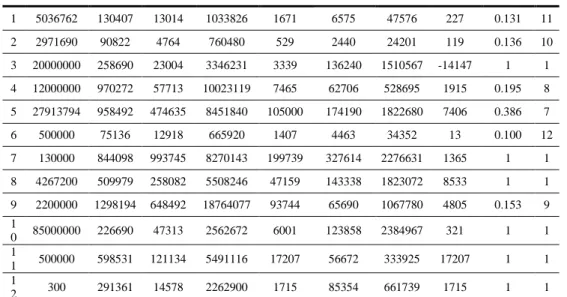
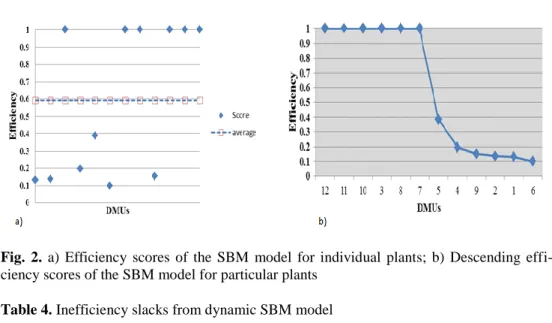
Table 3 represents the energy efficiency of the 12 industrial plant, which is the result of employing SBM-input oriented model (1). The paper single out productive units DMU 3, DMU 7, DMU 8, DMU 10, DMU 11, and DMU 12 as efficient. Sub-stantial inefficiency between six plants (DMU 1, DMU 2, DMU 4, DMU 5, DMU 6, DMU 9) are far from achieving an energy-efficient regime. The lowest ciency score is 0.38 assigned to the DMU 5. The main reason for being an ineffi-cient manufacturer is excess use of electricity and gas. The ineffiineffi-cient DMUs 1 and 2 are very close to each other, moreover, DMUs 1 and 2 in comparison with DMUs 4, 5, 9 are more inefficient and other technical efficient DMUs do not dominate them. It is also observed that these considered inefficient plants get lower scores than the average efficiency score of 5.91 for 12 facilities, as shown in Fig. 2a.
The efficiency of the facilities allowed getting a ranking of efficient companies. The ranks of these DMUs are illustrated in the last column of Table 3 which shows the following ranking: DMU 12 = DMU 11 = DMU 10 = DMU 3 = DMU 8 = DMU 7 > DMU 5 > DMU 4 > DMU 9 > DMU 2 > DMU 1 > DMU 6. Fig. 2b de-picts the results of descending values of efficiency scores of the SBM model for particular plants using the percentages. U.S.
The performances of the facilities are evaluated on annual industrial data and the input excesses and shortfalls leading inefficiencies are determined. By observ-ing input excesses in Table 5, the most input excess is observed in the production input with values of 5033787.4; 2969957.6; 11983096; 27830925; 499984.31; 2137188.3 respectively for plant 1, 2, 4, 5, 6 and 9. These show that the capacity utilization in terms of that input requires more effort to be improved.
Table 3. Selected variables of 12 DMUs with their efficiency evaluation
D M U (I) P ro d u ct io n [t o n s] (I) To ta l el ec tr ic it y [U S $ ] (I) To ta l g as [U S $ ] (I) El ec tr ic it y co n su mp ti o n [k W h ] (I) Gas co n su mp ti o n [M M B TU ] (O ) P o te n ti al el ec tr ic it y est imat ed sa v in g s (O ) El ec tr ic it y sav in g [ k W h ] (O) G as sa v in g [M M B TU ] S B M S co re (o v er al l ef fi ci en cy ) R an k 1 5036762 130407 13014 1033826 1671 6575 47576 227 0.131 11 2 2971690 90822 4764 760480 529 2440 24201 119 0.136 10 3 20000000 258690 23004 3346231 3339 136240 1510567 -14147 1 1 4 12000000 970272 57713 10023119 7465 62706 528695 1915 0.195 8 5 27913794 958492 474635 8451840 105000 174190 1822680 7406 0.386 7 6 500000 75136 12918 665920 1407 4463 34352 13 0.100 12 7 130000 844098 993745 8270143 199739 327614 2276631 1365 1 1 8 4267200 509979 258082 5508246 47159 143338 1823072 8533 1 1 9 2200000 1298194 648492 18764077 93744 65690 1067780 4805 0.153 9 1 0 85000000 226690 47313 2562672 6001 123858 2384967 321 1 1 1 1 500000 598531 121134 5491116 17207 56672 333925 17207 1 1 1 2 300 291361 14578 2262900 1715 85354 661739 1715 1 1
Considering input excess the biggest value for the plant 9 can decrease its slack in total electricity. Regarding the input excesses in terms of total gas cost it reach-es the greatreach-est value of 415806.7 in plant 5, where in terms of gas consumption plant 5 also represents the biggest value. The average input excess value of 2182660.3 in the input electricity consumption becomes 8070183.2 and 14570351 for plants 4 and 9 respectively. DMU 9 depicts most output shortage of potential electricity estimated savings compared with the output shortage of DMU 5 and DMU 4, while DMU 2 is the smallest value (728.39). DMU 6 shows output short-age of gas saving before and after when it gets zero values for the following DMUs. Plants 1 shows most output shortfall of electricity savings after when it gets zero values until reaches a value corresponding to the plant 6. Then zero values occurs again for the rest of plants. Gas savings is lacking of output shortage except
for the plant 6 which gets the highest value of 76.67 (above average shortage score). Considering of shortage output, potential electricity estimated savings be-came very painful for the plants 2, 4, 5, 9 whereas the rest ones get zero values in terms of efficiencies.
Fig. 2. a) Efficiency scores of the SBM model for individual plants; b) Descending
effi-ciency scores of the SBM model for particular plants
Table 4. Inefficiency slacks from dynamic SBM model
Excess Excess Excess Excess Excess Shortage Shortage Shortage
DMU Production Total electricity cost Total gas cost Electricity consum. Gas consum. Potential electricity estimated savings Electricity saving Gas saving S-(1) S-(2) S-(3) S-(4) S-(5) S+(1) S+(2) S+(3) 1 5033787.40 105570.70 11232.84 835955.5 1444 0 2776.46 0 2 2969957.60 78611.44 3839.01 662743.21 410 728.39 0 0 3 0 0 0 0 0 0 0 0 4 11983096 722437.20 42272.76 8070183.20 5550 5940.84 0 0 5 27830925 81865.18 415806.70 1505093.10 97594 63139.66 0 0 6 499984.31 59901.28 12155.74 547597.22 1317.33 0 249.09 76.67 7 0 0 0 0 0 0 0 0 8 0 0 0 0 0 0 0 0 9 2137188.30 771755.2 610781.70 14570351 88939 73732.89 0 0 10 0 0 0 0 0 0 0 0 11 0 0 0 0 0 0 0 0 12 0 0 0 0 0 0 0 0 Average 4204578.2 151678.4 91340.73 2182660.3 16271.19 11961.81 252.13 6.39
The output shortfall is the smallest for the plant 6 in terms of gas savings com-pared with electricity savings. With regards to input excess the biggest value for the plant 9 can decrease its slack in total electricity.
Regarding the input excesses in terms of total gas cost it reaches the greatest value of 415806.7 in plant 5, where in terms of gas consumption plant 5 also repre-sents the biggest value. The average input excess value of 2182660.3 in the input electricity consumption becomes 8070183.2 and 14570351 for plants 4 and 9 re-spectively.
Table 5. Energy efficiency evaluation in terms of the suggested recommendations
DM U P ro p o se d t ec h n ic al re co m me n d at io n s (I )To ta l in v es t-men t/ Im p le me n ta ti o n c o st U S [$ ] (O )P o te n ti al e le c-tr ic it y est imat ed sa v in g s [U S $ /y r] ( O )El ec tr ic it y sav in g [ K w h /y r] (O )G as sa v in g [M M B TU /y r] S co re R an k 1 Install a cogeneration system 1383250 737517.2 9229081 -28838.4 2.05009814808607E -04 10
2 Replace Electric Heaters
with Natural Gas boilers 94400 89276 1146670 -5500
1.08028307696926E
-02 9
3 Duct outside air to
com-pressor intakes 12850 20451 244774.4 0 0.245554003154489 7
4 Use gas heaters instead of
electric heaters 600 945 10738 0 0.405557642260854 4
5 Lower steam operating pressure 10000 0 0 3167.52 0.354437550156172 6
6 Install high efficiency
lighting 111390 42629 382739 0
2.56729479208925E
-02 8
7 Install Insulation on
Con-densate Return Pipes 3000 0 0 860 0.398655755870139 5
8
Reduce compressor set point pressure in com-pressed air system
2700 11423 163022 0 1 1
9 Recover air compressor
waste heat 1000 0 0 333.84 1 1
10 Install variable speed drive
(VSD) pumps 7300 30355 490846.62 0 1 1
The same procedure like described in the section 2.2.3 and 2.2.4 is carried out for the suggested technical recommendations for the considered plants. Similarly, energy efficiency is calculated as shown in Table 5, which is the results of model (2). Inputs and outputs are selected from five variables; (x1) investment cost (x2) potential electricity and (x3) gas cost savings, (x4) electricity savings, (x5) gas savings (full model). The reduced model includes the variables; x1; x2; x4, x5 as predictors. From this output, it is seen that SSE(full) = 1.98155E+09, with df = 6, and MSE(full) = 3.30258E+08. Thus, this test statistic comes from F3,6 distribu-tion, of which the associated p-value is 0.66 (P (F<= 1.39)). The largest potential
for energy efficiency improvements is in in reduction compressor set point pres-sure, recovering air compressor waste heat and installation of VSD, with a value of equal to 1.
The results show that the obtained overall efficiency measures are much less (< 1) for the following plants (1, 2, 4, 5, 6, 9) than those corresponding to energy au-dits outcomes in efficiency and technology recommended, where energy auau-dits solutions were considered as efficient ones (score 1). The proposed approach has also shown that not all processes of a DMU are efficient besides a DMU is efficient itself. The DEA-SBM analysis also helps identify possible directions to improve the inefficient DMUs. Thus, this can be the basis for policy-makers to promote the development of these DMU's.
3. CONCLUSION
The paper identifies six inefficient industrial plants, which were considered as efficient ones in previous research relying on performing energy audits. Based on the SBM-DEA results, it can be seen that plants 3, 7, 8, 10, 11, 12 may be regarded as efficient DMUs. These efficient plants can serve as a benchmark for other plants. It also can be seen that the efficiency scores of these six mentioned plants are much higher than the non-efficient plants (1, 2, 4, 5, 6, 9). Estimation of the efficiency across plants indicates that the inefficient plants suffer from poor per-formance. Given the above findings, it seems necessary to make a serious effort for the efficiency improvement of the energy efficiency for these plants. The fact that the greatest energy efficiency improvement potential in this data is found in sup-port processes even for manufacturing firms does not necessarily reflect the “true potential” but could be a reflection of the knowledge and expertise of the energy auditors who has conducted the audits. Therefore, the results of this study indicate the need to develop in-depth research in energy-savings recommendations for im-proving energy efficiency.
A few limitations of this study should be noted because of the quality of the da-ta which may conda-tain errors on multiple level. Dada-ta was derived from energy audits conducted, and these audits may have measurement errors. On the other hand, data related to potential cost and energy saving in terms of different processes was ag-gregated and thus may have a worse quality. Additionally, a 3-step process to se-lect criteria seems to be elementary but has the potential to become usefulness if combined with the other making decision methods, thus that could offer benefits for more intensive energy efficiency improvement.
REFERENCES
Alhourani F. & Saxena U. (2009), Factors affecting the implementation rates of energy and productivity recommendations in small and medium sized companies, Journal of Manufacturing Systems, Vol. 28, pp. 41–45.
Anderson S.T. & Newell R.G. (2004), Information programs for technology adoption: the case of energy- efficiency audits, Resource and Energy Economics, Vol. 26, pp. 27–50. Charnes A., Cooper W.W. & Rhodes E. (1981), Evaluating program and managerial
efficiency: an application of data envelopment analysis to program follow through, Management Science, Vol. 6, pp. 668–697.
Daraio C. & Simar L. (2007), Advanced Robust and nonparametric methods in efficiency analysis, Methodology and applications, Studies in Productivity and Efficiency, Science+Business Media, LLC, New York.
Duzakin E. & Duzakin H. (2007), Measuring the performance of manufacturing firms with super slacks based model of data envelopment analysis: An application of 500 major industrial enterprises in Turkey, European Journal of Operational Research, Vol. 182, pp. 1412–1432.
Grösche P. (2008), Measuring Residential Energy Efficiency Improvements with DEA, Ruhr Economic Paper No. 60, http://dx.doi.org/10.2139/ssrn.1280878, 05-08-2016. Lovell C.A.K. (1993), Production Frontiers and Productive Efficiency, H.O. Fried, S.S.
Schmidt (Eds.), The Measurement of Productive Efficiency: Techniques and Applica-tions, University Press, Oxford, pp. 3–67.
Lozano S. (2015), Alternative SBM model for Network DEA, Computers & Industrial En-gineering, Vol. 82, pp. 33–40.
Moritaa H., Hirokawa K. & Zhu J. (2005), A slack-based measure of efficiency in context – dependent data envelopment analysis, Omega, Vol. 33, pp. 357–362.
Moritaa H. & Avkiran N.K. (2009), Selecting input and outputs in Data Envelopment Analysis by designing statistical experiments, Journal of the Operations Research society of Japan, Vol. 52, No. 2, pp. 163–73.
Noro M. & Lazzarin R.M. (2014), Energy audit experiences in foundries, International Journal of Energy Environment and Energy, Vol. 2014, pp. 1–15.
Onüt S. & Soner, S. (2007), Analysis of energy use and efficiency in Turkish manufacturing sector SMEs, Energy Conversation and Management, Vol. 48, pp. 384–394.
Saidur R. & Mekhilef S. (2010), Energy use, energy savings and emission analysis in the Malysian rubber producing industry, Applied Energy, Vol. 87, pp. 2746–2758. Saricam C. & Erdumlu N., (2012), Evaluating efficiency levels comparatively: data
envelo-pment analysis application for Turkish textile and apparel industry, Journal of Industrial Engineering and Management, Vol. 5, No. 2, pp. 518–531.
Thanassoulis E. (2003), Introduction to the theory and application of Data Envelopment Analysis, Springer Science & Business, New York.
Thollander P., Backlund S., Trianni A. & Cagno E. (2013), Beyond barriers – A case study on driving forces for improved energy efficiency in the foundry industries in Finland, France, Germany, Italy, Poland, Spain, and Sweden, Applied Energy, Vol. 111, pp. 636–643.
Tone K. (2002), A slack-based measure of efficiency in data envelopment analysis, Euro-pean Journal of Operational Research, Vol. 130, No. 3, pp. 498–509.
Xue X., Wu H., Zhang X., Dai J. & Su C. (2015), Measuring energy consumption efficien-cy of the construction, Journal of Cleaner Production, Vol. 107, pp. 509–515. Yingjian L., Jiezhi L., Qi Q. &Yafei X. (2010), Energy auditing and energy conservation
potential for glass works, Applied Energy, Vol. 87, No. 8, pp. 2438–2446.
Zaim O. (2004), Measuring environmental performance of state manufacturing through changes in pollution intensities: a DEA framework, Ecological Economics, Vol. 48, pp. 37–47.
BIOGRAPHICAL NOTES
Aldona Kluczek is an Assistant Professor in the Faculty of Production
En-gineering at Warsaw University of Technology. She teaches courses on operations research, production and operations management, project and innovation management, quality engineering and management. Her research interests include sustainable manufacturing including sustainability technology assessments. Her latest multi-disciplinary research interests lie in the field of energy efficiency analysis. This covers a wide range of sciences from manufacturing, thermodyna-mics, economics and optimization. As a visiting research scientist at University of Michigan she performed energy audits at industrial plants in various industries throughout the state of Michigan. Her paper appear in numerous journals including Journal of Cleaner Production, Management and Production Engineering Review, Environmental Engineering and Management Journal.