TRENDS
in
Sport Sciences
2016; 4(23): 177-183 ISSN 2299-9590 Received: 30 August 2016 Accepted: 12 November 2016Corresponding author: ricfer@fade.up.pt
1 University of Porto, Department of Physiology and Cardiothoracic Surgery, Porto, Portugal
2 University of Porto, Centre of Research, Education, Innovation and Intervention in Sport, Porto, Portugal
3 University of Porto, Porto Biomechanics Laboratory, LABIOMEP, Porto, Portugal
JOÃO ALMEIDA-COELHO1, 2, RICARDO J. FERNANDES2, 3, JOÃO PAULO VILAS-BOAS2, 3
Metabolic and technical changes in swimmers during a 100-m
all-out front crawl
What is already known on this topic?
Training control and swimmers’ evaluation play an important role in increasing training efficiency and developing swimmers’ performance. However, short-duration high-intensity swimming events are rarely analyzed, most likely due to the difficulty of assessing anaerobic related parameters in ecological conditions, i.e., swimming freely in a swimming pool. The blood lactate increasing speed methodology, proposed almost 40 years ago, allows overcoming this problem, permitting evaluating the glycolytic contribution (measurements of net lactate accumulation in the blood) during swimming.
Introduction
I
t has been commonly accepted that physiological training control and advice play a decisive role in competitive swimming, providing coaches with useful information for achieving higher training efficiency byAbstract
Introduction. Swimming performance depends on the swimmer’s
capacity to generate mechanical power and resist fatigue. As short intense exercise (up to 1 min in duration) depends heavily on anaerobic energy release, glycolytic contribution seems fundamental for performing the 50 m and 100 m swimming events. Swimming velocity is also highly dependent on swimmers’ technique, which could be assessed with stroke frequency (SR) and stroke length (SL). Aim of Study. The study aimed to analyse changes of metabolic and technical parameters in swimmers performing a maximal 100-m all-out front crawl.
Material and Methods. Seven well-trained male swimmers (51.79 + 1.1 s at 100 m freestyle), performed an 100-m all-out front crawl, with intermediate velocity, SR, and SL assessed at each 25 m of the covered test distance. To estimate changes in blood lactate concentrations ([La–]), the blood lactate increasing speed
(BLIS) methodology was used, with swimmers performing 25, 50 and 75 m front crawl bouts (controlled with a visual pacer) at the previously assessed velocities in each split of the 100 m test. [La–] were assessed before and immediately after each trial
(until reaching the peak [La–]), with BLIS determined with the
time rate of net [La–] per split. SR and SL were assessed using
a video camera and a chronometer. Means and SD, Spearman’s rank correlation coefficient and ANOVA for repeated measures were used (p < 0.05) for statistical analysis. Results. The average velocity of the 100 m test was 1.89 ± 0.15 m·s–1, decreasing
during the first three laps (and increasing in the last 25 m), concurrently with an increase in SR and a decrease in SL. [La–]
increased throughout the test (to 15.01 ± 1.42 mmol·l–1), and
BLIS diminished during the first three laps, while increasing during the last one. Conclusions. Glycolytic power determines the first 25 m lap of a maximal 100 m front crawl effort, causing fatigue effects measured with simple biomechanical parameters. A volitive effect of metabolic pathways can be observed in the last 25 m.
KEYWORDS: physiology, biomechanics, swimming, lactate, stroke rate, stroke length.
their swimmers. From the physiological standpoint, swimming is an anaerobic sport since 50% of the world records are below 55 s (rising to 77.5% if the 200 m events are included) up to 2 min in duration, which requires substantial glycolytic support [1, 2]. During these short duration high intensity events significant utilization of stored phosphagens (ATP and phosphocreatine) occurs, leading to a substantial metabolic and ionic perturbation in the contracting skeletal muscle, and to a rapid onset and pronounced degree of muscular fatigue evidenced by a decline in power output [3].
Conversely to aerobic swimming evaluation, based on commonly used valid tests for assessing aerobic capacity and power [4, 5], studies that aim to assess the anaerobic contribution to specific swimming efforts are not so abundant. In fact, in individual and cyclic sports (particularly in running and cycling), the anaerobic component of exercise has been usually assessed with the Wingate test and measurements of blood lactate concentrations ([La–]) and, less frequently, by oxygen
deficit values [1]. However, this methodology is rather difficult to implement in the water environment and is rather unspecific of swimmers’ efforts.
To overcome the aforementioned constraints, the blood lactate increasing speed (BLIS) methodology was proposed in the late 1970s, to be conducted in swimming pool conditions [6]. Few researchers, however, implemented this methodology, e.g. in 100 m and 400 m front crawl [7, 8] and in 200 m butterfly events [9] were the only events studied. Assuming that the [La–]
removal mechanisms remain unchanged throughout swimming events, as well as immediately after the end of swimming exercise [6], BLIS can be accepted as a qualitative measure of a swimming effort [7] since it relies on [La–] net, i.e., the ratio between [La–] level
at a specific split and the time needed to accomplish that swimming distance [10]. Hence, the variability of BLIS expresses the values of lactate release from active muscles.
Technical efficiency has been frequently presented as one of the most important determinants of swimming performance [11]. Since swimming velocity depends both on swimmers’ stroke rate (SR) and distance travelled per cycle, i.e. stroke length (SL), it is widely accepted that the improvement of stroke technique results from the enhancement of propulsion effectiveness and the decrease of resistive forces, resulting in higher SL values. The purpose of the present study was to analyse changes in metabolic and technical parameters during a maximal 100 m front crawl effort, assessed using BLIS and general biomechanical parameters (SR and SL), as well
as the stroke index (SI) – a valid indicator of swimming efficiency [12]. In addition, the study aimed to examine relationships between the above-referred variables. It is hypothesized that swimmers are not able to maintain their SL throughout a 100 m front crawl effort, and that their ability to increase SR to maintain velocity is related to an increase of anaerobic energy output.
Material and Methods Subjects
Seven well-trained male front crawl swimmers volunteered to participate in the study and signed an informed consent form. Their main body and performance characteristics were (mean ± SD): 17.3 ± ± 1.5 years of age, 74.9 ± 6.54 kg of body mass, 185.9 ± ± 0.07 cm of body height, 10.5 ± 3.0% of fat mass, and 51.69 ± 1.5 s as their personal best at the 100 m freestyle event. All participants carried out eight training units a week, and their training volume was higher than 18 hours. The body characteristics assessment was conducted before the beginning of the experimental protocol, with body mass and fat mass measured using the bioelectric impedance analysis method (Tanita TBF 305, Tokyo, Japan).
Design
All tests were conducted in a 25 m swimming pool immediately after the national championships, i.e., in the beginning of the transition period of the training cycle. Each swimmer performed a 100 m all-out front crawl simulating a competitive event, during which the time and SR were recorded at each 25 m length. The next three tests were conducted based on the results of the 100 m all-out test: after 1 hour of active recovery swimmers carried out a 25 m front crawl bout at the previously assessed velocity, and, 24 h later they performed 50 m and a 75 m paced front crawl tests at the split velocities assessed previously (with a rest period of 8 hours between bouts). A visual light pacer (TAR 1.1, GBK-EIectronics, Aveiro, Portugal), placed on the bottom of the pool, with flashes every 5 m, was programmed with the velocity split values of the 100 m all-out front crawl event to give the swimmer the exact rhythm for each split distance. Table 1 shows that no differences were found between the partials of the 100 m all-out test and the posterior 25, 50 and 75 m simulations. In addition, to validate the 25, 50 and 75 m bouts as reliable reproductions of the 100 m all-out bout, it was ensured that each swimmer had similar [La–] rest values prior to each test. Furthermore, SR
was controlled at each length to be identical to the ones assessed during the 100 m test. The order of the tests was not randomized.
Data collection
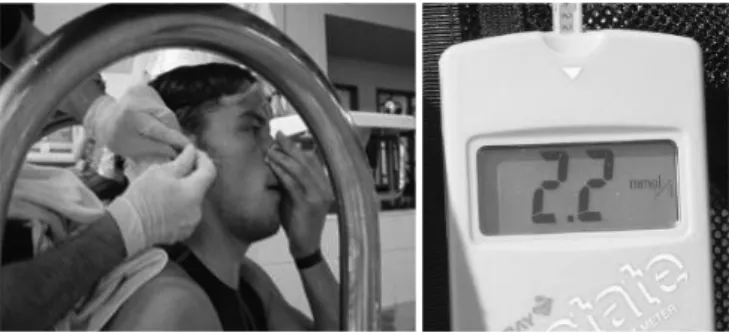
Blood samples were collected from the ear lobe to assess [La–] levels before, immediately after and, every
2 min after the end of each test (Lactate Pro, Arkay, Inc, Kyoto, Japan; Figure 1), i.e., during the recovery period. The [La–] assessment ended when the corresponding
value decreased in relation to the previous one. SR and SL were assessed for each 25 m length with a video camera (Sony® DCR-HC42E 1/250 digital shutter)
situated on the frontal swimming pool wall. Time was directly measured by an experienced operator using a chronometer (Seiko base 3 chronofrequencemeter), and velocity measurements were attained by the ratio between distance and time. To guarantee the most precise estimation of SL, its calculation was based on speed and SR measurements from each 25 m length of the pool, which was then averaged [11]. SI was calculated according to the equation: SI = V × SR, where SI is the stroke index, V – the velocity (m·s–1)
and SR – the stroke rate (cycle·min–1).
Statistical Analysis
Results were presented as mean ± SD. Differences in-between variables measured at the end of each test were calculated using the Wilcoxon test. Spearman’s rank correlation coefficient was used for analysing the
relationships between studied variables, and repeated measures ANOVA allowed comparing performances between the 100 m all-out test partials and the 25, 50 and 75 m simulations. The level of significance was set at p < 0.05.
Results
The average velocity of the all-out 100 m front crawl ranged approximately between 1.70 and 2.00 m·s–1,
decreasing during the three first laps of the test and rising in the last 25 m (Table 2). As for general biomechanical parameters along the maximum effort, a tendency for SR to rise (statistically significance from the 75 to the 100 m partials) and SL to decrease was observed, with these parameters being inversely related (r = –0.98; p < 0.01). SI also decreased along the 100 m test, with a more pronounced decline from the first to the second 25 m partials.
Swimmers had an average value of 0.99 ± 0.19 mmol·l–1
of [La–] at rest, which accumulated throughout the 100
m front crawl event, reaching 15.01 ± 1.42 mmol·l–1 at
the end of the exercise. Net [La–] tended to decrease
in the first three laps of the 100 m test (although only statistically relevant from the 50 to the 75 m laps), rising in the last 25 m lap. Accordingly, BLIS diminished during the first three laps and increased during the last 25 m partial. The observed differences in velocity and BLIS in-between the first and second 25 m laps, and the third and fourth 25 m splits, were directly related (r = 0.78 and r = 0.77, p < 0.05, respectively).
Discussion
The purpose of this study was to assess the kinetics of glycolytic and biomechanical markers during a 100 m front crawl (probably the most popular of all competitive swimming events [13]), particularly by observing the changes in velocity, SR, SL, SI, [La–] and BLIS.
The main findings were that: (i) swimming velocity decreased during the first 75 m and increased in the last 25 m lap, concurrently with a general increase in SR rise and decrease in SL; (ii) swimming efficiency, assessed by SI, declined along the all-out 100 m; (iii) [La–]
Figure 1. Blood collection from the ear lobe and blood lactate
concentration (left and right panels, respectively)
Table 1. Comparison between swimming performance at 100 m front-crawl partials and the 25, 50 and 75 m simulations Distance 100 m all-out (s) 25 m simulation
(s) 50 m simulation (s) 75 m simulation (s) Chi-square p 25 m 11.85 ± 0.28 11.98 ± 0.23 11.97 ± 0.27 12.07 ± 0.36 3.171 0.366 50 m 25.35 ± 0.58 – 25.25 ± 0.36 25.26 ± 0.55 2.571 0.276 75 m 39.33 ± 0.7 – – 39.56 ± 0.66 0.143 0.705
increased throughout the test, reaching maximal values typical of extreme intensity exercise where glycolysis makes a fundamental contribution to energy delivery to working muscle; and (iv) BLIS diminished in the first three laps, and increased in the last one, confirming the high participation of the anaerobic energy system in the beginning and at the end of the 100 m all-out front crawl.
It is commonly accepted that increased swimming efficiency reduces energy expenditure, which is why swimmers’ technique is a very relevant determinant of swimming economy [2, 14, 15]. This fact justifies the use of a biophysical approach (combination of physiological and biomechanical areas of expertise) when conducting training control and monitoring swimmers’ performance, even if only general biomechanical parameters are used for swimming technique assessment. In sprint events, such as the 100 m front crawl, SL has been identified as one the of the most important determinants of swimming velocity [16], allowing distinguishing between high- and low-level swimmers [12, 16, 17, 18]. However, higher velocities in short distance swimming events are also related to high SR values [16, 17, 19], with swimmers’ performance correlated positively with SR and negatively with SL [18].
In the current study, SR was relatively constant in the first 75 m and rose sharply in the last 25 m partial, while SL decreased progressively along the exercise. The SL decrease until the 75 m mark seems not to be due to an increase in SR (since it remained stable), but rather to technical modifications, indicating swimmers’ adaptation to physiological strain [8]. Throughout the 100 m all-out front crawl, SL and SR were inversely correlated, as described before [16, 19-21], with their combination being highly individualized [15, 17]. In fact, it was already observed that higher SR values do not allow swimmers to develop high SL, showing a high inter-dependence between these parameters, so that swimmers with higher SR display lower SL and vice versa [22]. Thus, it seems that during high intensity swimming events, a decrease in SL is inevitable, regardless of the competitor’s level and, consequently, in order to maintain high velocities, swimmers increase SR to compensate for the decrease in SL [9].
Moreover, swimming velocity declined along the extreme intensity effort, in accordance with literature data [14, 23], which seems to be a normal pattern of behaviour independent of swimmers’ level [14]. This decline in swimming velocity during the race, and the consequent changes in the combination of SR and SL,
Table 2. Mean ± SD values for metabolic and technical parameters during a 100 m all-out front crawl using the 25, 50 and 75
m test simulations to obtain values for each 25 m partial
Parameters First 25 m lap Second 25 m lap Third 25 m lap Fourth 25 m lap 100 m all-out v (m·s–1) 2.15 ± 0.05 1.97 ± 0.04** 1.81 ± 0.03* 1.90 ± 0.03* 1.89 ± 0.15 ∆v (m·s–1) – –0.26 ± 0.03 –0.06 ±0.04 0.01 ± 0.06 SR (cycle·min–1) 0.61 ± 0.04 0.60 ± 0.03 0.63 ± 0.03 0.68 ± 0.04* 0.63 ± 0.03 ∆SR (cycle·min–1) – –0.01 ± 0.02 0.03 ± 0.03 0.05 ± 0.04 SL (m·cycle–1) 3.47 ± 0.18 3.08 ± 0.13* 2.85 ± 0.14* 2.68 ± 0.13* 3.02 ± 0.34 ∆SL (m·cycle–1) – –0.40 ± 0.09 –0.23 ± 0.17 –0.17 ± 0.14 SI [m2·(cycle·s–1)] 7.33 ± 0.34 5.69 ± 0.26** 5.10 ± 0.20* 4.83 ± 0.29* 5.74 ± 1.12 ∆SI [m2·(cycle·s–1)] – –1.64 ± 0.21 –0.59 ± 0.37 –0.27 ± 0.32 [La–] (mmol·l–1) 4.61 ± 1.41** 7.60 ± 1.43** 9.37 ± 2.15* 15.01 ± 1.42** 15.01 ± 1.42
[La ]net (mmol·l–1) 3.44 ± 1.43 2.99 ± 1.48 1.77 ± 1.01* 5.64 ± 1.52** 3.46 ± 1.62
BLIS [(mmol·l–1)·s–1] 0.29 ± 0.12 0.22 ± 0.11 0.13 ± 0.07* 0.41 ± 0.11**
∆BLIS [(mmol·l–1)·s–1] – –0.07 ± 0.20 –0.10 ± 0.13 0.28 ± 0.16
Note: velocity (v), stroke rate (SR), stroke length (SL), stroke index (SI), differences in these parameters between a partial and the previous one (∆v, ∆SL, ∆BLIS, ∆SR and ∆SI), blood lactate concentrations ([La–]), lactatemia net ([La–]
net) and blood
lactate increase speed (BLIS). Differences between a specific partial and the previous one are given by * and ** (p ≤ 0.05 and
reflect the development of fatigue, i.e. reduction in power output. Indeed, a ~24% decrease in mechanical power output during a 100 m all-out front crawl had been previously observed, leading to a decrease in swimming velocity [23]. This could be explained by the fact that short duration all-out efforts presuppose a faster start that necessarily decreases throughout the exercise time, implying lower pacing strategy possibilities compared to longer competitive swimming distances [17]. In the current study, even though the participants were instructed to perform an all-out exercise, it is possible that swimmers with sprint and middle distance characteristics could have adopted different tactics, leading to a rise in velocity in the last 25 m lap.
Some earlier studies also showed that in predominantly anaerobic swimming exercises (above the anaerobic threshold), the SL reduction was progressively greater probably due to peripheral fatigue [15]. When velocity increases up to maximum levels, swimmers try to maintain their pace by increasing SR (a highly individual component depending primarily on anthropometric and muscular characteristics [21]) and, simultaneously, trying to resist SL shortening. This reduction would be connected to the metabolic acidosis accumulation, whereas an SR increase would primarily be determined by the ability to maintain adequate neural activation. In addition, SI decreased in all partials during the 100 m, most visibly from the first to the second 25 lap, probably due to the start effect. Its decrease in the swimming event, which represents extreme exercise performance more effectively, indicates the importance of performing with high SR, underlining the significance of this parameter in force generation and power production [14, 23], and maintaining stroke technique quality at the end of the race, when neuromuscular fatigue kicks in [2, 15].
Lactate is the end product of anaerobic metabolism, diffusing from the muscle cell into the bloodstream when aerobic and other metabolic pathways are unable to keep up with the removal of pyruvate. As there is no possibility of collecting blood during swimming, [La–]
has been traditionally assessed during the recovery period. Therefore, almost 40 years ago, an attempt was made to overcome this constraint by conducting simulated events at the pace of a test selected partials, obtaining [La–] increments along the total bout [6]. This
blood lactate increasing speed method is used as an indirect indicator of [La–] kinetics during swimming [7]
and, it ensures that the simulated bouts were conducted with sufficient time intervals, so the installed fatigue does not influence the posterior exertions [6] as it can traduce the swimming effort quality [7]. It is a very
useful method since it allows expressing the rate of lactate released from active muscles during swimming, allowing more accurately assessment of performance influencing parameters, as the energy cost of swimming [2, 14].
Even with some restrictions [1] the accumulation of metabolites (e.g. lactate) can be used to assess the anaerobic energy contribution. The lactate production is an inexorable reality of glycolytic activation, and multiple factors interfere with the production, diffusion, and oxidation process[24]. Even though some authors noted that muscle acidosis had little effect in fatigue establishment, high H+ concentrations could act directly
through glycolytic inhibition, or by increasing the deprotonated form of inorganic phosphate [25]. Muscle lactate accumulation during intense exercise depends both on a much superior maximal rate of glycolysis in contrast to oxidative phosphorylation, and on a faster “turn-on” of glycolysis at exercise onset. A high activity of lactate dehydrogenase, a progressive elevation of sympathoadrenal activity, and the added recruitment of fast motor units are also significant.
The peak [La–] values attained in the current study are
in line with data from other studies on 100 m swimming efforts (e.g. [26]), although higher than the 11.84 ± 2.38 mmol·l–1 found after a 100 m freestyle race
during a formal competitive event [27] and in testing conditions [7], suggesting a very high exercise intensity and, concomitantly, an evident anaerobic dependence. Important and profound training-induced alterations such as lactate transport, gluconeogenic capacity and the amount of lactate dehydrogenase fractions can explain this difference [28], as swimmers who are better trained for aerobic distances produce and accumulate less [La–] than sprinters. This is an important training
adaptation since typical long distance swimming events (800 m and 1500 m freestyle) involve significantly lower maximal [La–] values than sprint races [26, 27].
In fact, anaerobic training induces biochemical and morphological adaptations (predominant expression of fast twitch fibres, high activity of glycolytic enzymes and lactate dehydrogenase muscular isoenzyme [29]) leading to the accumulation of higher maximal [La–]
values.
Net [La–] features major changes in the second half of
the 100 m all-out, decreasing in the third 25 m lap, and rising significantly in the last 25 m lap, which is contrary to results of a previous study on the same swimming distance that revealed higher values in the first 25 m [7]. This could be explained by the highest maximal [La–] values in the final part of the exercise, probably
related to motivational factors since, physiologically, swimmers were more stressed. Complementarily, and unlike Vilas-Boas and Duarte [7], BLIS was higher in the first and fourth 25 m partials, although in both studies a decrease was observed in the middle partials of the race, indicating a progressive decrease in glycolytic power and a volitive effect of the energetic pathways during the last 25 m lap. The disagreement between studies may be justified by different overall performance time and the age and sex of the study sample, and even by the fact that a different generation of blood lactate measuring apparatus was used. It should not be excluded that swimmers in both studies might have chosen different strategies during the 100 m front crawl event.
Conclusions
Training regimes for top level swimmers often emphasize “lactic acid training”, i.e. training protocols inducing high maximal [La–] levels. An effect of this
training type may be learning to cope with the acidosis-induced discomfort without losing pace and technique, and getting the maximum effect out of muscles. We have shown that it was in first and last 25 m of the 100 m all-out front crawl that the glycolytic power was more prominent, mainly in the fourth 25 m, probably due to psychological factors. The relationship with general biomechanical parameters should be also taken into account once they represent swimmers’ overall technique, being evident of specific fatigue effects along the 100 m bout, perceptible through the incapacity of maintaining SL and the necessity of rising SR to maintain elevated swimming velocities.
References
1. Gastin PB. Energy system interaction and relative contribution during maximal exercise. Sports Med. 2001; 31(10): 725-741.
2. Figueiredo P, Zamparo P, Sousa A, Vilas-Boas JP, Fernandes RJ. An energy balance of the 200 m front crawl race. Eur J Appl Physiol. 2011; 111: 767-777. 3. Harmer AR, et al. Skeletal muscle metabolic and ionic
adaptations during intense exercise following sprint training in humans. J Appl Physiol. 2000; 89(5): 1793- -1803.
4. Fernandes R, Sousa M, Machado L, Vilas-Boas JP. Step length and individual anaerobic threshold assessment in swimming. Int J Sports Med. 2011; 32(12): 940-946. 5. Zacca R, Fernandes RJ, Pyne DB, Castro FA. Swimming
training assessment: the critical velocity and the 400-m test for age-group swimmers. J Strength Cond Res. 2016; 30(5): 1365-1372.
6. Di Prampero PE, Pendergast AM. Blood lactic acid concentrations in high velocity swimming. In: IV International Congress on Swimming Medicine. 1978. Stockholm, Sweden: University Park Press.
7. Vilas-Boas JP, Duarte JA. Blood lactate kinetics on 100 m freestyle event. In: IXth FINA International Aquatic Sports Medicine Congress, 2nd Advanced IOC Medicine Course, III Congresso Sur-Americano de Medicina Deportiva, X Congresso Brasileiro de Medicina Desportiva. 1991. Rio de Janeiro. Brazil: FINA International Aquatic Sports Medicine Congress.
8. Laffite LP, et al. Changes in physiological and stroke parameters during a maximal 400-m free swimming test in elite swimmers. Can J Appl Physiol. 2004; 29(Suppl): S17-31.
9. Ferreira M, et al. Blood lactate and ammonia kinetics along the 200 m butterfly swimming event: comparison among adult and juvenile swimmers. 1997.
10. Keskinen KL, Komi PV. A comparative study of blood lactate in swimming. Int J Sports Med. 1989; 10(3): 197- -201.
11. Huot-Marchand F, et al. Changes in stroking parameters associated with an increase in front crawl speed at high level. Hellard P, et al., editors. 2006, Atlantica: France. 12. Costill D, et al. Energy expenditure during front crawl
swimming: predicting success in middle-distance events. Int J Sports Med. 1985; 6(5): 266-270.
13. Ribeiro J, Figueiredo P, Sousa A, Monteiro J, Pelarigo J, Vilas-Boas JP, Toussaint HM, Fernandes RJ. VO2 kinetics and metabolic contributions during full and upper body extreme swimming intensity. Eur J Appl Physiol. 2015; 115: 1117-1124.
What this study adds?
Measurement of [La–] response to exercise is a
frequent component of the physiological assessment of high performance endurance swimmers. However, this parameter could be even more useful for anaerobic exercises, as it can serve as an indicator of training adaptations and help identify the optimal training stimuli and prescribe training intensities. The present study showed that BLIS decreased until the 75 m to rise significantly in the last 25 m lap of a 100 m all-out front crawl, most likely due to motivational and/ or tactical factors, and that BLIS could be understood and used as a qualitative measure of glycolytic power. Future studies should concentrate on possible differences between short-, middle- and long-distance swimmers and consider the impact of swimmers’ sex.
14. Ribeiro J, Figueiredo P, Morais S, Alves F, Toussaint H, Vilas-Boas JP, Fernandes RJ. Biomechanics, energetics and coordination during extreme swimming intensity: effect of performance level. Journal of Sports Sciences, 2016; Sep 7: 1-8 [epub ahead of print].
15. Wakayoshi K, et al. Relationship between oxygen uptake, stroke rate and swimming velocity in competitive swimming. Int J Sports Med. 1995; 16(1): 19-23. 16. Cardelli C, Chollet D, Lerda R. Analysis of the 100-m
front crawl as a function of skill level in non-expert swimmers. J Hum Mov Studies. 1999; 36: 51-74.
17. Craig AB, Jr, et al. Velocity, stroke rate, and distance per stroke during elite swimming competition. Med Sci Sports Exerc. 1985; 17(6): 625-634.
18. Arellano R, et al. Analysis of 50-, 100-, and 200-m freestyle swimmers at the 1992 Olympic Games. J Appl Biomechanics. 1994; 10: 189-199.
19. Pelayo P, et al. Stroking characteristics in freestyle swimming and relationships with anthropometric characteristics. J Appl Biomechanics. 1996; 12: 197-206. 20. Hay JG. Cycle rate, length, and speed of progression in
human locomotion. J Appl Biomechanics. 2002; 18: 257- -270.
21. Seifert L, Chollet D, Chatard JC. Kinematic changes during a 100-m front crawl: effects of performance level and gender. Med Sci Sports Exerc. 2007; 39(10): 1784-1793.
22. Kennedy P, et al. Analysis of male and female Olympic swimmers in the 100-meter events. Int J Sports Biomechanics. 1990; 6: 187-197.
23. Toussaint HM, et al. Effect of fatigue on stroking characteristics in an arms-only 100-m front-crawl race. Med Sci Sports Exerc. 2006; 38(9): 1635-1642.
24. Roecker K. Increase characteristics of the cumulated excess-CO2 and the lactate concentration during exercise. Int J Sports Med. 2000; 21: 419-423.
25. Hollidge-Horvat MG, et al. Effect of induced metabolic acidosis on human skeletal muscle metabolism during exercise. Am J Physiol. 1999; 277(4 Pt. 1): E647-658. 26. Vescovi JD, Falenchuk O, Wells G. Blood lactate
concentration and clearance in elite swimmers during competition. Int J Sports Physiol Perform. 2011; 6: 106- -117.
27. Bonifazi M, et al. Blood lactate accumulation in top level swimmers following competition. J Sports Med Phys Fitness. 1993; 33(1): 13-18.
28. Bonen A. The expression of lactate transporters (MCT1 and MCT4) in heart and muscle. Eur J Appl Physiol. 2001; 86(1): 6-11.
29. Esbjornsson M, et al. Fast twitch fibres may predict anaerobic performance in both females and males. Int J Sports Med. 1993; 14(5): 257-263.