TABU SEARCH FOR SHIPPING DANGEROUS GOODS
IN A RAIL-TRUCK NETWORK
Nicolas Zufferey* and Manish Verma**
* CIRRELT & HEC, Faculty of Economics and Social Sciences, University of Geneva, 1211 Geneva 4, Switzerland,
Email: nicolas.zufferey-hec@unige.ch
** CIRRELT & Faculty of Business Administration, Memorial University, St-John’s, Canada A1B 3X5,
Email: mverma@mun.ca
Abstract: The problem considered in this paper consists of planning and routing rail-truck intermodal shipments from a set of suppliers to a set of clients. The delivered quantities have to follow a truck-rail-truck intermodal path. There are three constraints to satisfy: the satisfaction of the demand is mandatory, each request should be delivered by its due date, and the capacity of a train cannot be exceeded. The objective function to minimize is a weighted summation of the cost and the risk. The former component concerns the fixed and variable transportation costs associated with trucks and trains, while the latter associated with dangerous goods is non-linear for trains. We propose a graph model to represent this problem and a tabu search metaheuristic to tackle it. Numerical experiments on realistic data are provided and discussed.
Paper type: Research Paper Published online: 14 October 2011
Vol. 1, No. 3, pp. 127-137 ISSN 2083-4942 (Print) ISSN 2083-4950 (Online)
© 2011 Poznan University of Technology. All rights reserved.
1. INTRODUCTION
Rail-truck intermodal transportation, involving rail-haul operation by intermod-al trains and drayage by truck, has experienced phenomenintermod-al growth since 1980 (AAR 2010). Rail-truck combination is attractive for two reasons: first, reduction in uncertainty and lead-times because a significant portion of the transport distance is covered by intermodal trains, which operate on fixed schedule and hence are quite punctual (Nozick & Morlok 1997); and, second, the ability to combine the best attributes of the two modes to yield a more efficient and cost-effective overall movement (AAR 2010). Although rail-truck intermodal transportation (IM) has been an active research area within the intermodal transportation domain (e.g., Bontekoning, Macharis & Trip (2004) and Macharis & Bontekoning (2004)), the focus has been on regular freight. Despite the increasing significance of IM in carrying hazmat, Erkut, Tjandra & Verter (2007) identified, through a comprehen-sive review of the literature on hazmat logistics, that intermodal transportation is an area that has not been well studied.
In this paper we pose the problem from the perspective of the intermodal rail-road company, which offers a door-to-door service to the customers. For example,
UMAX interline container program of CSX Intermodal and Union Pacific Railroad
was conceived to ensure seamless freight movement across different transportation modes. Although such intermodal companies are interested in minimizing cost, they are also under governmental pressure to consider transport related risk. In an effort to address the interests of these two stakeholders, we propose an objec-tive function that captures both transport risk and transport cost. The complexity of the problem structure, dictated by the characteristics of IM, necessitated the devel-opment of a metaheuristic, namely tabu search.
The remainder of this paper is organized as follows. In Section 2, we describe the problem and present a graph model for it. In Section 3, we propose a tabu search to tackle the problem. Results are given and discussed in Section 4, and the paper ends up with a conclusion.
2. PROBLEM DESCRIPTION
The considered problem is to determine the best shipment plan for both hazard-ous and regular freight in an IM network, and within customer specified delivery times. The objective is to minimize the total cost of transportation as well as the total public risk associated with hazmat. This task is complicated because the number and location of hazmat containers can vary considerably among inter-modal trains of various types, which requires the use of a rather elaborate risk as-sessment technique and prohibits the development of a closed-form expression for
the risk objective. Furthermore, it is necessary to streamline the inbound drayage, intermodal rail haul and outbound drayage activities while making the trade-off between total transportation cost and total public risk.
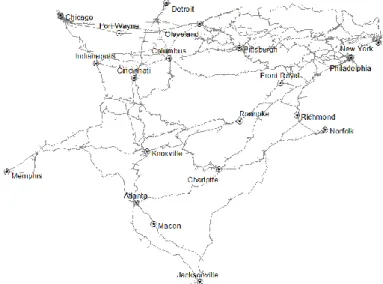
To illustrate the complexity of the problem, we outline the characteristics of the intermodal service chain of a Class 1 railroad company in the U.S. Fig. 1 de-picts the 20 intermodal terminals, and the 31 types of intermodal train services differentiated by route, and intermediate stops. These terminals are the access points for 37 shipper/receivers located in the mid-west, north-east, and south-east regions of the U.S., which were selected using the existing intermodal network in the region, and are represented via a geographical information system model using
ArcView (http://www.esri.com). Furthermore, we assume that two types of
inter-modal train services (regular and priority) are operating between each terminal pair (i.e., a total of 62 types of intermodal train service), and that the latter train type is 25% faster than the former (this approximately captures the features of
Ex-pedited and ExEx-pedited-Plus services offered by Norfolk Southern).
Fig. 1 Intermodal rail services
The considered problem can be represented with a graph model. Consider the following network G = (V, A), with vertex set V and arc set A. The vertex set V is partitioned into four subsets I, J, K and L, where a vertex i in I represents a supplier location, a vertex j in J represents an origin train station, a vertex k in K represents a destination train station, and a vertex l in L represents a client location. There are only arcs from I to J, from J to K, and from K to L. Arcs (i, j) in I x J and (k, l) in
options. The problem consists of satisfying the requests of the clients located in
L from a set of suppliers located in I. In order to ship a request r from a
suppli-er i in I to a client l in L, the following truck-train-truck intsuppli-ermodal path has to be used: i j k l (with j in J and k in K).
Since transportation from any i in I to any j in J are performed by trucks, there is only one associated arc (i, j), even if several trucks travel from i to j, which rep-resents the cheapest path from i to j. The same holds for arcs in K x L.
In contrast, if there are several trains going from a vertex j in J to a vertex k in K, then each train is represented by a different arc. In order to avoid multiple arcs from j in J to k in K, we duplicate j as many times as the number of train op-tions. A train u traveling from j to k can be denoted u = (j, k, a, c, p), where a is the arrival time at destination, c is its capacity (120 containers), and p is its type, which can be regular or priority, the latter being faster and more expensive than the former.
A demand requested by a client l to a supplier i can be denoted r = (i, l, t, d, q), where t is its type (regular or hazardous), d is the due date, and q is the number of containers in the command (up to 120 containers). The decision for each request r consists in determining a path of type i j k l, while satisfying the
con-straints and minimizing the objective function.
There are three constraints to satisfy: the satisfaction of the demand is mandato-ry, each request should be delivered by its due date, and the capacity of a train can-not be exceeded (assuming that each container needs one capacity unit on any train). We assume that at least one feasible intermodal route exists between each shipper-receiver pair. The objective function contains transport cost (C), transport risk (R), and a weight in [0, 1].
Thus, if s is a solution, then f(s) = C(s) + (1 – ) R(s). The following costs
are considered. When a container of type t (regular or hazardous) moves by the use of a transportation mode (train or truck), a travel cost is encountered. When a transportation mode is used, a fixed cost has to be paid. In contrast, a risk only occurs for hazardous containers, and is non-linear only for train transportation: anytime m hazardous containers moves on a train, a risk is encountered, which is nonlinear in m.
In the U.S., trucks can travel at a maximum speed of 50 miles/hr, but due to lights and traffic an average speed of 40 miles/hr is assumed. Normally drayage is charged in terms of the amount of time the crew (driver-truck) is engaged, and an amount of 250$/hr including the estimated hourly fuel cost is used. For exam-ple, if it takes four hours to complete inbound drayage (including travel and wait-ing time), the associated cost is 1000$. Furthermore, it is estimated that approxi-mately one hour is needed to load, unload, or transfer an intermodal container. Barton et al. (1999) estimated 140$ to be the cost of a lift at the intermodal yard, but we assume 150$ to reflect the current conditions.
There are two types of intermodal train services between each terminal pair (regular and priority), whose travel time includes two hours for loading and un-loading at every terminal they visit. Average intermodal train speed was calculated using the Railroad Performance Measure (http://www.railroadpm.org), and was estimated to be 27.7 miles/hr for regular, and 36.8 miles/hr for priority service. Although Morlok & Spasovic (1995) estimated 0.70$/mile as the intermodal rail-haul cost, a rate of 0.875$/mile has been estimated for regular and 1.164$/mile for priority service. The hourly fixed cost of running a regular intermodal train is 500$ per hour, which takes into consideration the hourly rate for a driver, an engineer, a brakeman, and an engine, which are 100$, 100$, 100$, and 200$, respectively. The priority service is 50% more expensive at 750$ per hour.
In estimating the transport risk associated with IM shipments, we use the classi-cal population exposure model of Batta & Chiu (1988) only for assessing the transport risk associated with drayage operations, whereas the Verma & Verter (2007) model is used for assessing rail-haul risk.
3. SOLUTION METHODS
In order to ship a regular request r = (i, l, t, d, q) (i.e. with t = regular), we have to search for shortest paths (it is assumed that shortest path is both the cheapest and quickest) from i to l in the network G = (V, A, w), where the vertex set V and the arc set A are defined as above, and the weight w(x, y) of arc (x, y) is the encoun-tered unit cost if r uses arc (x, y). Using the famous Dijkstra’s algorithm, and ignor-ing the arcs associated with priority trains for the moment, each regular request r is assigned to the shortest feasible path. If a shipment is late, we replace the regular train with a priority train, thereby reducing travel time but augmenting the travel cost (and keeping optimality). Note that since drayage is already being performed using the quickest link, travel time cannot be reduced by moving to any other dray-age link. The above described process is done once and for all in our general heu-ristic, and needs only a small amount of computing time (a few seconds).
The rail-haul risk objective does not have a generic closed-form expression and is nonlinear (Verma, Verter & Gendreau, 2010). This is because population expo-sure around each rail link is estimated by multiplying the length of the link, the threshold distance for the undesirable consequence of concern, and the popula-tion density in the vicinity. Given the complexity associated with rail-haul risk objective, routing hazmat containers using exact method would be both inefficient and cumbersome, especially for large scale problem instances. We choose to de-velop a tabu search. Before applying a tabu search to the considered problem, we perform the following pre-processing phase.
For each hazmat request r = (i, l, t, d, q), it is easy to generate once and for all the set F(r) which contains arcs (j, k) of J x K such that path i j k l results in an on-time delivery. In other words, only the feasible arcs will be considered.
A basic version of tabu search can be described as follows. Let f be an objective function which has to be minimized. At each step, a neighbor solution s’ is gener-ated from the current solution s by performing a specific modification on s, called a move. All solutions obtained from s by performing a move are called neighbor
solutions of s. The set of all the neighbor solutions of s is denoted A(s). First, tabu
search needs an initial solution s0 in S as input. Then, the algorithm generates
a sequence of solutions s1, s2, … such that sr+1 is in A(sr). When a move is
per-formed from sr to sr+1, the inverse of that move is forbidden (with some exceptions)
for tab (parameter) iterations, where tab is called the tabu tenure. The solution sr+1
is computed as
arg
min
(
)
) '(s
f
r s As , where A’(sr) is a subset of A(s) containing all
solu-tions s’ which can be obtained from s either by performing a move that is not for-bidden (i.e. not tabu) or such that f(s’) < f(s*), where s* is the best solution encoun-tered along the search so far. The process is stopped for example when a given amount of CPU time has elapsed. Extensions of this basic algorithm can be found for example in (Glover & Laguna, 1997).
In order to ship hazmat requests at minimum cost and risk, we mainly have to find their best assignments to the arcs in set J x K. Let s be an assignment solution of all the hazmat requests to the arcs in set J x K. If and only if s is completely known, we can compute the objective function f(s). Given a solution s, we consider the network G(s) = (V, A, w), where V and A are defined as above but, contrary to the regular case, the weight function w now depends on the considered solution s. Firstly, the weight w(x, y) of arc (x,y)(IJ)(KL) is the associated linear cost and risk. Thus, it is easy (using Dijkstra’s algorithm) to once and for all com-pute (in a preprocessing phase) the shortest paths from any i in I to any j in J and from any k in K to any l in L. Secondly, the weight w(j, k) of arc (j, k) in J x K is the linear cost and nonlinear risk (depending on s) associated with the requests using (j, k). In other words, if r = (i, l, t, d, q) will go via arc (j, k), then one can construct the complete intermodal path from shipper i to receiver l as: the shortest path from i to j; arc (j, k) with its cost and risk; and, the shortest path from k to l.
We propose the following neighborhood and tabu structures. Let s be the cur-rent solution (i.e. an assignment of the hazmat containers to the arcs in J x K). In order to generate a neighbor solution s’ from s, we propose to change the as-signment of a hazmat request r = (i, l, t, d, q), while maintaining the feasibility of the solution (i.e. we do not allow late shipments and capacity violations). More precisely, we move r from arc (j, k) to an arc (j’, k’) in F(r). Such a move can be denoted by [r; (j, k); (j’, k’)]. If such a move is performed at iteration iter, it is forbidden to reassign r to (j, k) until iteration iter + tab, where tab is defined
as follows. Let UNIF(a, b) be a function which randomly returns an integer number between a and b (inclusively). We use a dynamic way of managing the tabu ten-ures, which depends on the quality of the performed move, and, after preliminary experiments, we propose tab = UNIF(1, 10) + 5 . max{0 ; 100 [f(s) – f(s’)] / f(s)}.
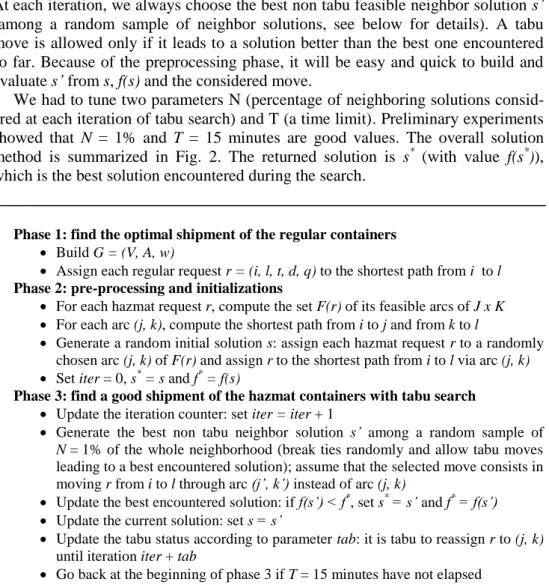
Thus, if s’ is better than s, the move is forbidden longer than if it is not the case. At each iteration, we always choose the best non tabu feasible neighbor solution s’ (among a random sample of neighbor solutions, see below for details). A tabu move is allowed only if it leads to a solution better than the best one encountered so far. Because of the preprocessing phase, it will be easy and quick to build and evaluate s’ from s, f(s) and the considered move.
We had to tune two parameters N (percentage of neighboring solutions consid-ered at each iteration of tabu search) and T (a time limit). Preliminary experiments showed that N = 1% and T = 15 minutes are good values. The overall solution method is summarized in Fig. 2. The returned solution is s* (with value f(s*)),
which is the best solution encountered during the search.
Phase 1: find the optimal shipment of the regular containers
Build G = (V, A, w)
Assign each regular request r = (i, l, t, d, q) to the shortest path from i to l
Phase 2: pre-processing and initializations
For each hazmat request r, compute the set F(r) of its feasible arcs of J x K
For each arc (j, k), compute the shortest path from i to j and from k to l
Generate a random initial solution s: assign each hazmat request r to a randomly chosen arc (j, k) of F(r) and assign r to the shortest path from i to l via arc (j, k)
Set iter = 0, s* = s and f* = f(s)
Phase 3: find a good shipment of the hazmat containers with tabu search
Update the iteration counter: set iter = iter + 1
Generate the best non tabu neighbor solution s’ among a random sample of N = 1% of the whole neighborhood (break ties randomly and allow tabu moves leading to a best encountered solution); assume that the selected move consists in moving r from i to l through arc (j’, k’) instead of arc (j, k)
Update the best encountered solution: if f(s’) < f*, set s* = s’ and f* = f(s’)
Update the current solution: set s = s’
Update the tabu status according to parameter tab: it is tabu to reassign r to (j, k) until iteration iter + tab
Go back at the beginning of phase 3 if T = 15 minutes have not elapsed
4. COMPUTATIONAL EXPERIMENTS
We first outline the remaining details for the realistic problem instance intro-duced above, and then we analyze the solution and provide some managerial in-sights. The solution methodology was coded in Python, a dynamic object-oriented programming language, to solve a total of eleven problem instances. All numerical experiments were performed on an Apple, running Mac OS X 10.5.6 and Python
2.6.1 (http://www.python.org).
Fig. 1 represent the intermodal train services of different types available for solving the realistic size problem instances. In developing the problem instances, we use hypothetical demand data which were randomly generated utilizing the fuel oil consumption figures as compiled by the Department of Energy (http://ton-to.eia.doe.gov). It is important to note that no demand can be generated between a shipper and a receiver with access to the same terminal, since such movement will just use the highway network and not a complete IM chain. Such consideration results in 1110 supply-demand pairs, and not a 37 x 36 demand matrix. In our data set, a total of 22,190 intermodal containers, including 10,965 with hazardous cargo, have to be moved. Finally, without loss of generality, we also assume that the lead-time to satisfy demand at each shipper is two days (i.e., specified delivery-lead-time of 48 hours).
We report below on a parametric analysis performed by attaching different weights to the two objectives ( will vary from 1 to 0 with 0.1 steps). The Base
Case situation (i.e. with = 0.5), obtained after 15 minutes (13 682 iterations) of CPU time, has the following properties. The total costs is 72 670 111$ (15 189 592$ rail-haul and 57 480 519$ drayage) and the total risk is 8 979 439 people (570 765 rail-haul and 8 408 674 drayage). Thus, the specified demand can be met by spending around 72.7$ million, and exposing approximately 9 million individuals. Note that a significant proportion of both cost and risk is accruing from drayage operations, which should be of interest to decision-makers. In an effort to investigate the high risk numbers, we applied the proposed methodology to eleven separate problem instances generated using the intermodal infrastructure involving only a single pair of terminals. A total of seven different intermodal train routes were created to transport 3 881 intermodal containers between the 210 shipper-receiver pairs. Drayage risk accounted for 90% – 96% of intermodal transport risk in these problem instances.
In order to ascertain the performance of the proposed tabu-search based solution methodology, we also solved the realistic size problem instances by implementing a Greedy Algorithm (GrA). GrA, a constructive heuristic, builds a solution step-by-step. Initially the solution set is empty, and then at each step an item (i.e. a request) is added to the current partial solution, such that the augmentation of the objective function is minimized, and the algorithm stops when a complete solution is built. It was noticed that on average a complete solution was built in around 12 seconds,
but to facilitate fair comparison, GrA was also allowed to run for 15 minutes (with restarts, and providing the best generated solution as output) on eleven different instances of the realistic size problem.
In Table 1, for each instance (i.e. a specific value of ), we report ftabu (the value of the best solution encountered by tabu search within 15 minutes), Δf(GrA) (the additional value of f associated with the best solution encountered by
GrA within 15 minutes), the cost and risk components of ftabu, the number of regu-lar trains used by tabu search (and, in brackets, the number of reguregu-lar trains used by GrA), the number of priority trains used by tabu search (and, in brackets, the number of priority trains used by GrA). One can conclude that tabu search is consistently superior to GrA when one gives priority to the cost attribute (i.e. larger values of ), and relatively more effective when the risk coefficient carries more weight. The myopic behavior of GrA is evident by the consistent use of a larger number of priority trains in comparison to the proposed methodology. This has enabled more time for drayage, which would explain the lower risk numbers. Table 1 Performance of tabu search
Instance ftabu Δf(GrA) Cost ($) Risk (people) Regular Priority Min Cost 71277442 575870 71277442 14888317 173 (161) 41 (66) = 0.9 65480698 373187 71455502 11707466 164 (162) 46 (65) = 0.8 59330743 402269 71462375 10804216 172 (163) 40 (61) = 0.7 53261093 259752 71671355 10303816 170 (165) 42 (63) = 0.6 47147156 239574 72231191 9521104 165 (168) 50 (67) Base Case 40824775 188182 72670111 8979439 170 (169) 49 (62) = 0.4 34374236 184471 73714081 8147672 169 (164) 48 (70) = 0.3 27734819 187716 74131896 7850358 176 (158) 41 (74) = 0.2 21074355 106541 74860098 7627919 173 (161) 44 (71) = 0.1 14302341 50809 75801586 7469092 171 (163) 57 (83) Min Risk 7436203 3815 77290002 7436203 162 (149) 87 (99)
We now give some managerial insights of our approach (according to the results obtained by tabu search). In here, we report on the parametric analysis performed by varying the weights associated with the two objectives. Each row in Table 1 represents a non-dominated solution. The Min Cost solution (i.e. with = 1) is 2% less expensive than the Base Case solution, but 65% more risky. The increment in risk is primarily stemming from forcing drayage operations through shorter but more risky paths. On the other hand the Min Risk solution (i.e. with = 0) is 6.4% more expensive, thanks to a higher number of priority trains. It should be noted that the use of faster trains has enabled taking longer but less risky paths, which in turn translated into a 17.2% risk reduction.
From Table 1 one sees that the Min Cost solution entails a cost of around $71.3 million and exposes 14.9 million people, whereas the Min Risk solution will cost $77.3 million and expose 7.44 million people. By spending an extra $6 mil-lion, it is possible to halve the population exposure risk. This may be a worthwhile trade-off for the regulators to pursue. Perhaps a more important observation is the significant increase in population exposure risk when the weight attached to the risk coefficient is decreased from 10% to 0% (i.e., from = 0.9 to = 1). This weight allocation results in a saving of around $175 K but increases exposure risk by 3 million people, which implies that every saved dollar exposes 17.4 additional individuals to hazmat risk.
5. CONCLUSION
In this paper, we present a graph model and a tabu search for planning rail-truck intermodal shipments, when shippers and receivers have access to alternate termi-nals. It is important that route-selection, and hence the formation of feasible inter-modal chain, be driven by customer specified delivery-times. Complexity of IM and the intent to exploit the problem structure motivated the development of a ta-bu-search based solution methodology, which was applied to realistic size problem instances.
This is the only work that proposes to solve the more general instance of the rail-truck intermodal transportation of dangerous goods problem first intro-duced in (Verma & Verter 2008). It is also the first application of a tabu-search based solution methodology to generate a number of non-dominated solutions, for the risk-cost frontier, that could be used for planning rail-truck intermodal tactical problems.
REFERENCES
AAR, (May 2010), "Rail intermodal keeps America moving", [in:] Association of Ameri-can Railroads – Policy and Economics Department.
Barton J. E., Selness C. L., Anderson R. J., Lindberg D. L. & Foster N. S. J., (1999), "De-veloping a proposal for a multi-user intermodal freight terminal as a public-private part-nership", [in:] Transportation Research Record, Vol. 1659, pp. 145-151.
Batta R., & Chiu S. S., (1988), "Optimal obnoxious paths on a network: transportation of hazardous materials", [in;] Operations Research, Vol. 36, No. 1, pp. 84-92.
Bontekoning Y. M., Macharis C. & Trip J. J., (2004), "Is a new applied transportation re-search field emerging? A review of intermodal rail-truck freight transport literature", [in:] Transportation Research A, Vol. 38, No. 1, pp. 1-34.
Erkut E., Tjandra S., & Verter V., (2007), "Hazardous Material Transportation", [in:] Transportation: Handbooks in Operations Research and Management Science, Elsevier, Amsterdam, pp. 539-621.
Glover F. & Laguna M., (1997), Tabu Search, Kluwer Academic Publishers, Boston. Macharis C. & Bontekoning Y. M., (2004), "Opportunities for OR in intermodal freight
transport research: a review", [in:] European Journal of Operational Research, Vol. 153, No. 2, pp. 400-416.
Morlok E. K. & Spasovic L. N., (1995), "Approaches for improving drayage in rail-truck in-termodal service", Proceedings of the 1995 Pacific Rim Transportation Conference, Seattle. Nozick L. K. & Morlok E. K., (1997), "A model for medium-term operations planning in an
intermodal rail-truck service", [in:] Transportation Research A, Vol. 31, No. 2, pp. 91-107. Verma M. & Verter V., (2007), "Railroad transportation of dangerous goods: Population
expo-sure to airborne toxins", [in:] Computers & Operations Research, Vol. 34, pp. 1287-1303. Verma M. & Verter V., (2008), "The Trade-offs in Rail-Truck Intermodal Transportation of
Hazardous Materials: An Illustrative Case Study", Advanced Technologies and Meth-odologies for Risk Management in the Global Transport of Dangerous Goods: NATO Science for Peace and Security Series, IOS Press, Vol. 45, pp. 148-168.
Verma M., Verter V. & Gendreau M., (2011), "A tactical planning model for railroad trans-portation of dangerous goods", [in:] Transtrans-portation Science, Vol. 45, No. 2, pp. 163-174.
BIOGRAPHICAL NOTES
Nicolas Zufferey is a professor of operations management at the Faculty of
Eco-nomics and Social Science of the University of Geneva in Switzerland. His research interests mainly focus on the design of metaheuristics for combinato-rial optimization problems in various fields, such as transportation, inventory man-agement, production scheduling, frequency assignment, graph coloring, etc. He is the author and co-author of numerous papers and he has had research activities with about 15 Universities in Europe and North America.
Manish Verma is a professor of operations management and management sciences
at the Faculty of Business Administration of Memorial University of Newfoundland in Canada. His research interests are in multimodal transportation of dangerous goods, risk assessment, network design and planning issues in transportation, glob-al logistics, and green supply chain management. He is the author and co-author of over twenty peer-reviewed works, some of which have appeared in leading journals such as Transportation Science, European Journal of Operational Research, Trans-portation Research E: Logistics and TransTrans-portation Review.