IMPROVING INVESTMENT EFFICIENCY BY USING
RENEWABLE ENERGY SOURCES
Tadeusz A. Grzeszczyk* and Michał Izdebski**
* Faculty of Management, Warsaw University of Technology, Narbutta 85, 02-524 Warsaw, Poland, Email: t.grzeszczyk@wz.pw.edu.pl
** Faculty of Management, Warsaw University of Technology, Narbutta 85, 02-524 Warsaw, Poland, Email: izdebo@gmail.com
Abstract. The reduction of natural resources and the ever increasing demand for energy forces research
on new energy sources. In the case of obtaining energy from non-renewable sources of energy, natural resources are used as fuel in the combustion process. This way relatively high calorific value is achieved but it is associated with the number of fundamental flaws. Among other things, this may include destruction of the environment in the vicinity of extraction of conventional fuels’ sources, emission of large amounts of harmful substances during the combustion of conventional fuels causing the pollution of natural environment and there is a danger of life or health loss for people working in the extraction of fossil fuels. The use of renewable energy sources is related to interesting investment opportunities in the energy field and there are no problems mentioned above. For these reasons, it is worthwhile to conduct research on improving investment efficiency by using new, renewable sources. Therefore, the purpose of this paper is showing the opportunities of improving efficiency of electric power investment by using renewable energy sources. This article presents a comprehensive overview of renewable technologies used to produce electricity. Then, the attention was focused on assessing the financial efficiency of wind turbines. The considerations were illustrated with the examples of calculation of financial ratios NPV and IRR for a hypothetical investment in the production of electric power using the wind farm. The calculations and analysis conducted can provide interesting basis for further research on improving electric power investment efficiency by using renewable energy sources and new comprehensive evaluation methods of such investments. Comprehensive evaluation methods should take into consideration multifaceted nature of the projects.
Paper type: Viewpoint
Published online: 31 August 2016 Vol. 6, No. 4, pp. 331–342
ISSN 2083-4942 (Print) ISSN 2083-4950 (Online)
© 2016 Poznan University of Technology. All rights reserved.
Keywords: Investment efficiency, Renewable energy sources, Project evaluation
1. INTRODUCTION
Energy is essential for production, services, trade, transport and others. Acquisi-tion of thermal or electric energy is associated with the use of various types of en-ergy sources for its production. The reduction of natural resources and the ever increasing demand for energy forces the research on new energy sources. This kind of research is also necessary for reasons connected with so-called sustainable de-velopment. Energy sources can be non-renewable (or renewable in a very long period of time) and renewable. New and unique investment opportunities in the field of energy are associated with the use of renewable energy sources. Various types of renewable sources used for electricity production include e.g. water, solar radiation, biomass and wind. The use of this type of environmentally friendly en-ergy is consistent with the basic principles of sustainable development. In this case, environmental degradation is avoided which otherwise may occur with the use of unprocessed natural resources such as e.g. coal and lignite, oil, gas, etc.
In the case of obtaining energy from non-renewable sources of energy, natural resources are used as fuel in the combustion process. Conventional fuels are char-acterized by relatively high calorific value, which gives them an advantage over renewable energy sources. However, non-renewable fuels have several fundamen-tal flaws that during their intensive exploitation influence on environmenfundamen-tal pollu-tion. The major disadvantages are e.g. progressive destruction of environment in the vicinity of conventional fuels’ extraction sources (e.g. lignite opencast mines). In addition, emission of large amount of harmful substances occurs during the combustion of conventional fuels, causing the pollution of natural environment (e.g. smog, acid rains, etc.). There is also a danger of life or health loss by the peo-ple working in the extraction of fossil fuels.
The electrical energy production by using renewable sources has big potential all over the world. In order to achieve reducing CO2 emissions this production should be realized with respect for sustainability principles and environment (Skea, Nishioka, 2008, p. 5–16). The Polish Government estimates that application of renewable energy sources during the period 2010–2020 should reach 12% (PAIZ, 2012). The use of renewable energy sources is related to interesting investment opportunities in the energy sector and the aforementioned problems are absent in
this case. For these reasons, the study focused on improving electric power invest-ment efficiency by using renewable energy sources.
The purpose of this paper is showing the opportunities of improving efficiency of electric power investment by using renewable energy sources. The article pre-sents a synthetic overview of renewable technologies used to produce electricity. Then, the attention was focused on assessing the financial efficiency of wind tur-bines. The considerations were illustrated with the examples of calculation of fi-nancial ratios NPV (Net Present Value) and IRR (Internal Rate of Return) for a hypothetical investment in the production of electric power using the wind farm.
2. RENEWABLE ENERGY TECHNOLOGIES APPLICATION FOR
ELECTRICITY GENERATION
The use of renewable sources to produce energy has been known to mankind for a long time. It is sufficient to recall the example of sailing vessels, which used to convert the energy of blowing wind into kinetic energy, thanks to which they could move through the water surface. The progress of science and modern technologies results in the development of renewable technologies used to obtain electricity or heat, increases the efficiency of energy production from these sources, as well as lowers the costs of its production. This part of the article focuses on the analysis of the most important renewable technologies for the electricity production.
2.1. Water energy
Approximately 18% of the total production of the world's electricity obtained from renewable energy sources is produced using the energy of flowing water (BP Statistical Review, 2014). The capacity of electricity production depends on the conditions of the natural environment in which hydropower plants are built – specifically, the height of the fall of the river bed and the amount of water flowing through it. The larger the decline is, the higher performance of the plant is ob-tained. Water energy industry distinguishes between the following three types of hydropower plants:
• run-of-river power plants – utilizing the differences in levels of the river-bed,
• pumped-storage hydroelectricity – so-called storage batteries of surplus production of electricity, this type of plant uses the difference in the levels of reservoirs for the storage of electricity, for example, Polish power plant Żarnowiec S.A.,
• water storage power stations–plants using artificially constructed damming of the river levels, e.g. power plants built on the artificial river dams.
2.2. Solar radiation energy
This type of renewable energy is used to produce electricity or heat. To produce electricity so-called voltaic panels are used that focus the energy contained in the sunlight and convert it into electricity. This method of energy production is very common in equatorial areas where solar radiation is the highest. In Polish condi-tions, due to a much smaller number of sunny days this way of energy production may be ineffective. Currently there is no precise data on experiments with the use of this type of energy in this climate.
Demand for solar energy and solar photovoltaic technology is growing in other countries. Installed solar technology capacity has grown worldwide from around 14 GW to 180 GW during the period 2008–2014. Global solar energy demand in-creased to 25% in 2015 (Sharma, 2015, p. 3). The possibility of the use of solar technology is highly dependent on the climate in a given local area. Research on this topic is available in (Flowers et al., 2016, pp. 264–273).
2.3. Geothermal energy
Geothermal energy is the heat energy flowing from the hot rocks or sources of geothermal waters beneath the earth's surface. Efficient energy generation from this source occurs in so-called semi- and hyperthermia areas, in which the average gra-dient of temperature can reach 80°C (Szewczyk, 2011). Acquisition of this energy is performed by deep drilling (often from 2 to 10 km under the surface of the earth), leading to the geothermal aquifers. The heated geothermal water is pumped into the heat exchangers and pumped back under the ground. In the heat exchanger using the heat transfer fluid (e.g. organic heat carriers), heated steam is used to drive electricity generators. The use of geothermal energy brings a lot of problems, including the need for desalination, or removal of harmful substances from the geothermal water (e.g. hydrogen sulphide), so that obtaining energy from this source is quite expensive, and the construction of geothermal power plant must be supported by specific environmental and economic analyses.
2.4. Biomass energy
The term biomass is understood as solid, liquid or gaseous biofuels, organic, coming from the residues from industrial, forestry and agriculture production or their waste. Biomass is a very broad concept, which also includes biogas, as well as biodegradable industrial and municipal waste. Using the biomass, heat or electric-ity is obtained in the process of combustion.
The most popular and most widely used fuel included in the concept of biomass is wood waste or selected species so-called energy crops – e.g. osier, reed or knot-weed. This is due to the fact that these are high yielding plants which have very
good growth, are resistant to harsh climatic conditions, can utilize soil classified as soils of very low agricultural productivity in addition to high contamination with harmful substances, e.g. heavy metals.
Another type of solid biomass fuel frequently used is waste of agricultural pro-duction, specifically rape, sunflower and field bean straw. These are the types of straw, which are not suitable for use as bedding material, or other agricultural ap-plications, so they are very willingly used for biomass production.
Biogas is in turn landfill gas, formed as a product of fermentation of organic compounds in landfills or sewage treatment plants. Materials used to obtain biogas can include plant, animal or municipal waste. Modern landfills, equipped with spe-cial systems degassing the waste stored are characterized by relatively high effec-tiveness of harvested biogas. Current research concerning biogas and possible en-hancements to the biogas process are presented in (Dettmann, Kanswohl, Fras, Schlegel & Geick, 2016, pp. 5–14).
2.5. Wind energy
As mentioned previously, the kinetic energy of the wind has been quite long used by the man to drive various types of equipment and vehicles (e.g. grain mills - windmills, sailing ships). The use of the kinetic energy of wind to produce electric-ity is carried out using so-called wind turbines. These are high (often 80–100 m) towers, on top of which there are power generators mounted, connected to a wind turbine. Wind turbines, driven by wind energy, transmit torque to generators that produce electricity.
Wind energy is a mainstream technology of renewable power generation. Global investment in this area has increased from the very low level 15 GW (in the 90s’) to 370 GW in the end of 2014. This represents an increase more than 24 times (Kaldellis, Apostolou, Kapsali & Kondili, 2016, pp. 543–556).
The most commonly used type of wind turbine is Horizontal-Axis Wind Tur-bines (HAWT), a three-blade, with a horizontal axis of rotation. Such a choice is caused by the higher efficiency of the turbine than in the case of turbine made in the Vertical-Axis Wind Turbines (VAWT) technology. HAWT system has signifi-cant drawbacks. The most important of his imperfections is a need for the presence of average, relatively high incidence of wind. There is also a need to change the position of the nacelle relatively to the direction of the wind, and the use of com-plex mechanisms that inhibit the speed of rotation of the turbine in the event of too strong wind. An additional difficulty in the case of the use of wind energy to pro-duce electricity, is the need for long-term measurements of the intensity of the wind in the planned point of a wind turbine construction. Such measurements often last for 1 to 2 years.
Wind turbines belong to the group of turbines using renewable energy sources with relatively low operating expenses, but quite high costs of investment. It is
assumed that, depending on the given location of the object, the average cost of building a wind turbine on land with a capacity of 1 MW ranges from 4 to even 8 million of PLN.
3. FINANCIAL EFFICIENCY EVALUATION OF WIND TURBINES
Financial efficiency evaluation of the project is based on an analysis aimed at assessing whether it will bring benefits to the investor. Investor’s expectations may be defined differently. Usually it is assumed that the investor expects profits from the outlays on investment. It is significant to investigate the predictable future in-vestment incomes and evaluate whether their current value is at the level of passing the profit (Popovic, Milosevic & Kuzmanovic, 2012, p. 378). This criterion was adopted as the most important in further considerations.According to the literature on the subject, the type of electricity production con-sidered should be classified as so-called "typical investment" (Pazio, 2001). This means that the investment requires incurring certain capital expenditures. These expenses are incurred primarily in the first years of the investment project. In sub-sequent years, the investment shall bring financial surpluses, from which the inves-tor will recover outlays and then will be able to reap additional profits. The dura-tion of the investment can be determined at the level of 25 years from the launch of the production of electricity, because such life of the wind turbines is usually de-termined by their manufacturers. After 25 years, the operation of the turbine usu-ally terminates and the wind turbine must be replaced with a new one.
In the case of this type of investment, one can use known methods for financial efficiency evaluation. One of them is a discount method. It enables financial evaluation of the investment project. Discount method takes into consideration the updated value of money over time, and also bases on the principles of discounting. Simpler, non- discount methods can be used for a quicker check of the financial efficiency and these indicators shall be rather treated as exploratory.
This article does not consider social or environmental aspects of the economic efficiency of the production of electricity using wind turbines. In the case of carry-ing out the investment project comprehensive evaluation such factors should also be taken into consideration.
For the purposes of this discussion, the following financial ratios can be consid-ered as follows (Pazio, 2001).
1. Non-discounted methods 1.1. Payback period on investment
on
Amortizati
profit
Net
Capital
expenditur
es
PP
(1)Payback period on investment is used to check the period during which the in-vestor obtains reimbursement of the investment expenditures.
1.2. Accounting rate of return on investment
%
100
*
profit
Net
es
expenditur
Capital
AAR
(2)This indicator allows estimating what part of the expenditures will be sustain-able with net profit obtained from the investment.
Indicators PP (1) and ARR (2) do not take into account the discounted value of money or other significant changes resulting from for example changes in tax regu-lations. Therefore, these are imprecise indicators. They provide little information about the financial viability of the investment.
2. Discount methods 2.1. Net Present Value
n tenditures
Capital
NPV
0exp
nr)
(1
NCFt
(3)Indicator (3) is the aggregate value of discounted cash inflows for the year of the investment, taking into consideration the investment expenditures. The formula for the NPV is consistent with the model of a typical investment for which the in-vestment costs are incurred at the beginning of the inin-vestment.
2.2. Profitability Index
-NPV
NPV
PI
(4)Indicator (4) takes into account the discounted positive cash flows in relation to the discounted, negative cash flows generated by the considered investment. For typical investments the denominator of the formula resembles the expenditures on investment.
2.3. Internal Rate of Return
0 exp ) ( 0
n t n enditures Capital IRR IRR 1 NCFt (5)Internal rate of return on investment is the largest rate of return that the investor is able to achieve from the investment under consideration. The significant ad-vantage of this indicator is its independence on the assumed value of the discount rate. The relationship presented is applicable for typical investments.
Analysing the profitability of the production of electricity using wind turbines it should be remembered that the cost of one MW is significant (1–2 mln Euro). It's quite a large amount. Therefore, in case of this type of investment, investors often reach for funding from the EU, e.g. under the Operational Programme Infrastruc-ture and Environment 2014–2020. The grant amounts that can be obtained are very diverse and depend on, among others, the type of investment.
Obtaining co-financing from the EU funds is not a simple matter. In the process of analysing the financial efficiency of the project what should be taken into ac-count are the pessimistic variants of a small or zero co-financing of the investment. Currently, fewer and fewer European projects manage to obtain support in the form of direct grants. The financial analysis often, therefore, should also take into con-sideration the cost of an investment loan. After all, it can be assumed that the value of the IRR for investments of this type ranges from 10 to 20%. This value of the internal investment return means the proper profitability of such investments.
4. CALCULATION RESULTS
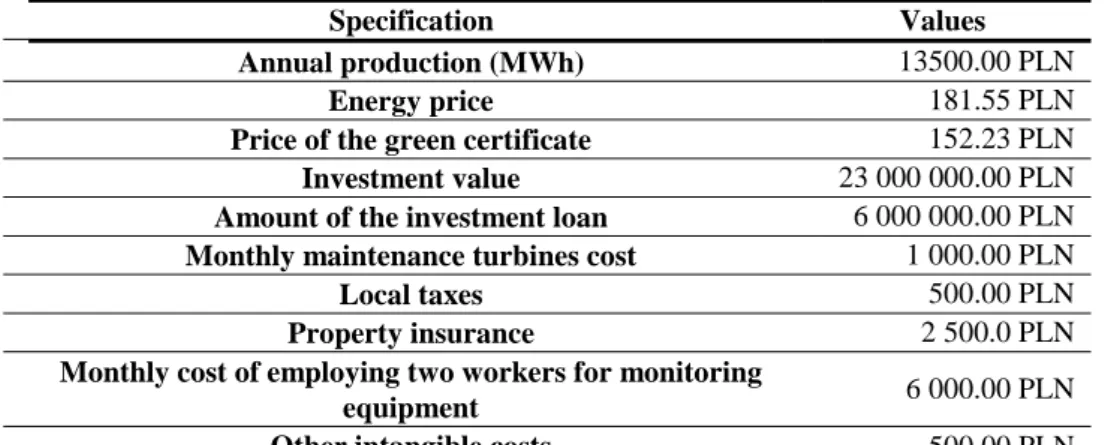
This chapter presents the calculation of NPV and IRR parameters for a hypo-thetical investment in the production of electricity. There was an assumption made about the use of a wind farm consisting of three wind turbines with a capacity of 1.8 MW each. Efforts have been undertaken to make the presented data possibly similar to the real situation. The investment period of 25 years has been assumed. This is the usual life of wind turbines provided by their manufacturers. Table 1 presents more project assumptions.
Table 1. Project assumptions (own calculation)
Specification Values
Annual production (MWh) 13500.00 PLN
Energy price 181.55 PLN
Price of the green certificate 152.23 PLN
Investment value 23 000 000.00 PLN
Amount of the investment loan 6 000 000.00 PLN
Monthly maintenance turbines cost 1 000.00 PLN
Local taxes 500.00 PLN
Property insurance 2 500.0 PLN
Monthly cost of employing two workers for monitoring
equipment 6 000.00 PLN
The total cost of the investment is 23 mln PLN, 6 million of which will be fi-nanced with an investment loan. Table 2 contains the profit and loss account for one year.
Table 2. Profit and loss account (own calculation)
Specification Values Annual revenue 4 506 030.00 PLN Prime costs 126 000.00 PLN Finance costs 912 000.00 PLN Gross profit 3 468 030.00 PLN Income tax 658 925.70 PLN Net profit 2 809 104.30 PLN Amortization 1 485 000.00 PLN CFt 4 294 104.30 PLN
Based on Table 3 payback period (discounted) was determined for 7 years and 281 days.
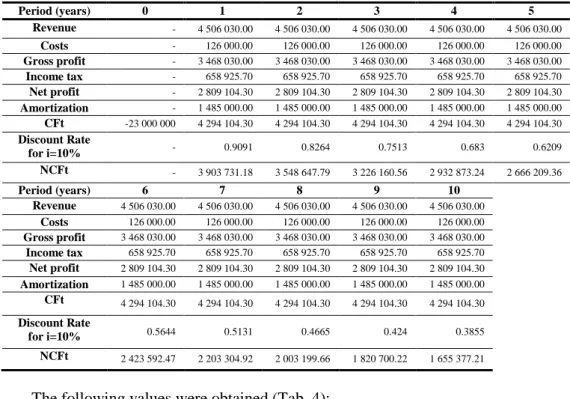
Table 4 contains the discounted cash flows for each year of the investment. On the basis of these data, values of indicators NPV and IRR were established.
Table 3. Accumulated cash flows (own calculation)
Ye a rs Ca sh Fl o ws (PLN) Ac cu m u la te d ca sh flo ws Th e a cc u m u la te d surpl u s o f in iti a l in v estm en t Disc o u n t ra te Disc o u n te d CFt Ac cu m u la te d n et ca sh flo ws 0 0 -23 000 000.00 0 - -23 000 000.00 -23 000 000.00 1 4 294 104.30 -18 705 895.70 0 0.9091 3 903 731.18 -19 096 268.82 2 4 294 104.30 -14 411 791.40 4 294 104.30 0.8264 3 548 647.79 -15 547 621.02 3 4 294 104.30 -10 117 687.10 8 588 208.60 0.7513 3 226 160.56 -12 321 460.46 4 4 294 104.30 -5 823 582.80 12 882 312.90 0.6830 2 932 873.24 -9 388 587.23 5 4 294 104.30 -1 529 478.50 17 176 417.20 0.6209 2 666 209.36 -6 722 377.87 6 4 294 104.30 2 764 625.80 21 470 521.50 0.5644 2 423 592.47 -4 298 785.40 7 4 294 104.30 7 058 730.10 25 764 625.80 0.5131 2 203 304.92 -2 095 480.48 8 4 294 104.30 11 352 834.40 30 058 730.10 0.4665 2 003 199.66 -92 280.83 9 4 294 104.30 15 646 938.70 34 352 834.40 0.4240 1 820 700.22 1 728 419.40 10 4 294 104.30 19 941 043.00 38 646 938.70 0.3855 1 655 377.21 3 383 796.60
Table 4. The discounted cash flows in each year of investment (own calculation) Period (years) 0 1 2 3 4 5 Revenue - 4 506 030.00 4 506 030.00 4 506 030.00 4 506 030.00 4 506 030.00 Costs - 126 000.00 126 000.00 126 000.00 126 000.00 126 000.00 Gross profit - 3 468 030.00 3 468 030.00 3 468 030.00 3 468 030.00 3 468 030.00 Income tax - 658 925.70 658 925.70 658 925.70 658 925.70 658 925.70 Net profit - 2 809 104.30 2 809 104.30 2 809 104.30 2 809 104.30 2 809 104.30 Amortization - 1 485 000.00 1 485 000.00 1 485 000.00 1 485 000.00 1 485 000.00 CFt -23 000 000 4 294 104.30 4 294 104.30 4 294 104.30 4 294 104.30 4 294 104.30 Discount Rate for i=10% - 0.9091 0.8264 0.7513 0.683 0.6209 NCFt - 3 903 731.18 3 548 647.79 3 226 160.56 2 932 873.24 2 666 209.36 Period (years) 6 7 8 9 10 Revenue 4 506 030.00 4 506 030.00 4 506 030.00 4 506 030.00 4 506 030.00 Costs 126 000.00 126 000.00 126 000.00 126 000.00 126 000.00 Gross profit 3 468 030.00 3 468 030.00 3 468 030.00 3 468 030.00 3 468 030.00 Income tax 658 925.70 658 925.70 658 925.70 658 925.70 658 925.70 Net profit 2 809 104.30 2 809 104.30 2 809 104.30 2 809 104.30 2 809 104.30 Amortization 1 485 000.00 1 485 000.00 1 485 000.00 1 485 000.00 1 485 000.00 CFt 4 294 104.30 4 294 104.30 4 294 104.30 4 294 104.30 4 294 104.30 Discount Rate for i=10% 0.5644 0.5131 0.4665 0.424 0.3855 NCFt 2 423 592.47 2 203 304.92 2 003 199.66 1 820 700.22 1 655 377.21
The following values were obtained (Tab. 4): • NPV = 3 385 412.03 PLN
• IRR = 13%
In connection with the obtained values of NPV and IRR it can be assumed that the evaluated investment project is viable from a financial point of view.
5. CONCLUSION
Presented synthetic overview of renewable technologies used to produce elec-tricity enabled the identification of their positive qualities that distinguish them from non-renewable sources. Considerations concerning the evaluation of financial efficiency of wind power, illustrated by calculations examples of financial indica-tors for a hypothetical investment project, confirmed the efficiency of this type of investment and its compliance with the fundamental principles of sustainable de-velopment. In further studies, these analyses will be generalized not only to the local, but also regional level.
The examined issues and projects typically are unique and complex. Project ob-jectives have frequently multifaceted nature. This leads to multi-faceted approaches of project evaluation. It should be taking into account formerly planned: aim,
prin-ciples and methods, which is made on the basis of collected and analyzed data, information and knowledge (Grzeszczyk, 2012, p. 187).
Therefore, the evaluation process of this kind of investment projects cannot be limited only to the use of financial ratios. The energetic investment projects are multi-faceted in nature. It is necessary to take into consideration not only financial, but also environmental and social effects. This is consistent with the principles of sustainability in project management and evaluation. It is therefore necessary to continue research on improving electric power investment efficiency by using re-newable energy sources and new comprehensive evaluation methods of such invest-ments. For example, evaluation methods based on knowledge (Grzeszczyk, 2013, p. 60) and selected artificial intelligence methods (Grzeszczyk, 2010, pp. 7–20) can pose an important complement for classical evaluation methods based on financial ratios such as NPV, IRR, etc.
REFERENCES
BP Statistical Review of World Energy June 2014, available at: www.bp.com/con- tent/dam/bp-country/de_de/PDFs/brochures/BP-statistical-review-of-world-energy-2014-full-report.pdf (accessed 14 July 2016).
Dettmann S., Kanswohl N., Fras J., Schlegel M. & Geick T. (2016), Optimization of the Deployment of Bioenergy by Increasing the Efficiency of Biogas Production, Research in Logistics & Production, Vol. 6, No. 1.
Flowers M.E., Smith M.K., Parsekian A.W., Boyuk D.S., McGrath J.K. & Yates L. (2016), Climate impacts on the cost of solar energy, Energy Policy, Vol. 94.
Grzeszczyk T.A. (2013), Developing a New Project Evaluation Systems Based on Know-ledge, Foundations of Management, Vol. 5, No. 2.
Grzeszczyk T.A. (2012), Modelowanie ewaluacji projektow europejskich, Placet, Warszawa. Grzeszczyk T.A. (2010), Neural networks usage in the evaluation of European Union
co-financed projects, Foundations of Management, Vol. 2, No. 1.
Kaldellis J. K., Apostolou D., Kapsali M. & Kondili E. (2016), Environmental and social footprint of offshore wind energy. Comparison with onshore counterpart, Renewable Energy, Vol. 92.
PAIZ (2012), Energy Sector in Poland, available at: www.paiz.gov.pl/files/?id_plik=19610 (accessed 14 July 2016).
Pazio W.J. (2001), Analiza finansowa i ocena efektywności projektów inwestycyjnych przedsiębiorstw, Oficyna Wydawnicza Politechniki Warszawskiej, Warszawa. Popovic M., Milosevic S. & Kuzmanovic M. (2012), Using AHP and Financial Criteria for
Evaluating Alternatives to Reduce Risk of Investment, Research in Logistics & Production, Vol. 2, No. 4.
Skea J. & Nishioka S. (2008), Policies and practices for a low-carbon society. Modelling long-term scenarios for low carbon societies, N.Strachan, T.Foxon, T.J. Fujino (eds.), Climate Policy, vol. 8.
Sharma A. (2015), Global solar PV demand to grow by up to 25 percent in 2015, Top Solar Power Industry Trends for 2015, IHS, available at:
https://www.ihs.com/pdf/Top-Solar-Power-Industry-Trends-for-2015_21390915556783632.pdf (accessed 12 July 2016).
Szewczyk J., (2011), Temperatura ziemi, available at: www.jednaziemia.pl/planeta-ziemia/3703-temperatura-ziemi.html (accessed 14 July 2016).
BIOGRAPHICAL NOTES
Tadeusz A. Grzeszczyk, Ph. D., Hab., Eng., received Ph.D. (in the discipline of
management sciences) from Faculty of Production Engineering, Warsaw University of Technology in 2002 and Habilitation from Faculty of Computer Science and Management, Wroclaw University of Technology in 2014. His scientific and research interests refers particularly to the following areas: project management, project evaluation systems, knowledge engineering, knowledge management systems and applications of artificial intelligence in management. The list of his publications includes more than hundred papers and several books in the above mentioned subject areas.
Michał Izdebski, MSc, is working on a doctorate at Faculty of Management