THE ROLE OF RENEWABLE ENERGY SOURCES
IN USA ENERGY PRODUCTION – PART I
Andrzej J. Gapinski
Engineering, The Pennsylvania State University-Fayette, Lemont Furnace, Pennsylvania, 15456, USA, Email: ajg2@psu.edu
Abstract. The article analyzes the present role of renewable energy resources in U.S. energy
production including Pennsylvania. Comparisons are being made to European Union (EU-27) block, the Organization for Economic Co-operation and Development (OECD) block, and some developing and third world countries. Classification of main energy resources and their trends in the USA energy production is provided. Renewable energy resources are analyzed and their contribution to the USA energy balance is described.
Paper type: Research Paper Published online: 28 October 2016 Vol. 6, No. 5, pp. 419–428
DOI: 10.21008/j.2083-4950.2016.6.5.4 ISSN 2083-4942 (Print)
ISSN 2083-4950 (Online)
© 2016 Poznan University of Technology. All rights reserved.
1. ENERGY SOURCES: USA VS. WORLD
Since the dawn of industrial revolution the energy resources played an important role in national economies of industrial world. An abundance of energy resources contributed greatly to the success of U.S. economic development and its dominant position in the world economy to this day. The U.S. share of world economy as share of world GDP was at 17.1% as of 2011 (World Bank, 2011). Other top coun-tries, by comparison, with subsequently lower share of world economy are: China at 14.9%, India at 6.4%, Japan at 4.8%, Germany at 3.7%, and Russia at 3.1% (World Bank, 2011).
The national economies of industrialized world have diversified their energy sources by mowing away from the dominance of coal of the late nineteenth and twentieth centuries to much wider spectrum of energy resources of today.
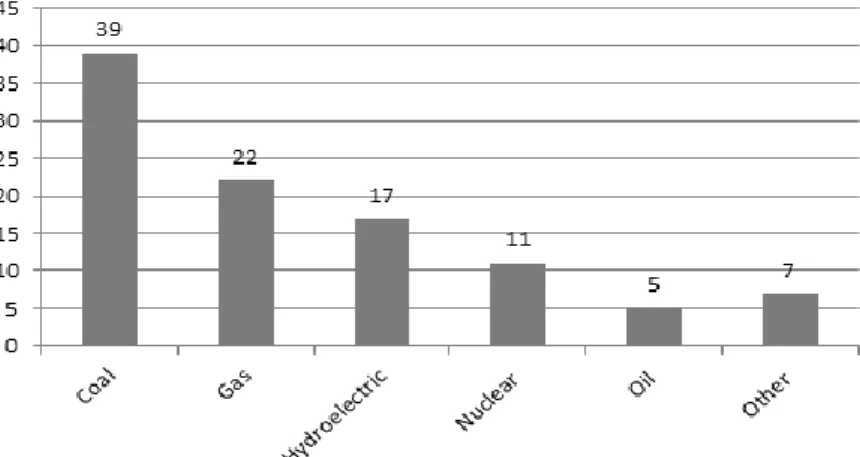
The contribution to the world electricity production in 2014 by various energy sources are as follows: coal at 39%, natural gas at 22%, hydroelectric at 17%, nuclear at 11%, oil at 5%, and other, which includes renewables at 7% (Fig. 1). Despite attempts to reduce carbon footprint of electric power production the world economies were not able to reduce dependence on coal in any meaningful way. Coal still plays a dominant role in electric power generation worldwide with its contribution at 39% (Fig. 1). This fact affects and will affect the socio-economic environment and political decision making impacting citizens’ lives in many coun-tries, especially third world councoun-tries, for many decades to come.
Fig. 1. World Electricity Production by Energy Source. Percentile. 2014 <www.tsp-data-portal.com> (TSP, 2016)
How does the USA compare to the world as far as contribution of various energy sources in total energy production? Figure 2 shows a breakdown of energy produc-tion with respect to individual contribuproduc-tions by oil, gas, coal, nuclear, and
renewa-bles. While the USA due to its shale revolution was able to reduce coal contribution to 21.8% and replace it to some extent with natural gas of 31.4% of total energy con-sumed and to maintain nuclear contribution at 9.8%, the European Union (EU) coun-tries moved away from fossil fuels more successfully with contributions of oil at 9%, gas at 22.8%, and coal at 15.2% with nuclear energy of 37.7%. The Organiza-tion for Economic Co-operaOrganiza-tion and Development (OECD) which includes, besides European countries also USA, Canada, Australia, Chile, and Mexico as a whole still relies on fossil fuels of oil at 31.9%, gas at 28.8%, and coal at 21.3% contributions in a significant way (OECD, 2016). Naturally, there are big differences with regard to energy diversification among countries within EU or OECD blocks. While France, for example, generates majority of its electricity from nuclear power plants, other countries depend to various degree on traditional fossil fuels such as coal. In Germa-ny, in spite of the government policies to promote renewables, in 2013, coal made up about 45% of country's electricity production (19% from hard coal and 26% from lignite). Denmark on other hand, the leader in renewable energies, set a world record in wind energy production with 42% of its power from windmills in 2015. Denmark success is based on the long-term meticulous planning and investments. The pro-gram was initiated 40 years ago due to the 1973 Arab oil embargo and will culmi-nate by 2050 with 100% of power delivered by renewable energies (McKay, 2016).
Fig. 2. Breakdown of Energy Production: World, USA, EU-27 (Excluding Croatia which joined EU in 2013), OECD. 2014. Percentile <www.tsp-data-portal.com> (TSP, 2016)
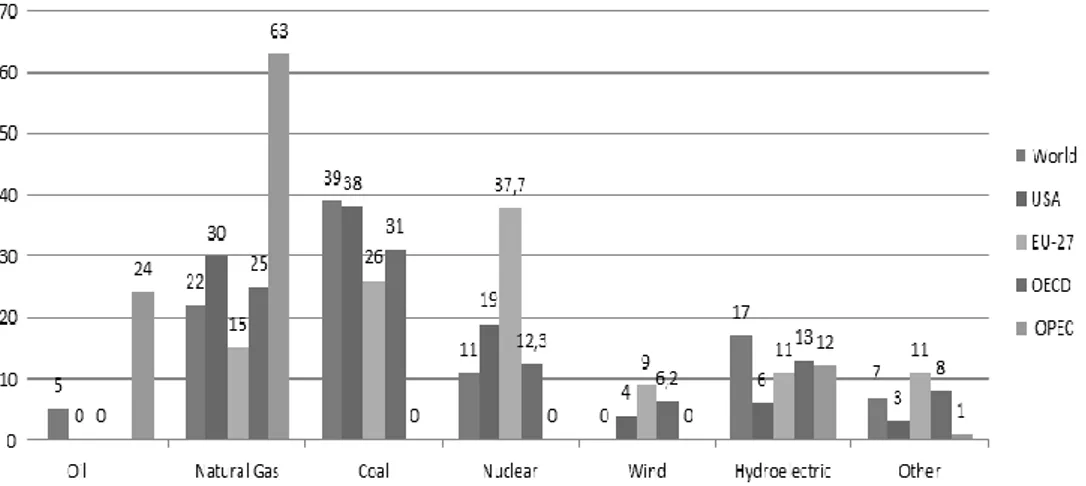
The data of Figure 2 shows that European Union countries were able to move most dramatically from coal and oil to other energy sources including renewable resources, which contribute around 15.3% of the total. The Figure 3, displays the e-nergy sources used by world major ee-nergy producers such as the USA, EU, OECD,
and OPEC in production of electricity. To an observer, all data indicate that the predominant energy contributions still come from fossil fuels such as gas and coal. In the USA, EU, and OECD countries the oil and coal contribute still: 68% (30%+38%), 41% (15%+26%), and 56% (25%+31%), respectively, of total elec-tricity production. The USA, EU, and OECD countries were able to reduce oil in electric power generation almost entirely but coal still occupies 38%, 26%, 31% contributions, respectively. The nuclear energy contributes, in the USA, 19% of total electric energy, while in EU its contribution is significantly higher at 37.7%, and in OECD at 12.3%.
Renewable resource such as wind energy plays more significant role in elec-tricity production in EU and OECD countries than in the USA: 9%, 6.2%, respec-tively vs. 4% for the USA (Fig. 3).
Fig. 3. Electricity Production by Source: World, USA, EU 27, OECD, OPEC. Percentile. 2014 <www.tsp-data-portal.com> (TSP, 2016)
Hydropower factor carries a heavier importance worldwide of 17%, in EU-27 of 11%, in OECD of 13% than in USA at 6%. Surprisingly, the OPEC countries gen-erate 12% of their electric energy from hydroelectric power stations.
2. GREENHOUSE GASES
The renewable energies address an important requirement of energy diversifica-tion at nadiversifica-tional economies worldwide. They also provide means to satisfy the expec-tations, by current societies, for energy sustainable options irrespective of level of state economic development. Naturally, renewable energies by providing alternative solutions for energy production help to reduce emissions of greenhouse gases.
According to U.S. Environmental Protection Agency (EPA) data (EPA, 2016), on a global scale, the emissions of greenhouse gases emitted by humans are:
• 76% Carbon dioxide (CO2): primary source is given by use of fossil fuel, industrial processes, deforestation, degradation of soil, etc.,
• 16% Methane (CH4): agriculture, energy use, waste management, biomass burning,
• 6% Nitrous Oxide (N2O): agriculture, biomass burning,
• 2% Fluorinated gases (F-gases): industrial processes, refrigeration, con-sumer products.
Furthermore the EPA (EPA, 2016) provides breakdown of greenhouse gases emis-sions by economic sectors: (1) Electricity & heat production 25%, (2) Agriculture, forestry 24%, (3) Industry 21%, (4) Transportation 14%, (5) Buildings 6%, (6) Other energy 10%.
From the above listed breakdown, one can conclude that renewable energies have a major role to play in reduction of greenhouse gases mainly by contributing to electricity production and heating. The global carbon emissions from fossil fuels have increased dramatically since 1900, and between years of 1970 and 2011 green-house gas emission, it is estimated, has increased by 80% (EPA, 2016). It is worth to list biggest contributing countries or block countries to greenhouse gas (CO2) emissions as of 2011, according to Synthesis Report by the Intergovernmental Pan-el on Climate Change (IPCC, 2014) as: (1) China 28%, (2) USA 16%, (3) EU-28 10%, (4) India 6%, (5) Russian Federation 6%, (6) Japan 4%.
As the above listed polluters with inclusion of EU-28 countries generate a majori-ty of greenhouse gas emissions, cumulatively, at 70% level world-wide, it should be quite obvious to anybody that the role of renewable energies should only increase significantly if gases emissions are to be tackled successfully. A significant role in addressing the gas emissions should be played by countries such as the USA, EU-28, and OECD, which are most economically and technologically advanced. The techno-logical breakthroughs should bring about new solutions implementable worldwide and help third world countries to battle greenhouse gas emissions.
3. ENERGY SOURCES IN THE USA
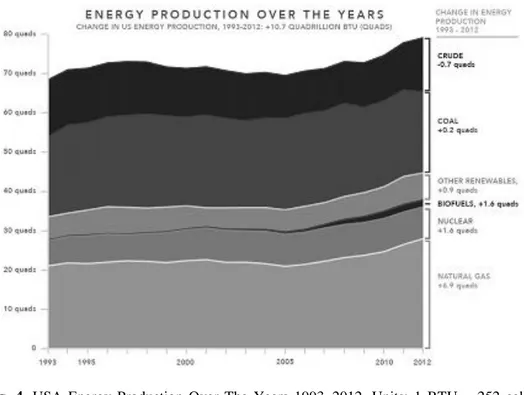
In the past the U.S. energy sources, although diversified, have been essentially based on a few resources with a heavy carbon footprint. Crude oil, natural gas, and coal were and still are the main minerals used in energy production. Renewables resources, which include mainly wind, biofuels, solar power, and geothermal despite government economic policies of subsidizing alternative energy sources provide less than 7% of overall energy produced. Figure 4 shows U.S. energy production with individual contribution by natural gas, coal, crude, nuclear and renewables within the time range of 1993–2012 according to data provided by U.S. Energy Information
Administration (EIA) (EIA, 2016). Through the span of years between 1993 and 2014 a natural gas due to a very successful shale deposits extraction in recent years expanded its role the most and a coal experienced a diminishing role. During this time span a nuclear energy has maintained its contribution almost steadily, while renewables with biofuels created a noticeable increase since 2005.
The energy industry has always been an important contributor to national econo-my. According to data provided by the American Petroleum Institute (API) reported in the World Economic Forum document (World Forum, 2016), the energy industry supports more than nine million jobs directly and indirectly in the USA, which is over 5% of the country’s total employment and represented in 2009 7.7% of U.S. GDP. Due to discovery and exploration of shale gas in the continental U.S. in recent years it is expected that this contribution to the growth of the workforce will only increase.
Fig. 4. USA Energy Production Over The Years 1993–2012. Units: 1 BTU = 252 cal = 1.055 kJ; 1 Quad = 1015 BTU. Source: EIA State Energy Data System (EIA, 2016)
How has contribution of main energy sources changed in U.S. electrical power production through recent years? Figure 5 shows contribution of main energy sources in U.S. electric energy generation.
In the last nineteen years, 1995–2014, U.S. energy sector reduced coal as the main electric power source from 51% to 38%, increased use of gas from 15% to
30% eliminating oil almost completely, and increased renewables usage: wind, solar, hydro and other to the total of 13%. Nuclear energy has remained, through this period, without major change of its contribution at around 20% of total electric power generation.
Fig. 5. Electricity Production by Source in USA in percentage. 2014 <www.tsp-data-portal.com> (TSP, 2016)
4. PENNSYLVANIA VS. USA
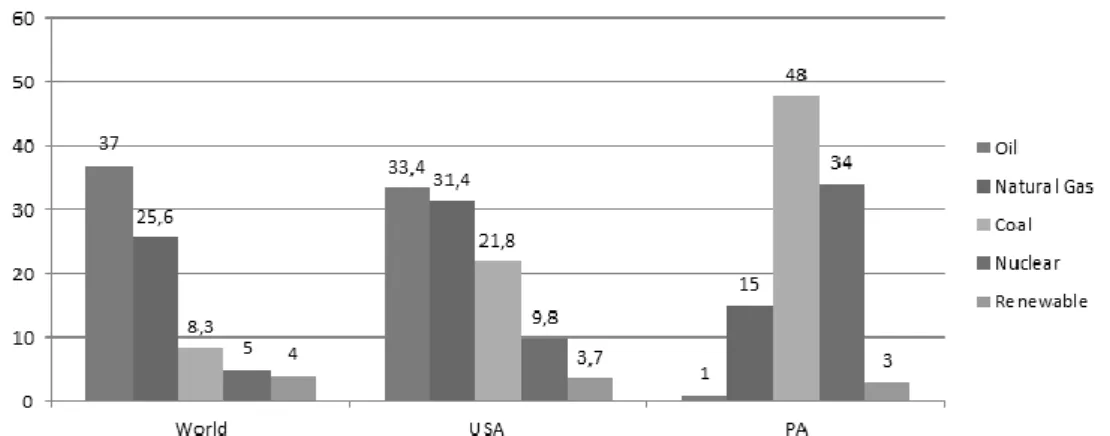
In the USA the energy sources were pursued according to availability of natural deposits of minerals. The state of Pennsylvania (PA) with its rich coal deposits was a leading coal producer for many of the last decades. Discovery and production of shale gas added a new dimension to state energy balance. The contribution of main energy sources such as oil, natural gas, coal, nuclear, and renewables in electric energy production in the World, USA, and Pennsylvania are shown on Figure 6. Coal with contribution of 48% still plays an important role in PA energy produc-tion, so is nuclear of 34%, both above the US average of 21.8% for coal and 9.8% for nuclear, respectively (PA, 2016).
Pennsylvania is the power house in electricity generation and counts as a second state in U.S. overall electricity generation. It is also a dominant player in export of electricity as it exports the most electricity in the country.
Fig. 6. Breakdown of Electricity Production by Source in World, USA, Pennsylvania in percentage. 2014 <www.tsp-data-portal.com> (TSP, 2016)
5. RENEWABLE RESOURCES
The role of renewable sources in energy production in the USA, despite of gov-ernment policies promoting development of alternative resources in order to de-crease reliance on traditional sources, inde-creased only by a few percent in total ener-gy production in recent years. The breakdown of renewable enerener-gy sources by type is displayed in Figure 7. The contributions are as follows: fuel ethanol at 49.7%, wind at 27.5%, biomass at 11.9%, biodiesel at 5.3%, other at 5.6% (Fig. 7).
Fig. 7. Breakdown of USA Renewable Energy Sources. 2014 <www.tsp-data-portal.com> (TSP, 2016)
Pennsylvania undertook various initiatives to change the energy sources land-scape. Consequently, the role of various fuels in electric power generation has changed as follows: the role of coal decreased from 57% (2000) to 48% (2010) to 35% (est. 2017) and at the same time the role of natural gas increased from 1% to 15% and 23%, renewables from 2 to 5% (est.) from 2000 through 2010 to 2017. The use of natural gas in PA for electricity production has increased almost 20 percent annually from 2000 to 2015 (PA, 2016). Nuclear sector maintains its contribution at around 35 percent (Fig. 8).
Fig. 8. Shares (percentage) of electricity generation by fuel type in Pennsylvania. Source: Pennsylvania Public Utility Commission, Energy Information Administration (PUC, 2016)
In the second part of the article the contributions of the most important renewable technologies in energy production are described: solar power, wind energy, hydroelec-tric, nuclear, and geothermal. The contribution of other resources such as hydrogen and fuel cells, bio-energy resources due to their negligible level of impact is not covered here.
REFERENCES
EIA (2016), available at <www.eia.gov> [accessed: April 28, 2016].
EPA (2016), available at <https://www3.epa.gov/climatechange/ghgemissions/global.html> [accessed: April 28, 2016].
IPCC (2014), Climate Change 2014: Synthesis Report.
McKay T. (2016), Denmark Sets Another World Record in Wind Energy Production, <https://mic.-com/articles/132794/denmark-sets-another-world-record-in-wind-ener-gy-production#.xxEUFpvMq> [accessed: March 29, 2016].
OECD (2016), available at <www.oecd.org> [accessed: March 29, 2016].
PA (2016), available at <http://www.elibrary.dep.state.pa.us/dsweb/Get/Document-96943-/Final%20PA%20Com-prehensive%20Energy%20Analysis.pdf> [accessed: April 15, 2016].
TSP (2016) availabel at <www.tsp-data-portal.com> [accessed: March 25, 2016].
World Bank (2011), available at <http://siteresources.worldbank.org/ICPEXT/Resources-/ICP_2011.html> [accessed: April 2, 2016].
World Forum (2016), available at <http://reports.weforum.org/energy-for-economic- growth-energy-vision-update-2012/#chapter-the-role-of-the-energy-sector-in-job-c-reation> [accessed: April 28, 2016].
BIOGRAPHICAL NOTES
Andrzej J. Gapinski is the Associate Professor of Engineering at The
Pennsyl-vania State University, PennsylPennsyl-vania, USA. Dr. A. Gapinski received his Ph.D. in Electrical Engineering from Texas Tech University, Lubbock, Texas, USA in 1988. He obtained his Master Degree in Electronics, Institute of Technical Cybernetics, Wroclaw University of Technology, Wroclaw, Poland in 1978. His research interests are in control & system theory, information science and technology, manufacturing processes and pedagogy. He has over 50 refereed publications in journals and various conference proceedings. He consults for industrial and manufacturing firms in the area of industrial control and manufacturing processes.