TRENDS
in
Sport Sciences
2020; 27(1): 5-11 ISSN 2299-9590 DOI: 10.23829/TSS.2020.27.1-1 Received: 16 November 2019 Accepted: 12 February 2020Corresponding author: maciej.jaguszewski@gmail.com
Adam Mickiewicz University in Poznań, Faculty of Mathematics and Computer Science, Poznań, Poland
MACIEJ JAGUSZEWSKI
Increasing role of three-point field goals
in National Basketball Association
Introduction
I
n basketball, like in the other sports, rules change from time to time. Some articles examine the impact of principles adjustments on game-related statistics, mainly in basketball [7, 13, 14], but also in other sports like water polo [16]. The present study shows how much introducing three-point field goal changed the approach to the game of basketball in National Basketball Association (NBA). NBA is a men’s professional basketball league in North America, since 2004 composed of 30 teams (29 from United States and 1 from Canada) and is widely considered to be the best and the most popular men’s professional basketball league in the world. There are many research around the NBA concerning impact of injuries [3, 18] and examining factors leading to wins [1, 12, 15, 19]. Although there are some articles mentioning increasing impact of three-point shots in the NBA [4, 5, 6, 11, 17, 21], they are popular science. In this particular paper this trend was examined scientifically in order to receive significant results useful in understanding recent tendencies in basketball.In National Basketball Association before 1979 every basket made from the field was worth two points. Since 1979/80 season in the NBA there has been a three-point Abstract
Introduction. Since introduction of three-point field goal NBA teams have used this shot more frequently and nowadays it is inseparable part of teams’ game plan in basketball. The increasing role of three-point shot is recently topic of many conversation around basketball. Aim of Study. The purpose of this study was to examine if the growth of the role of three-point shots in the NBA is statistically significant, to find out the reason for that growth and whether three-point field goal attempts have an impact on result of basketball games. Material and Methods. Statistical data concerning three-point field goal attempts over the course of 15 most recent NBA regular seasons were collected and used in analysis. Increasing role of three-point shot was examined by original method, using 3PA/FGA coefficient which measures the frequency of three-point field goal attempts in all field goal attempts. Statistical calculations were carried out using STATISTICA software package. Results.
Statistically significant differences in frequency of three-point field goal attempts between seasons taken in consideration were revealed by Friedman’s ANOVA. Results also showed that the biggest increase of frequency of three-point shots was between 2015/16 and 2016/17 seasons after the most successful regular season in NBA history by Golden State Warriors. Conclusions.
Three-point field goal became one of the most important part of basketball and its role has increased over the years. Nowadays ability to shoot from beyond the arc is crucial as lack of this ability decreases number of options in offensive tactic by any team. Even though three-point field goal is not the most important factor in determining winner of basketball game, it has significant impact on result of basketball games.
KEYWORDS: three-point field goal, basketball, National Basketball Association, trend in sport.
line and every shot made from behind that line is worth three points while every other made field goal gives two points [20]. Adding three-point line did not immediately change approach to basketball as three-point shots were not used as often as they are nowadays. At the beginning of three-point era people around NBA were skeptical to new rule and did not think that could change the game of basketball [10] and that was observed as three-pointers were taken occasionally, average less than 3 attempts during whole game by team.
It is worth noting that the number of three-point shot attempts is growing almost every season. This is probably the consequence of coaching staff trying to find the best way to maximize number of points in the same number of possessions which could lead to more wins. It is examined in many analyses what is better for team, for example it is more efficient to attempt a three-point field goal if player makes 35% shots from that area (1.05 points per possession) than a two-point field goal if player shoots 50% from this particular area (1.00 points per possession). Most recently teams use analyses of mapping shots [4] which lead to conclusion three-point field goal attempts are analytically better and make offense more efficient as they give more point per one possession than two point field goals from certain areas.
Even though the result of basketball game consists many factors [8] such as rebounds, free throws and turnovers, in this article only three-point field goal attempts (and their frequency in all field goal attempts) are taken into account to examine increasing role of three-point shots in basketball.
To examine if there is significant growth of role of three-point shots, coefficient 3PA/FGA(%) (three-point field goal attempts/field goal attempts (%)) was used. It is worth mentioning that this is a new idea of examining growth of role of three-point shots by this coefficient and there was no scientific article based on 3PA/ FGA(%). This coefficient measures frequency of three-point field goal attempts among all field goals attempts (two-point and three-point shots) and directly did not depend on pace of the game, rebounds, turnovers, free throws and any other descriptive statistics other than field goal attempts. 3PA/FGA(%) coefficient is count as proportion of team’s three-point field goal attempts and all field goal attempts per game and then result is presented in percentage (multiplied by 100%). In the text the abbreviation 3PA/FGA will be used. This coefficient is better estimate for examining three-point shots’ role than just three-point field goal attempts which could give misleading results. For example if
team A plays fast, attempts 100 field goals per game and attempts 30 three-point field goals on average and team B plays much slower (and draws more fouls or has more turnovers), attempts 80 field goals per game with 28 three-point field goal attempts, only three-point shot attempts give advantage to team A (30 to 28), but if 3PA/ FGA is taken, team B has higher score (35% to 30%) and that is more reliable result because team B is attempting three-point shots more frequently than team A.
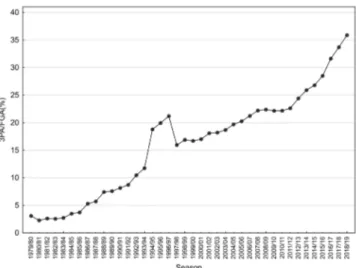
Figure 1. Changes of 3PA/FGA(%) coefficient in the NBA
since introduction of three-point field goal
Since the beginning of three-point era (1979/80 NBA season) the growth of three-point shot role is observed. The differences of 3PA/FGA(%) through 40 regular seasons in NBA are presented on Figure 1. It is worth noticing that in first 15 seasons of three-point era on average in every season 3PA/FGA coefficient was 0.62 percentage points (abbreviation p.p. will be used) higher than season before. Then there were three seasons with three-point line shorter, which led to massive increase of 3PA/FGA (by 7 p.p. between 1993/94 and 1994/95 seasons) and then over 5 p.p. decrease after going back to distance of line 7.24 meters away from the rim in 1997/98. Next, there were another 15 seasons in which the average growth of 3PA/FGA in between consecutive seasons was 0.48 p.p., similarly to the start of three-point era. However, since 2011/12 season larger increase of number of shots from distance has been observed as 3PA/FGA coefficient has grown on average by 1.9 p.p. in between consecutive seasons, reaching more than 35% in most recent season. 3PA/FGA coefficient on this level means that over one third of field goal attempts come from behind the three-point line.
In this particular paper, the growth of three-point shot in the NBA in a span of 15 years (between 2004/05
and 2018/19 seasons) is examined and its impact on basketball teams’ wins is discussed.
Aim of Study
The purpose of the study is to show the growth of the role of three-point field goals in regular seasons in the NBA last 15 years and check if it is statistically significant. This fact should be useful for coaches to think about how important three-point shot is in their teams’ tactics. This should also be important for coaches responsible for development of young players to lay emphasis on three-point shots as a preparation for them to enter professional league with ability to consistently make three-point field goals. This could also encourage coaches to invent new drills in practice to improve the efficiency of shots from behind the three-point line. Moreover, gaining information on the development of tendencies in basketball can constitute a basis for programming the future evolution of sports results in this particular sport.
Material and Methods
Sample and procedure
Taking into account lack of full statistical data up to 1996, the increasing number of teams in the NBA until 2004 and other rules changes (for example hand checking), it seemed rational to look at latest trends in three-point shots, in most recent 15 years, especially with observation of the biggest improvement last couple of seasons. In this analysis only regular seasons were taken in consideration as there are games between every pair of teams by contrast to playoffs where only some teams participate and they play multiple times against their particular opponent in given round.
Statistical data from the NBA from 2004/05 to 2018/19 season (15 seasons) was collected from https://stats.nba. com, the official page of statistics from NBA games. From every single one of those 15 seasons the average number of each team’s three-point shot attempts and field goal attempts per game were taken and the proportion (in percentage) of those factors was counted. This gave aforementioned coefficient 3PA/FGA which shows the frequency of three-pointers for every team each season. So basically database consisted of 15 seasons (terms) and for every season there were 30 sorted out results of every team’s 3PA/FGA coefficient.
Statistical analysis
Initially, 3PA/FGA coefficient each season was presented by mean, standard deviation, coefficient of variance,
minimum and maximum. Then, the normality of data distribution each season was examined by Shapiro– Wilk’s test. It was found out that not every season has normal distribution of coefficient 3PA/FGA. That led to conclusion the Friedman’s one-way ANOVA should be used to check if there are statistically significant differences between seasons (dependent variables). Also the Friedman’s post-hoc test for multiple comparisons was used to examine in between which seasons statistically significant differences are observed.
All statistical analyses were conducted using Dell Inc. (2016). Dell Statistica (data analysis software system), version 13. software.dell.com. The level of significance for all statistical tests was set at p ≤ 0.05.
Results
It is observed that mean usually grows between seasons. Although average growth between 2004/05 and 2011/12 was only 3 p.p. (0.43 p.p. on average between any two seasons in a row), 7 years later (in 2018/19 season) 3PA/FGA coefficient was higher over 13 p.p. (growth between two consecutive seasons since then was 1.9 p.p. on average). Standard deviation has been changing between seasons, but it is relatively settled around 4.5. Combining that with the growth of the mean of 3PA/FGA, coefficient of variation is decreasing (by 50% between 2004/05 and 2018/19 seasons). This means that the differences between teams in 3PA/FGA are becoming smaller (Table 1).
Examining changes at the span of 15 most recent seasons, the increase of 3PA/FGA coefficient was 16.3 p.p. for average team and statistically significant differences (χ2 (N = 30, df =14) = 395.85, p ≤ 0.0001)
were revealed (Table 1).
It is worth noting that team with highest 3PA/FGA in 2004/05 season has 23 p.p. smaller coefficient than a team with the highest 3PA/FGA in 2018/19 season, 7 p.p. smaller 3PA/FGA than average team from 2018/19 season and similar 3PA/FGA (just 0.3 p.p. higher) to team with the lowest value of 3PA/FGA from most recent season. Also, there are statistically significant differences (p ≤ 0.001) between 2004/05 season and seasons in between 2011/12 and 2018/19. Slightly smaller, but also statistically significant differences (p < 0.05) are between 2004/05 season and every season in between 2007/08 and 2010/11 (Table 1, Figure 2).
Similarly to 2004/05 season, there are statistically significant differences (p ≤ 0.001) between each of two following seasons (2005/06 and 2006/07) and every season in between 2012/13 and 2018/19 (Table 1).
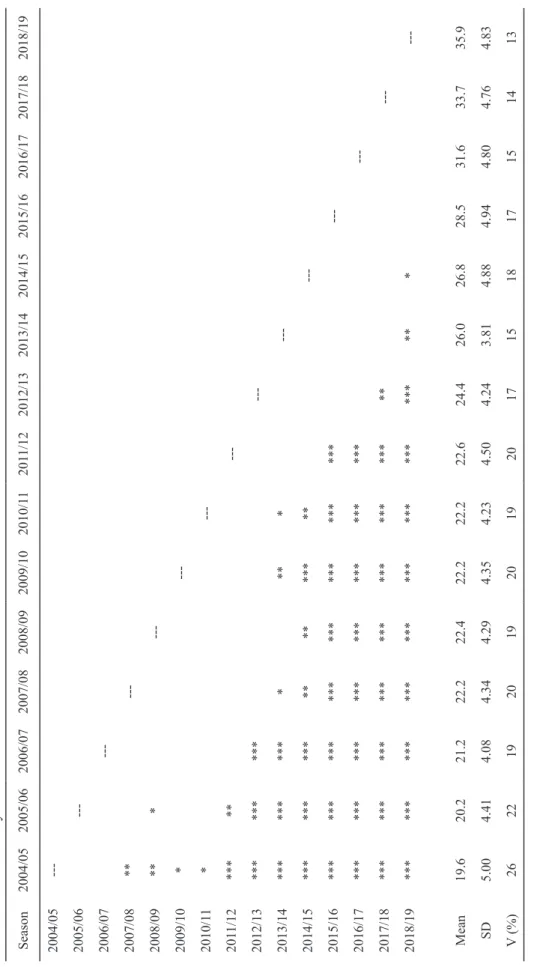
Table 1. Post-hoc for Friedman’ s ANOV A for 3P A/FGA(%) in between all seasons from 2004/05 to 2018/19 and descriptive statistics for every season taken
in consideration in analysis Season
2004/05 2005/06 2006/07 2007/08 2008/09 2009/10 2010/1 1 201 1/12 2012/13 2013/14 2014/15 2015/16 2016/17 2017/18 2018/19 2004/05 ---2005/06 ---2006/07 ---2007/08 ** ---2008/09 ** * ---2009/10 * ---2010/1 1 * ---201 1/12 *** ** ---2012/13 *** *** *** ---2013/14 *** *** *** * ** * ---2014/15 *** *** *** ** ** *** ** ---2015/16 *** *** *** *** *** *** *** *** ---2016/17 *** *** *** *** *** *** *** *** ---2017/18 *** *** *** *** *** *** *** *** ** ---2018/19 *** *** *** *** *** *** *** *** *** ** * ---Mean 19.6 20.2 21.2 22.2 22.4 22.2 22.2 22.6 24.4 26.0 26.8 28.5 31.6 33.7 35.9 SD 5.00 4.41 4.08 4.34 4.29 4.35 4.23 4.50 4.24 3.81 4.88 4.94 4.80 4.76 4.83 V (%) 26 22 19 20 19 20 19 20 17 15 18 17 15 14 13 * p < 0.05, ** p < 0.01, *** p ≤ 0.001
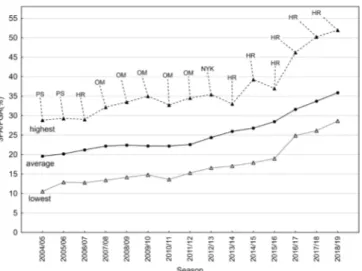
The biggest growth of 3PA/FGA (just over 3 p.p.) was between 2015/16 and 2016/17 seasons. Also between those two seasons results of teams with the highest and the lowest coefficients increased by respectively 9 p.p. and 6 p.p. (25% and 31%) (Figure 2).
Furthermore, there are statistically significant differences (p < 0.05) in between every pair of seasons taken into account if they varies from each other by at least 6 seasons. Moreover, there are statistically significant differences (p ≤ 0.001) in between every season from 2015/16 to 2018/19 and every season in between 2004/05 and 2011/12 (Table 1).
It is worth noticing that there are statistically significant differences (p ≤ 0.001) between 2018/19 season and all seasons between 2004/05 and 2012/13, then slightly smaller statistically significant differences (p < 0.01) between 2018/19 and 2013/14 seasons and the smallest possible statistical significance (p < 0.05) in between 2018/19 and 2014/15 seasons. Moreover, the average team from 2018/19 season has higher coefficient than every team with the highest 3PA/FGA until 2013/14 season. That shows how big the growth of role of three-point shot is over the course of recent years (Table 1, Figure 2).
Discussion
One aspect of this study is to show that there are significant differences in 3PA/FGA between seasons and that role of the three-point shot is increasing. That
was examined and presented results give clear statement that is fact. The other topic are reasons for growth of frequency of three-point field goals and impact of 3PA/ FGA on the result of basketball games.
It is worth mentioning that since 2004/05 season every team with the highest 3PA/FGA coefficient in particular season has won at least as many games as lost, with average winning rate of 66% (almost two third games won by that team). Teams with the highest 3PA/FGA who were at the top of this coefficient’s classification for two or more consecutive seasons were examined more precisely to find out impact of 3PA/FGA on results of basketball games.
First of all, there was Phoenix Suns (2004-2006) who won respectively 62 and 54 games (from 82) in those two seasons and was coached by Mike D’Antoni [2]. That Suns’ team played with the fastest pace in league in that particular seasons and combining that with many three-point specialists on the team they were pioneers in attempting many more three-point shots than other teams. It is worth noticing that in 2018/19 season 29 of 30 teams had higher 3PA/FGA coefficient than Suns’ team from 2004/05 season. Then there was Orlando Magic (2007-2012) who had many specialists in shooting three-point field goals. They won at least 52 games (from 82-game seasons) in every season they led the league in 3PA/FGA(%), but their highest result (35%) is still smaller than value of 3PA/FGA for average team from 2018/19 season. Comparing those two teams who had the highest 3PA/FGA before with result of teams in most recent season shows how massive the growth of role of three-point field goal was in a span of 15 years. Most recently there is Houston Rockets (2013-2019) with Daryl Morey as general manager. Morey trusts analytical methods and tries to build a team relying on three-point shots because that should give more points to his team [9]. Furthermore, since 2016 Rockets are coached by Mike D’Antoni who was mentioned earlier as Suns’ coach from 2004 to 2006. Since then 3PA/FGA coefficient has grown rapidly for Rockets – starting from 9 p.p. jump (from 37% to 46%) when D’Antoni took over the team, to 3PA/FGA equals to a little over 50% and almost 52% respectively in two most recent seasons (Figure 2). Moreover, Rockets had almost 10 p.p. higher 3PA/FGA coefficient than team with the second highest result in that coefficient during 2018/19 season.
What is worth noticing, in 2015/16 season Rockets, who won 41 games that season, were a team with the highest 3PA/FGA, but close behind them there were Golden State Warriors who made the most three-point field goals in the NBA that season, were second in 3PA/FGA and had the Note: PS – Phoenix Suns, HR – Houston Rockets, OM – Orlando
Magic, NYK – New York Knicks
Figure 2. Changes of 3PA/FGA(%) coefficient in the NBA
in between 2004/05 and 2018/19 seasons for teams with the highest, average and the lowest 3PA/FGA(%) every given season
best regular season’s record 73-9 (73 wins, 9 loses) in NBA history. Warriors were led by Stephen Curry, who had himself the best shooting season in NBA history as he made 402 three-point shots in that particular regular season. It is worth mentioning that the biggest growth of 3PA/FGA coefficient in span of 15 years taken in consideration happened after this spectacular season by Warriors as their result in that season was example of successful application of offense heavily relying on three-point shots and inspired others to build team in similar style of play to their team.
However, it is observed that teams with second highest result of 3PA/FGA won 54% of games, much less than teams with the highest result (66%) and even less than ninth and fifteenth highest result of 3PA/FGA (respectively 60% and 56% winning rate). It is also worth mentioning that there are examples of teams who won many games in regular season despite not being at top of 3PA/FGA. One of that team were San Antonio Spurs in 2015/16 season who had 67 wins and sixth lowest 3PA/FGA in the league this particular season. It shows that teams can win many games despite not relying on three-point shots as much as other teams and 3PA/FGA is not always decisive factor when it comes to result of basketball games.
It is worth noting that when three-point field goal attempts are used more often, their impact on results of game is bigger. Impact on results of game by 3PA/ FGA was examined in between 2015/16 and 2017/18 NBA seasons [21] and results showed that teams having a value of 3PA/FGA more than 55% given game won over 78% of those games and teams who had 3PA/FGA in between 50% and 55% attempts coming from three-point shots in particular game, won over 58% of games. It suggests that bigger number of three-point field goal attempts increases a chance to win basketball game. Although the number of three-point field goal attempts have significant impact on results of basketball games, it is important to point out that they are not the most important factor to determinate winning team in basketball game according to study by Ibañez [8]. It is worth noting that this study only concerns three-point attempts and makes, but not 3PA/FGA coefficient, which could give different results. Moreover, this study based on junior championship in 1999, so it was not examined for professional league and it was before years taken in consideration in analysis which examined this trend in this particular paper. It is interesting how it looks with 3PA/FGA coefficient during different period of times (in between 2004/05 and 2018/19 seasons) and in the NBA (or at least in professional league), but
such studies were not found. That type of study would be helpful to confirm three-point field goals’ impact on result of basketball games in recent years.
Even though three-point field goals are not yet the most important factor in determining winner of basketball game, players’ ability to make three-point shots has an impact on offense not seen in the descriptive statistics. This becomes crucial in creating good offense in basketball as ability to consistently making three-point shots makes two-point shots easier and more efficient because defenders are not willing to help when players they defend are good three-point shooters and help would mean they allow open three-point field goal attempts for them.
This study was made based on NBA regular season games which might not be fully representative for all kind of basketball leagues, especially taking in consideration some differences in rules between NBA and other basketball leagues. Moreover, different results could be observed if playoff games were taken into account. That can be interesting topic to examine in another study.
Conclusions
In conclusion, this study shows that there is statistically significant growth of frequency of attempting three-point field goals in the NBA. It was also presented that many successful teams in recent years used three-point shots as important part of their game plan and three-point shot has an impact on result of basketball games. Observation of how other successful teams are built and using more analytics tools are probably the reason for increasing role of three-point shots in whole NBA league. Basketball fans and experts since more than a decade can see how big is difference between approach to the game back then and now. The question is how role of three-point field goals will look in the future – is increase going to stop and if so, when and why? Also the question is – will rules concerning three-point shots change? There are many suggestions like moving three-point line further or maybe even create four-three-point field goals. Thinking about changing basketball rules due to increasing number of three-pointers just confirms that three-point shot became very important part of basketball despite the fact that at the beginning it wasn’t considered as a thing that could change approach to the basketball.
References
1. Belk JW, Marshall HA, McCarty EC, Kraeutler MJ. The effect of regular-season rest on playoff performance
among players in the National Basketball Association. Orthop J Sports Med. 2017; 5(10).
2. Davis S. The coach who designed the offense that changed the NBA nearly failed before he started. Business Insider. 2017 Dec 3. Retrieved Nov 18, 2019, from: https://www. businessinsider.com/mike-dantoni-offense-shaped-nba-2017-11.
3. Drakos MC, Domb B, Starkey C, Callahan L, Allen AA. Injury in the National Basketball Association: a 17-year overview. Sports Health. 2010; 2(4): 284-290.
4. Goldsberry K. How mapping shots in the NBA changed it forever. FiveThirtyEight. 2019 May 2. Retrieved Nov 18, 2019, from: https://fivethirtyeight.com/features/ how-mapping-shots-in-the-nba-changed-it-forever/. 5. Goldsberry K. The NBA is obsessed with 3s, so let’s
finally fix the thing. ESPN. 2019 Apr 30. Retrived Nov 18, 2019, from: https://www.espn.com/nba/story/_/ id/26633540/the-nba-obsessed-3s-let-fix-thing.
6. Haberstroh T. Lies, damned lies and statistics: the confusing analytics of the NBA’s 3-point obsession. NBC Sports. 2019 Dec 6. Retrieved Nov 18, 2019, from https://www.nbcsports.com/philadelphia/nba-insider-tom- haberstroh/lies-damned-lies-and-statistics-confusing-analytics-nbas-3-point.
7. Ibañez SJ, Garcia-Rubio J, Gomez MA, Gonzalez-Espinoza S. The impact of rule modifications on elite basketball teams’ performance. J Hum Kinet. 2018; 64: 181-193.
8. Ibañez SJ, Sampaio J, Buñuel P, Giménez Fuentes-Guerra J, Janeira M. Game statistics discriminating the final outcome of Junior World Basketball Championship matches (Portugal 1999). J Hum Mov Stud. 2003; 45: 001-019.
9. Kram Z. The 3-point boom is far from over. The Ringer. 2019 Feb 27. Retrieved Nov 18, 2019, from: https:// www.theringer.com/nba/2019/2/27/18240583/3-point-boom-nba-daryl-morey.
10. Mather V. How the N.B.A. 3-point shot went from gimmick to game changer. NYTimes. 2016 Jan 20, B: 15.
11. Meng A. How the three-point line changed the NBA and the game of basketball. NYC Data Science Academy. 2018 Nov 5. Retrieved Nov 18, 2019, from: https:// nycdatascience.com/blog/r/how-has-the-three-point-line-changed-the-nba-and-the-game-of-basketball/. 12. Moxley JH, Towne TJ. Predicting success in the National
Basketball Association: stability & potential. Psychol Sport Exerc. 2015 Jan; 16(1): 128-136.
13. Pluta B, Andrzejewski M. Analysis of team sports results based on the European basketball men’s championships. Trends Sport Sci. 2018; 1(25): 21-27.
14. Pluta B, Andrzejewski M, Lira J. The effects of rule changes on basketball game results in the men’s European Basketball Championships. Hum Mov Sci. 2014; 15(4): 204-208.
15. Pollard R, Pollard G. Long-term trends in home advantage in professional team sports in North America and England (1876-2003). J Sports Sci. 2005; 23: 337- -350.
16. Sahrom S, Chen S, Tan F, Kong PW, Lee M. Short-term influence of rule changes on match characteristics in water polo. JPES. 2018; 72(1): 503-511.
17. Shea S. The 3-point revolution. ShotTracker. 2018. Retrieved Nov 18, 2019, from: https://shottracker.com/ articles/the-3-point-revolution.
18. Starkey C. Injuries and illnesses in the National Basketball Association: a 10-year perspective. J Athl Train. 2000; 35(2): 161-167.
19. Teramoto M, Cross CL. Importance of team height to winning games in the National Basketball Association. Int J Sports Sci Coa. 2017; 13(4): 559-568.
20. Wood R. The history of 3-pointer. USA Basketball. 2011 Jun 15. Retrieved Nov 18, 2019, from: https://www.usab. com/youth/news/2011/06/the-history-of-the-3-pointer. aspx.
21. Zhu A. Three is greater than two. Sports Analytics Group Berkeley. 2019 Jan 7. Retrieved Nov 18, 2019, from: https://sportsanalytics.berkeley.edu/articles/nba-threes. html.