Received: 28 January 2020 Accepted: 4 July 2020
Corresponding author: ioannimd@phed.auth.gr
1 Aristotle University of Thessaloniki, Department of Physical
Education and Sports Sciences, Laboratory of Evaluation of Human Biological Performance, Thessaloniki, Greece
2 Aristotle University of Thessaloniki, Department of Physical
Education and Sports Sciences, Laboratory of Sports Medicine, Thessaloniki, Greece
3 Charles University, Faculty of Physical Education and Sport,
Prague, Czech Republic
MIMIKOS DIMITRIOS ZACHARIADIS1, NIKOLAOS KOUTLIANOS2, YIANNIS MICHAILIDIS1, ATHANASIOS MANDROUKAS3, LAZAROS VARDAKIS1, GEORGE MAVROMMATIS1, KOSMAS CHRISTOULAS1, THOMAS METAXAS1
Are the field tests related to the match running distance
and the technical performance in young soccer players?
TRENDS
in
Sport Sciences
2020; 27(3): 133-140 ISSN 2299-9590 DOI: 10.23829/TSS.2020.27.3-3 IntroductionS
occer is an intermittent-type of sport that incorporates actions with low and high intensity and duration. Mohr, Krustrup, and Bangsbo [18] mentioned that in a soccer match, elite players cover a total distance of 9-12 km. Moreover, a player can perform more than 1350 intense activities during a match [18]. Aerobic and anaerobic capacities are therefore crucial for the actions of a soccer player, who wants to be successful.Abstract
Introduction. A lot of studies have demonstrated the relationships between filed tests and match running performance in soccer players, but the impact of anthropometric characteristics and physical performance on technical abilities remains unclear. Aim of Study. The aim of this study was to examine the influence of physical performance on the technical abilities and match running performance of 20 young soccer players (U15) during soccer games. Material and Methods. Anthropometric profile, sexual-maturity assessment and physical performance tests (sprint tests, countermovement jump, squat jump, standing-long jump, multiple 5-bound test, sit & reach test, change of direction, and Yo-Yo intermittent endurance test level 1 – IE1) were conducted 3 weeks before the first of 10 soccer matches. Technical performance was determined by the frequency of actions during the 10 soccer games. Distance covered during matches was recorded using GPS devices. Results. The distance covered at speeds of 15.8-19.7 km/h correlated with performance in the long jump and Yo-Yo test (r = 0.49, P = 0.034, and r = 0.59, P = 0.008, respectively). The distance covered at higher speeds (19.8-24 km/h) correlated with performance in squat jump test and Yo-Yo test (r = 0.49, P = 0.032, and r = 0.50, P = 0.030, respectively). Factor analysis identified three technical actions of the highest importance: total activity, possession game, and attempts for goal. Multivariate canonical correlation analysis, used to verify the prediction of a multiple dependent variable set from field tests, showed that our model was not well adjusted. Conclusions. The current data suggest that the selected set of independent variables might not be useful in predicting technical performance in young soccer players. When we have the opportunity to select a young soccer player we have to use many fitness, technique, tactical and psychomotor tests to evaluate him. However, the Yo-Yo IE1 test was correlated to
match running performance so it can be used by the trainers to predict match running performance of their young players. KEYWORDS: soccer, running performance, anthropometry, technical actions.
Soccer performance depends on technical and tactical skills, though it is frequently used as a criterion for talent identification [16]. Many researchers have mentioned that players who managed to play at the elite level were more technically competent [8] and teams who longer maintained possession of the ball were more likely to be successful [15]. Some of these technical and tactical skills are the following: first touch, one-versus-one ability, striking the ball, and technique under pressure [16]. Soccer performance, besides mentioned physiological, technical, and tactical qualities, is in all age categories associated with psychological and sociological influences [9].
Valid information about a player’s capacity can be obtained by applying objective and qualified tests. Many teams prefer field tests (like Yo-Yo) because they are easy to perform, they do not need expensive equipment and specialized staff to execute and are considered as a sustainable alternative for laboratory tests [13, 21]. The evolution of technology allows trainers to measure the distances covered by the players at different intensities during a match [1].
Numerous studies have demonstrated the relationships between filed tests and match running performance in soccer players [3, 4, 23]. In particular, Bradley and Noakes [3] mentioned positive correlations between the performance in the Yo-Yo intermittent endurance test 2 (IE2) test and the match running performance. These studies observed that the Yo-Yo IE2 test is not only related to match performances but can also differentiate between dissimilar intensities [3]. Similar correlations between distances covered at high intensity running and the Yo-Yo intermittent recovery test level 1 were reported by several researchers [4, 23]. Other factors that are correlated with the match running performance are the change of direction (Zig-Zag test), the peak running speed in a field test, and the mean sprint time in repeated anaerobic sprint test (RAST) [21, 23].
The researchers tried to find correlations between physical fitness tests (like Yo-Yo) and match running performance because that may help the trainers estimate their players’ match running performance in an easy and fast way. Additionally, when repeated, this test could be used to assess the changes induced by training programs. Furthermore, finding field test correlating to match running performance would be of interest for soccer coaches as a tool for monitoring the players’ progress and possible talent identification.
A few studies have mentioned the correlation of fitness filed tests with technical performance in specific technical tests [2, 11]. In a recent study, the influence
of physical factors (hormonal status, sexual maturity, anthropometric profile, and physical performance) on the technical performance of young soccer players during small-sided games was examined [20]. The researchers found that the testosterone level was the most affecting factor for technical performance.
Because there is a particular need to find the universal fitness filed test correlating with match running and technical performance the aim of this study was to examine how the physical performance features (obtained with field tests) relate to match running performance and the technical abilities (obtained during 10 soccer games) in 20 young soccer players. Furthermore, we investigated whether the performance in field tests can explain the running and the technical performance during actual matches. It was hypothesized that a higher level of physical performance would be related to a better match running and technical performance.
Material and Methods
Subjects
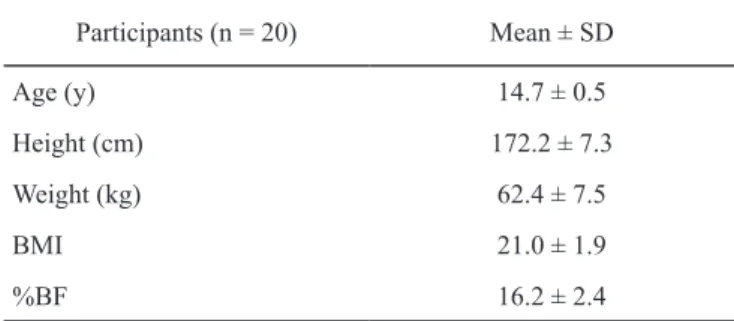
Twenty young soccer players (U15) from a local soccer academy participated in this study. These players were field players who were in the starting squad and who were playing a full match. The inclusion criteria to participate in the study were as follows: 1) not to have musculoskeletal injuries for ≥6 months prior to the study, 2) not to be early and late pubertals, 3) having participated in ≥95% of training sessions of the year, and 4) not to be taking any medication. All participants and their parents were informed about the potential risks and benefits of the study and a consent form was signed by their parents. The local Institutional Review Board approved the study, in the spirit of the Helsinki Declaration. Participants’ characteristics are shown in Table 1.
Table 1. Participants’ characteristics (mean ± SD)
Participants (n = 20) Mean ± SD Age (y) 14.7 ± 0.5 Height (cm) 172.2 ± 7.3 Weight (kg) 62.4 ± 7.5 BMI 21.0 ± 1.9 %BF 16.2 ± 2.4
Note: %BF – percentage of body fat, BMI – body mass index Body mass was measured to the nearest 0.1 kg using an electronic digital scale with the participants in
their underclothes and barefoot. Standing height was measured to the nearest 0.1 cm (Seca 220e, Hamburg, Germany). Body fat percentage was estimated based on the sum of four skinfolds (biceps, triceps, suprailiac, subscapular). Skinfold thickness was measured with a specific caliper (Lafayette, Ins. Co., Indiana) on the right side of the body as previously described [29]. The estimation of body density was calculated according to the Durning and Rahaman [6] equation for males under the age of 16 and estimated by the equation of Siri [28]. The chronological age at peak height velocity (PHV) of the players was estimated using the equation proposed by Moore et al. [19]. Early, average and the late matures were defined as those players with an estimated chronological age at PHV of less than 13 years of age, 13-15 years of age, and over the age of 15, respectively [26].
Methods
Fitness assessment (countermovement jump [CMJ], squat jump [SJ], long jump [LJ], multiple 5-bound test [M5B], speed [10 m & 30 m runs], change of direction [T-test], Yo-Yo intermittent endurance test level 1 [YY IET1]) were the independent variables of the study. The match running distance and the technical performance features were the dependent variables. The study was conducted during the beginning of the in-season period for 13 weeks. Particularly, the first 3 weeks were at the end of the pre-season period. The first week was the participant’s familiarization with the field tests to minimize the learning effect error. During the second and third weeks, the appropriate field tests were performed. Later in the following 10 weeks, the players participated in 10 actual matches (in season). The tests were conducted 48 hours after any last training session. At the beginning of each testing session, soccer players performed a 15-minute warm-up and at the end a 10-minute cool-down period. During the 10 weeks of the matches, all the participants competed in 10 matches and participated in 4 training sessions per week. The training session included soccer technical skills, tactics, speed and sprint workloads, and small-sided games. The total sessions’ duration was approximately 90 minutes. All training sessions and matches were performed on a synthetic grass soccer field. The participants consumed water ad libitum to ensure proper hydration during training and testing and they did not intake any nutritional supplements or the ergogenic aids.
Speed testing
A 30-m sprint test with 10-m splits (0-10 m was measured as well) was used to measure speed performance. Sprint
testing was performed with the participants wearing soccer shoes on a synthetic grass soccer field. After a 5-second countdown, the participants ran in front of 3 infrared photoelectric gates (Microgate, Bolzano, Italy) that recorded their time at each gate. The participants sprinted from a standing starting position with the toe of the front foot approximately 0.3 m behind the first gate. Photocells were placed 0.6 m above the ground (approximately at the hip level) to capture the movement of the trunk rather than a false signal because of limb motion. The coefficient of variation for test-retest trials was 3.4% [17].
Standing long jump test
The participants began the test with a starting standing position with their feet at shoulder width (behind a line marked on the ground) and their hands free. The participants executed a countermovement of their legs and hands and then jumped horizontally as far as possible [14]. The horizontal distance between the starting line and the heel of the rear foot was recorded with a tape measure. The coefficient of variation fortest-retest trials was 2.5%.
Multiple 5-bound test
The participants, from a standing position, attempted to cover the longest possible distance with 5 forward jumps and alternating left and right leg contacts [17]. This test is considered to be a soccer-specific test, and it has been recommended for the measurement of lower limb muscle power and coordination instead of the vertical jump (VJ) test [5]. The maximal distance covered was recorded to the nearest 0.5 cm with a tape measure. The coefficient of variation for test-retest trials was 3.1%.
Vertical jump test
The participants performed two jump tests: (a) squat jump: participants, from a stationary semi-squatted position (90° angle at the knees) performed a maximal VJ, and (b) countermovement jump: participants, from an upright standing position, performed a fast preliminary motion downwards by flexing their knees and hips followed by an explosive upward motion by extending their knees and hips. All tests were performed with the arms akimbo. The VJ height was measured with Myotest equipment (Myotest, Switzerland). The coefficients of variation for test-retest trials were 2.8% and 3.8% in SJ and CMJ, respectively.
Change of direction test
The participants performed the T-test: subjects began with both feet behind the starting point A. At their
discretion, each subject sprinted forward 9.14 m to point B and touched the base of a cone with the right hand. Then, they shuffled 4.57 m to the left and touched the base of a cone (C) with their left hand. Subjects then shuffled 9.14 m to the right and touched the base of a cone (D) with their right hand. Afterward, they shuffled 4.57 m to the left back to point B and touched the base of the cone with their left hand. Finally, subjects ran backward, passing the finish line at point A. An infrared photoelectric gate (Microgate, Bolzano, Italy) was placed at point A and recorded the time of each attempt [25].
Yo-Yo intermittend endurance test level 1
The Yo-Yo intermittend endurance test level 1 consists of repeated 20-m runs back and forth between the starting, turning, and finish lines at a progressively increased speed, which is controlled by audio beeps from a CD-player. When the subject failed twice to reach the finish line in time, the athlete stopped the test and the distance covered was recorded as the test result.
Video analysis
Video recordings of the soccer match were collected using a fixed camera (Sony, Brazil, 60 Hz frequency acquisition). The camera was located 10 m above and to one side long axis of the pitch. The Sport scout software was used for video analysis. The study was based on the two researcher’s observations according to Singer and Willimczik [27]. Every match has been analyzed by two experienced observers who were specially trained for accurate and reliable data recording [27]. The kappa values for the analyzed variables ranged from 0.92 to 0.98 (intra-observer) and 0.85 to 0.95 (inter-observer). The applied technical actions have been described in a previous study [20].
Global Positioning System (GPS) analysis
To measure match performance, players wore 15-Hz GPS units (LAGALACOLLI Sport, Roma, Italy) positioned on the upper torso through a vest garment to reduce movement artifacts [10]. Units were activated according to the manufacturer’s guidelines immediately before the pre-match warm-up. Players wore the same GPS device for each match to avoid any existing interunit variation. Afterward, the match data were analyzed and 6 speed indices for each half and the total match were used (0.1-5.99 km/h – walking, 6-11.9 km/h – jogging, 12-15.7 km/h – running, 15.8-19.6 km/h – high intensity running, 19.7-23.7 km/h – fast running, 23.8+ km/h – sprint).
Statistical analysis
All the statistical analyses were conducted using SPSS (version 24.0; SPSS Inc., Chicago, IL, USA) and the results are reported as mean ± SD. Shapiro–Wilks test was used to ascertain the normal distribution of the sample. Initially, factor analysis was used to identify the structure of relationships among the technical performance measurements to examine whether it would be possible to reduce the number of variables without compromising information. The most representative variables could be used in the subsequent canonical analysis. This analysis was used to examine the prediction of multiple dependent variables (the most representative technical performance measurements extracted from the factor analysis) from multiple independent variables (physical performance). Finally, Pearson’s correlation method was used to examine the relationship between physical and technical performance tests with the match running performance. The level of significance was set at P < 0.05.
Results
Descriptive statistics (mean ± SD) of the field tests and the match running performance are presented in Table 2.
Table 2. Descriptive statistics of the field tests and the match
running performance in young soccer players
Variables Mean ± SD Sprint 10 m (s) 1.95 ± 0.12 Sprint 30 m (s) 4.67 ± 0.27 CMJ (cm) 27.8 ± 4.3 SJ (cm) 27.1 ± 5.3 LJ (cm) 209.3 ± 19.2 M5B (m) 10.70 ± 0.97
Sit & reach test (cm) 28.1 ± 8.2
Yo-Yo IE1 test (m) 1031 ± 418
Match running performance
Match TD (m) 7219 ± 682 Distance (0-5.99 km/h) (m) 2907 ± 297 Distance (6-11.8 km/h) (m) 2311 ± 602 Distance (11.9-15.7 km/h) (m) 1476 ± 322 Distance (15.8-19.7 km/h) (m) 547 ± 140 Distance (19.8-24 km/h) (m) 235 ± 86 Distance (>24 km/h) (m) 58 ± 58
Note: CMJ – countermovement jump, SJ – squat jump, LJ – stan-ding long jump, M5B – multiple 5-bound test, Yo-Yo IE1 test – Yo-Yo intermittent endurance test level 1, TD – total distance
The results of the Yo-Yo IET1 and long jump were correlated with the distance covered at a speed of 15.8- -19.7 km/h (r = 0.49, P = 0.034, and 0.59, P = 0.008, respectively). The distance covered in higher velocity (19.8-24 km/h) was correlated with the Yo-Yo IET1 (r = 0.50, P = 0.03) and SJ (r = 0.49, P = 0.032). No significant correlations were found between the other field tests and other variables of the match running performance.
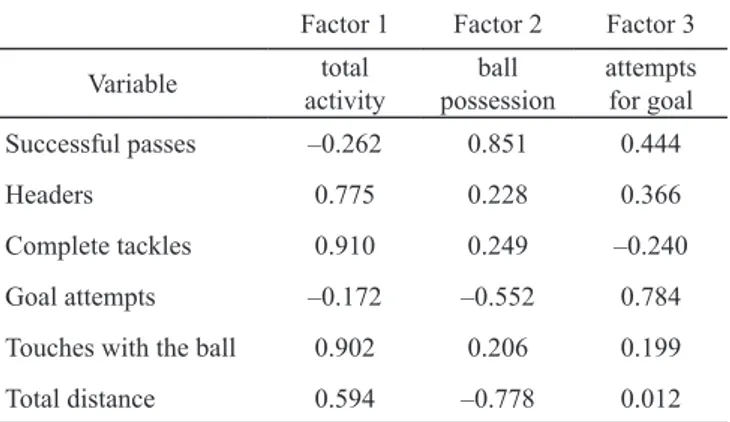
As shown in Table 3, the factor analysis showed that three factors explain 92% of the total variance: 1st total activity 45%, 2nd ball possession (keeping the ball in teams’ possession using passes) 30%, and 3rdattempts for goal 17%.
Table 3. Results of factor analysis with factor loadings
Factor 1 Factor 2 Factor 3 Variable activitytotal possessionball attempts for goal Successful passes –0.262 0.851 0.444
Headers 0.775 0.228 0.366
Complete tackles 0.910 0.249 –0.240
Goal attempts –0.172 –0.552 0.784
Touches with the ball 0.902 0.206 0.199
Total distance 0.594 –0.778 0.012
The relation of the above three factors with the field tests was examined with the use of multivariate canonical correlation analysis. The variables with higher loading of each factor were retained for analysis. However, the adjustment of our data to the statistical model was not evidently good.
Discussion
This is the first study that simultaneously tests the correlation between field tests and technical and running performance during actual matches. The findings show that the Yo-Yo test and vertical jumps (SJ and CMJ) were correlated with the distance covered by young players at speeds between 15.8-24 km/h. However, no other correlations were observed between field tests and technical performance.
Soccer is an intermittent sport with low, medium, and high intensity demanding workouts, including accelerations, decelerations, jumps, and change of direction. However, the duration of a game and its requirements also demand a high level of aerobic capacity. The Yo-Yo tests are used extensively to estimate aerobic capacity
in the field. A potentially strong relationship between performance measured in a field test and the match running performance would help coaches to assess the level of readiness of their players to compete. Many studies have looked into the correlations between match running performance and aerobic performance during specific tests [3, 4, 11]. The aerobic field tests commonly used were the Yo-Yo tests. In particular, Bradley and Noakes, in their study [3] mentioned positive correlations between the Yo-Yo IE2 test and the match running performance. The observed correlation was between the field test performance and the total and high-intensity running distance covered in a match. Similar results were mentioned from another group of researchers [23] who found significant relations of Yo-Yo IR1 test performance with the total and high-intensity running in soccer players. In another study by Castagna et al. [4] correlations between the Yo-Yo IR1 test and the multistage fitness test with several match physical activities (high-intensity running and sprinting) were showed whereas the performance in the Hoff test correlated only with sprint distance. This and most of the above studies reported correlations between performances in various field tests with match running performance. It should be noted that minor differences between investigations are due to the use of different field tests, the GPS systems, or the video analysis system. Besides, the age of young soccer players and the level of biological maturation can also affect the above relationships. Therefore, before generalizing the findings, it would be of interest to perform a more complex study in differentage groups with a similar methodology.
To our knowledge, only three studies have looked into the relationships between anaerobic field tests and match running performance. Rampinini et al. [21] mentioned significant correlations between the ability of the repeated sprint test and the match running performance (very high intensity running and sprinting) whereas no correlations were found with the vertical jump performance. Similar results have been presented by another laboratory [1] which found that the performance in the running-based anaerobic sprint test was significantly correlated with the distance covered at medium intensity running. In contrast to a recent study, the researchers mentioned no correlations between the repeated sprint test and the match running performance [24]. One possible explanation for this dispute could be the fact that the study of Redkva et al. [24] was performed during friendly soccer matches and not official ones. In our study, we found correlations between two kinds of
jumps with high intensity running. As above, the use of different tests and differences in the sample (level, age, type of matches – friendly or official) can affect the results of the studies. The repeated sprint test activates a different energy supply mechanism than jumps (glycolysis vs phosphagen system). The jumps are used by the coaches to assess the jumping ability and the power of the players. Therefore, the good jumping ability also implies a high ability to run at a very high speed. Additionally, the phosphagen system supplies energy actions that are as intensive as jumps. High-intensity running is an action where a significant part of the energy is supplied by the same energy system. Therefore, a well-trained phosphagen energy system could increase the ability of a soccer player to cover a longer distance at high intensity.
It is known that sample homogeneity could affect the results in correlation studies [12]. We have to be careful when we want to generalize the findings of the study. However, similar results for the Yo-Yo IR1 and Yo-Yo IE2 tests were also mentioned by previous researchers [23] in soccer players of a similar age and at a competitive level. This indicates that the Yo-Yo IE1 test is probably an appropriate test to estimate aerobic capacity in young soccer players.
In any sport that requires object handling, the technique is a determining performance factor. Thus, in soccer, the technical skill of handling the ball is particularly important and has been the object of research in several studies. Over the past two decades, researchers have focused on the possible relationship between technical abilities and performance obtained in fitness tests. Previous studies [21, 22] showed that players of better teams performed more passes than players of the worst teams during official matches. Also, the numbers of passes were decreased in the second half and this could be a sign of the influence of physical performance on technical actions [7]. Rampinini et al. [22] showed that the deterioration in the Loughborough soccer passing test (LSPT) score was correlated with performance in the Yo-Yo IR1 test. This finding suggested that players with a higher fitness level performed technical actions more correctly than the players with a lower fitness level [2]. Helgerud et al. [11] studied the effect of a training program on the passing ability of soccer players. They found that the improvement of physical fitness led to an increased number of involvements with the ball. In a more recent study [2], researchers mentioned that the total performance at LSPT was positively correlated with many fitness tests (sprint 5 m, 20 m, 30 m, agility – 15 m, ball – 15 m, Illinois agility test). Negative correlations
were found between LSPT and SJ and CMJ. All the above studies used field tests for the evaluation of technical performance changes. In our study, we looked into the correlations between performance in field fitness tests and the technical performance during actual soccer matches of young players. Our results are in line with the results of a recent study [20] where researchers used small-sided games and found no correlations between field tests and technical performance. The performance in a specific technical test cannot be compared to the technical performance in an actual soccer match, where the tactical role, individual playing position, the quality of the opponent, and the degree of motivation can affect this factor.
This study indicates that the performance in the Yo-Yo IE1 test and LJ test are good predictors of the intensive match running (15.8-19.7 km/h). Additionally, the Yo-Yo IE1 test and SJ could be used by the coaches to estimate match running performance in higher velocity 19.8-24 km/h.
Conclusions
The results have shown that the majority of field tests were not related to the match running performance in young soccer players. Contrary to the study hypothesis, no anthropometric index was associated with better performance in the soccer game. Also, no fitness indicator was fully correlated with the match running distance and with the technical performance during the game. However, the Yo-Yo IE1 test, LJ, and SJ were the tests that correlated with the distance covered thigh intensity. Additionally, these tests could be used by trainers in an attempt to estimate the readiness of young soccer players to compete.
These findings indicate that the technical performance of young players in actual soccer matches is not correlated with their performance in field fitness tests. According to the UEFA development plan of the young soccer players, players of this age have not perfected yet their technical skills. Additionally, the tactics, the opponent, the adopted style of play could influence the match technical performance. Therefore, in our opinion, more specific technical tests are needed for the evaluation of this kind of performance.
In the last minutes of the games, fatigue can negatively affect the qualitative performance of the technical actions (passes, crosses). For that reason, an analysis where technical actions would be studied every 15 minutes of the game could provide more information on the possible relationship of fitness and execution of technical actions.
Conflicts of Interest
The authors declare no conflict of interest. References
1. Aquino R, Palucci Vieira LH, de Paula Oliveira L, Cruz Gonçalves LG, Pereira Santiago PR. Relationship between field tests and match running performance in high-level young Brazilian soccer players. J Sports Med Phys Fitness. 2018;58(3):256-262.
2. Benounis O, Benabderrahman A, Chamari K, Ajmol A, Benbrahim M, Hammouda A, et al. Association of short-passing ability with athletic performances in youth soccer players. Asian J Sports Med. 2013;4(1):41-48.
3. Bradley PS, Noakes TD. Match running performance fluctuations in elite soccer: indicative of fatigue, pacing or situational influences? J Sports Sci. 2013;31(17):1627- -1638.
4. Castagna C, Manzi V, Impellizzeri F, Weston M, Barbero Alvarez JC. Relationship between endurance field tests and match performance in young soccer players. J Strength Cond Res. 2010;24:3227-3233.
5. Diallo O, Dore E, Duche P, Van Praagh E. Effects of plyometric training followed by a reduced training programme on physical performance in prepubescent soccer players. J Sports Med Phys Fitness. 2001;41:342-348. 6. Durning S, Rahaman M. The assessment of the amount
of fat in the human body from measurements of skinfold thickness. Br J Nutr. 1967;21:681-689.
7. Enoka RM, Stuart DG. Neurobiology of muscle fatigue. J Appl Physiol. 1992;72:1631-1648.
8. Figueiredo AJ, Gonçalves CE, Coelho Silva MJ, Malina RM. Characteristics of young soccer players who drop out, persist or move up. J Sports Sci. 2009;27(9):883- -891.
9. Güllich A. Selection, de-selection and progression in German football talent promotion. Eur J Sport Sci. 2014;14(6):530-537.
10. Harley JA, Barnes CA, Portas M, Lovell R, Barret S, Paul D, et al. Motion analysis of match-play in elite U12 to U16 age-group soccer players. J Sports Sci. 2010;28:1391-1397.
11. Helgerud J, Engen LC, Wisløff U, Hoff J. Aerobic endurance training improves soccer performance. Med Sci Sports Exerc. 2001;33:1925-1931.
12. Hopkins WG. Measures of reliability in sports medicine and science. Sports Med. 2000;30:1-15.
13. Impellizzeri F, Rampinini E, Marcora S. Physiological assessment of aerobic training in soccer. J Sports Sci. 2005;23:583-592.
14. Ingle L, Sleap M, Tolfrey K. The effect of a complex training and detraining programme on selected strength
and power variables in early pubertal boys. J Sports Sci. 2006;24:987-997.
15. Lago-Peñas C, Dellal A. Ball possession strategies in elite soccer according to the evolution of the match-score: the influence of situational variables. J Hum Kinet. 2010;25:93-100.
16. Larkin P, O’Connor D. Talent identification and recruitment in young soccer: recruiter’s perceptions of the key attributes for player recruitment. PloS One. 2017;12(4):e0175716.
17. Meylan C, Malatesta D. Effects of in-season plyometric training within soccer practice on explosive actions of young players. J Strength Cond Res. 2009;23:2605- -2613.
18. Mohr M, Krustrup P, Bangsbo J. Fatigue in soccer: a brief review. J Sports Sci. 2005;23:593-599.
19. Moore SA, McKay HA, Macdonald H, Nettlefold L, Baxter-Jones AD, Cameron N, et al. Enhancing a somatic maturity prediction model. Med Sci Sports Exerc. 2015;47(8):1755-1764.
20. Moreira A, Massa M, Thiengo CR, Rodrigues Lopes RA, Lima MR, Vaeyens R, et al. Is the technical performance of young soccer players influenced by hormonal status, sexual maturity, anthropometric profile, and physical performance? Biol Sport. 2017;34(4):305-311.
21. Rampinini E, Bishop D, Marcora SM, Ferrari Bravo D, Sassi R, Impellizzeri FM. Validity of simple field tests as indicators of match-related physical performance in top-level professional soccer players. Int J Sports Med. 2007;28:228-235.
22. Rampinini E, Impellizzeri FM, Castagna C, Azzalin A, Ferrari Bravo D, Wisloff U. Effect of match-related fatigue on short passing ability in young soccer players. Med Sci Sports Exerc. 2008;40(5):934-942.
23. Rebelo A, Brito J, Seabra A, Oliveira J, Krustrup P. Physical match performance of young football players in relation to physical capacity. Eur J Sport Sci. 2014;14(Suppl 1):S148-S156.
24. Redkva PE, Paes MR, Fernandez R, da-Silva SG. Correlation between match performance and field tests in professional soccer players. J Hum Kinet. 2018;62:213- -219.
25. Semenick D. Test and measurements: the T-test. National Strength and Conditioning Association Journal. 1990;12(1):36-37.
26. Sherar LB, Mirwald RL, Baxter-Jones AD, Thomis M. Prediction of adult height using maturity-based cumulative height velocity curves. J Pediatr. 2005;147(4):508- -514.
27. Singer R, Willimczik K, editors. Sozialwissenschaftliche Forschungsmethoden in der Sportwissenschaft: eine
Einführung (Social science research methods in sports science: an introduction). Hamburg: Czwalina; 2002. pp. 29-51.
28. Siri WE. The gross composition of the body. Adv Biol Med Phys. 1956;4:239-280.
29. Slaughter MH, Lohman TG, Boileau RA, Horswill CA, Stillman RJ, Van Loan MD, et al. Skinfold equations for estimation of body fatness in children and youth. Hum Biol. 1988;60:709-723.