METHOD OF ORGANIZING OF THE DATA FLOW
IN BUSINESS ENTITY ON THE BASIS OF DATA FLOW
DIAGRAM AND THE THEORY OF QUEUES
Aliaksandr Liaushuk and Aleksandra Jasiak
Faculty of Engineering Management, Poznan University of Technology, Strzelecka 11, 60-965, Poznan, Poland, E-mail: aleksandra.jasiak@put.poznan.pl
Abstract: This article presents selected issues related to the elaboration of the method used to the
organization of data flow in the business entity with the assistance of data flow diagram and the theory of queues. The aim of this work is to create a method, to visualize processes in business entity in the form of data flow diagrams and to determine the weakest points in data flow in the business entity using the theory of queues as well as to propose solutions improving this process.
Paper type: Research Paper Published online: 31 January 2019 Vol. 9, No. 1, pp. 31–38
DOI: 10.21008/j.2083-4950.2019.9.1.3 ISSN 2083-4942 (Print)
ISSN 2083-4950 (Online)
© 2019 Poznan University of Technology. All rights reserved. Keywords: flow, data, information, theory of queues, business entity
1. INTRODUCTION
In this work authors concentrated on development of method organizing data flow in the business entity. In the elaboration there have been used data obtained in the medical laboratory in clinic hospital. Research concerns the disclosure of exist-ing organizational – technical dependencies of laboratory functionexist-ing under the in-fluence of technological as well as human and financial factors and finding the way of increasing effectiveness of its operation. In the analysed laboratory there are analysers (machines) that are operated by laboratory diagnosticians during one shift. These analysers are used for determination of quantitative and qualitative results of tested samples of biological material. The aim of the tests is designation of places where bottlenecks occur during the flow of samples through the labora-tory. Main process is the chain of chemical reactions that occur for example in blood samples depending on reagents in individual analysers. Reactions in clinic tests are biologically dependant and there is not much influence one may have on the time of their course. Analysers used in the laboratory are highly technological and the tests technologies are improving all the time. Development of the method should be directed on auxiliary processes and should start from time determination when during the day longest queues of samples appear for analyse and reasons causing queuing. Appearance of queues is signalizing irregular load of analysers and employees. Stabilisation of analysers load as well as rhythmicity of laboratory diagnosticians work increases effectiveness of analysers utilization, decreases reac-tion reagents use and number of incorrect tests (Liaushuk, 2017).
Person is not always able to meet the requirements posted by the machine thereby becoming a bottleneck. New generations of the machines appear and their functioning depends on mental fitness of a person. The role of human factors in production process increase. The aim of this article is to present a method that will help equalize the load of employees what should decrease negative influence of human factor on ongoing processes (Jasiak, 2015; Jasiak 1993).
The aim of this work is elaboration of the method thanks to which the flow of data could be organized in business entity on the example of clinic laboratory using data flow diagram and the theory of queues.
2. DESCRIPTION OF BUSINESS ENTITY
Business entities may be individuals and human teams having organizational - legal ability for business activity so therefore physical individuals, teams forming cells and organizational units, individual entrepreneurs, partnerships and commer-cial companies, state-owned enterprises, cooperatives etc. (Trocki, 2001). Common feature of all business entities is having a legal personality related to assigning them property and responsibility as well as the risk for the effects of their activity.
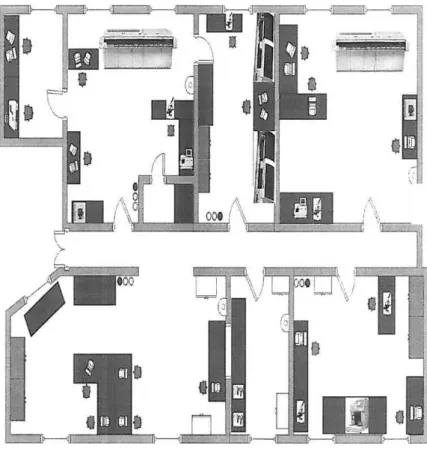
Business entity operating in the economy is referred to as an enterprise. In this study the role of an enterprise is played by a medical laboratory. In the laboratory under investigation there are 18 analysers (machines), which are operated by 8 laboratory diagnosticians during one shift. These analysers are used for determi-nation of quantitative and qualitative results of tested samples of blood, urine, ex-crement, liquids from body cavities, cerebral-spinal fluid. Laboratory is divided into specialized workshops of biochemistry, solidification, morphology etc. Below schematic visualization of the laboratory is presented.
Fig. 1. Scheme of the medical laboratory (own elaboration)
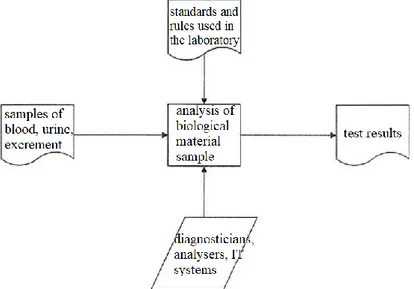
Medical laboratory activity may be described as the process of transformation of input data (blood samples etc.) into output data i.e. test results.
Fig. 2. Scheme illustrating laboratory activity in the form of general process (own elaboration) This work is concentrated on the analysis biological material flow through the medical laboratory in general as well as on the flow in individual workshops.
4. DATA FLOW DIAGRAM
One of the methods used at the stage of analysis serving for modelling of sys-tem functions is Data Flow Diagram (DFD). It shows the way data are flowing in the system as well as describes processes of data processing. Formation of the DFD diagram in based on the following conceptual categories:
• Process that means transformation of input data into result ones and corre-sponds to these system components which are processing data. Processes receive and transfer data through data flow.
• Data flow that describes data set flowing through two objects in the sys-tem.
• Data warehouse, otherwise data store serving for data storage in the form of homogenous collections.
• Terminator – an external object in the relation to the system representing information sources or places of destination (Ordysiński, 2017).
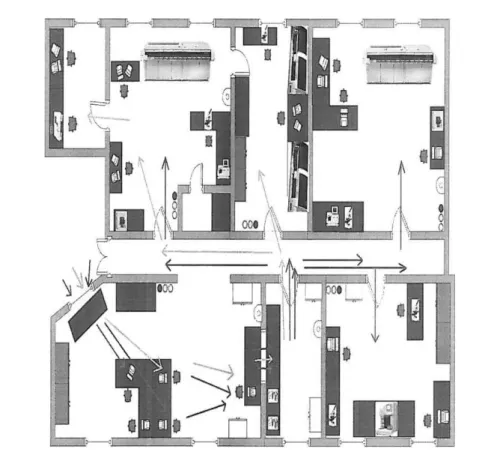
General diagram of processes occurring in the medical laboratory has been pre-sented in the form of data flow diagram. The role of terminator meets the client i.e. hospital department or a patient. Diagnostic laboratories perform the role of data warehouses.
Fig. 3. General scheme of medical laboratory DPD (own elaboration)
Analysing samples flow in the medical laboratory three most frequent blood samples may be distinguished.
These are blood samples with blue cork intended for the tests of coagulation system, samples with red cork are intended for biochemical parameters and blood samples with violet cork intended for hematology parameters. Flow of samples types in the medical laboratory is shown on below scheme.
In this article concentration has been made on detailed analysis of the biological material flow in the form of blood samples with blue cork. Based on the general scheme of processes taking place in the medical laboratory presented in the form of data flow diagram detailed data flow diagram has been created for the blood sam-ples with blue cork. The diagram includes all processes connected to sample flow in the laboratory starting from blood collection from the patient and finishing with test results.
Fig. 4. Scheme of three types of blood samples flow in the medical laboratory (own elabo-ration)
5. THEORY OF QUEUES
Theory of queues – field of mathematics dealing with analyse of systems in which queues occur. Theory of queues is the field connected to operational re-search, theory of probability, applied mathematics as well as telecommunication and informatics.
In the systems theory of queues is dealing with, orders (for example clients in supermarket) flow to the service point (cash desk) and wait to be served in waiting point (queue to the cash desk). It is usually accepted that the speed of clients flow is a random variable what causes that even service points theoretically serve clients faster than they flow in, the queues are created in the system. Queues result from the fact that in one moment clients do not appear in front of the cash desk at all while in another moment “double portion” of clients appear (Oniszczuk, 1995).
Having detailed description of processes occurring in the laboratory for the test tube with blue cork the next step is to analyse these processes in respect of queues formation. In this article test tubes with blood play the role of clients and individual departments of the laboratory such as registration or centrifugal laboratory play the role of cash desks.
Analysing credibility of queues formation in the registration, intensity of sam-ples with blue cork flow through the registration has to be calculated.
Where λ – flow intensity and M[T] – average time of registration of following samples. To calculate M[T] the information concerning the number of samples registered during one shift has to be known as well as how many hour the shift lasts.
The next step is determination of intensity of test tubes registration flow.
Where μ – intensity of registration flow and M – time of one sample registra-tion. Result obtained, 20 samples registered during an hour, will be used to calcu-late ρ – overload factor.
Three persons work in registration playing role of cash desks in our case.
Where Χ – relation of overload factor to the number of service canals. Having necessary data ρₒ – credibility that the sample will wait in the queue.
In similar way following steps in the sample with blue cork flow through the laboratory have been calculated. Using theory of queues places of bottlenecks dur-ing the flow of samples through the laboratory have been indicated what signifi-cantly facilitated organization and streamlining of general flow.
6. CONCLUSION
In this work authors presented an elaboration of the method using which the flow of data through the business entity may be organized. Method was used using clinical laboratory as an example. Using the data flow diagram processes that occur in the business entity have been described and specified. Using theory of queues the places where bottlenecks occur have been specified and the assumption that the load in the laboratory is not evenly distributed on individual fields of business en-tity has been reflected. These kind of methods are universal and are not limited for the use in medical laboratory only, similar way process may be analysed and bot-tlenecks indicated in the production process or service company. Stabilization of load as well as work rhythm increases effectiveness of resources utilization, de-creases material use and number of errors. Detailed description of the method will be presented in following articles.
REFERENCES
Jasiak A. (2015) Makroergonomia w projektowaniu systemów pracy i jakości życia, Wyda-wnictwo Politechniki Poznańskiej, Poznań.
Jasiak A. (1993) Kryterium czynnika ludzkiego w projektowaniu system wytwarzania. Wydawnictwo Politechniki Poznańskiej, Poznań.
Liaushuk A. (2017) Model optymalizacji procesówzachodzących w trakcie badań medycznych w laboratorium klinicznym. CreativTime. Kraków.
Lighthouse School (2013) Fusion Biomanagement Technology. Nord Chelmsford MA, USA. Oniszczuk W. (1995). Metody modelowania, Wydawnictwo Politechniki Białostockiej,
Białystok.
Ordysiński T., (2017). DFD – Diagram przepływu danych (Data Flow Diagram). Rogowsky (2018). Globalny raport techniczny Genesus Oakville, Kanada Trocki, (2001). Outsourcing. Polskie Wydawnictwo Ekonomiczne. Warszawa