S ł u p s k i e P r a c e G e o g r a f i c z n e 10 • 2013
Diana M. Burlibayeva Almas T. Tleukulov
Kazakh National Agrarian University Almaty
Christian Opp
Philipps University Marburg
Ivan Kirvel
Pomeranian University in Slupsk
CHANGES IN HYDRO-CHEMICAL REGIME
CHARACTERISTICS OF TRANSBOUNDARY ISHIM RIVER
ZMIANY W HYDROCHEMICZNYM REŻIMIE
CHARAKTERYSTYCZNYM DLA TRANSGRANICZNEJ
RZEKI ISZYM
Zarys treści: At the present time there are problems with water supplies to the city of Astana. The problems are related to the quality of water in the Ishim River. In the future, after com-missioning of the Satpayev Canal, this problem will become more serious due to the Irtysh River pollution. Because of it, considering the currently observed hydro-chemical regime of the Ishim and Irtysh rivers pollution, the following preventive measures to be taken in ad-vance to achieve proper quality of potable water in the city of Astana. Potable water quality shall be taken according to applicable norms and standards. Considering what has been set forth above, the present article is about hydro-chemical regime of the Ishim River.
Key words:hydro-chemistry, hydro-chemical regime, the Ishim river, Kazakhstan Słowa kluczowe: hydrochemia, reżim hydrochemiczny, rzeka Iszym, Kazachstan
Introduction
Ecology of the present time is a complex of different sciences, because environ-mental problems are very difficult, and include relations between systems of living organisms and inanimate nature.
Chemical processes are the basis of life, to control the dynamic equilibrium of the biosphere, it is necessary to know about chemical processes, occurring in differ-ent systems.
In the present time, hydro-chemical studies have become one of the most im-portant parts of environmental survey within domestic activities context. In its turn, water quality control, its future condition prediction, are the main aims of environ-mental protection policy.
Physical-geographical characteristics of the Ishim River basin
Relief. The Ishim river basin occupies the Western outskirts of Kazakh Upland.
The relief of the catchment area is diverse. There are mountains Niaz in the upper reaches of the basin, on the right bank there are southern slopes of Kokshetau emi-nence, in the South-West there are spurs of Ulutau Mountains.
The average Ishim River basin height before Astana is 460 m BS, below the city of Astana River enters into the plain. The left bank is flat, straight, slightly divided steppe, this section differs by relatively sparse network of temporal watercourses and logs, and by relatively small number of steppe lakes with salt and brackish wa-ter. The right bank part of the basin near the river is flat, and by removing from the river it gradually increases and passes in foothills of Kokshetau Upland. This part of the catchment area is characterised by a significant ruggedness of the surface of riv-ers’ and dry logs’ valley, and also by deep depth of cut of the river valleys.
A significant part of the catchment area of the basin is inactive. In upper part of the catchment area before Astana, about 25% of the area do not give runoff to the Ishim River. Below Astana the share of inactive area has been increased.
Climate. Main feature of the climate of the Akmola Region is sharp
continental-ity manifested in large amplitude of air temperature fluctuations, dryness of air and insignificant quantity of precipitation.
Air temperature. The average annual air temperature for the territory is from 0.5
to 1°C in the North and within the elevated areas it is to 2-2.5°C in the extreme South.
An intra-annual air temperature variation is characterized by sustainable strong frosts in winter, by intensive growth of heat in short spring season, and by heat during the long summer. The coldest month is January. The average temperature in January is from -18 to -19°С in the North, and in the southern part it is from -16 to -17°С. The absolute minimum of temperature in some years reaches from -50 to -51°C (January- February).
July is the warmest month, when the average air temperature of the region terri-tory ranges from 19 to 21°C. Absolute maximum of temperature reaches 40-43°С. Thus, the amplitude of oscillations of average monthly air temperature is about 40°С, the absolute amplitude exceeds 90°C.
The duration of warm period (average daily temperature is above 0°C) is 190-200 days.
Precipitation. The Akmola Region is a region with sharply insufficiency of
mois-ture. Annual amount of precipitation in the Northern part of the region is 300-350 mm, and in the South part it is 200 mm.
25-30% of the annual amount of precipitation in cold part of a year (November- March). During the warm season (April–October) in the Northern areas of the Akmola Region there is 200-220 mm of precipitation, while in the South it is 140-180 mm. Maximum precipitation usually occurs in July, and minimum – in Febru- ary-March, but quite often in December.
Duration of periods without rain is significant. The lack of precipitation is ob-served in 20-30 days in succession on the most part of the basin territory, and in some years it is up to 50-60 days. Most often, August and September are without rains, but July is often too.
Hydrography. The Ishim River originates from springs in mountains Niaz (the
Northern outskirts of the Kazakh upland) in Karaganda region and flows into the Irtysh River on the territory of the Russian Federation. In the Akmola Region the river en-ters on 62 km from the source and for the duration of 1,027 km flows through its ter-ritory, then crosses the North Kazakhstan region. The total river length is 2,450 km, the catchment area is 155,000 km2.
The territory of Akmola and the North Kazakhstan regions is the main area of wa-ter supply foe the Ishim River, as outside (afwa-ter the inflow of the Imanburluk River in it) Ishim goes on the West-Siberian Lowland, and up to lower Ishim it has no con-fluents.
The Ishim River within Kazakhstan’s territory flows through the valley with width from 2 to 12 km. Almost all over the river has a well-defined flood plain growing mainly to downstream, in the district of Astana flood plain is 5 km width, and near the city of Petropavlovsk it is 8 km width. In some sections, for example, in the area of Buzuluk village there is not any flood plain.
In summer the Ishim River dries up above Vyacheslav reservoir, below the reser-voir the river has a constant flow.
The hydrographic network of the considered territory is characterized by small slope of rivers, and also size of erosional downcutting of the river valleys. There is characteristic feature – presence of numerous of closed depressions in watershed ar-eas, that are arheic in middle- and low-water years; in high-water years these lower-ings have been filled by meltwater, and like the rest of the catchment they are in-volved in feeding of the river.
Natural characteristics of this region, and first of all sharp arid climate, are not conducive for a development of a dense network of rivers on its territory.
Along with a rare river network the distinctive feature of the hydrography of ba-sin territory is a relatively large number of temporary streams functioning only in short period of spring snowmelt. The density of rivers and temporary streams net-work of this territory varies from 0-0.05 to 0.20-0.30 km/km2 (according to E.P. Senkov).
Temporary watercourses have various sizes. The largest of them have lengths of 100-150 km with catchments areas up to 3,000 km2 and more (for example, the Kirey River, the Kipshak River and others).
Water regime of rivers. The main features of rivers and temporary watercourses
regime of investigated territory are defined by the conditions of their water nutrition. Meltwater has an exclusive importance of watercourses nutrition of this territory,
and therefore sharply expressed spring flood is the main phase of their regime; deep low-water period comes directly after flood period, when small watercourses may completely dry out, and frequently relatively large rivers may dry out too.
Spring flood. Within the Akmola Region spring flood begins 5-10 of April, it
happens almost at the same time on small watercourses and medium rivers. Flood of rivers and temporary streams of the area has usually very short duration. Depending on size of watercourses the duration of flood varies average from 10 to 80 days. The continuance of spring flood period varies considerably by year in accordance with changes of “friendliness” and water availability of spring. In high-water springs the duration of flood is usually longer, than in low-water springs.
Form of flood hydrograph. Flood passes with one wave on the majority of basin
watercourses, and in infrequent springs you can see clearly noticed two or three up-surges, because of intermittent snow melting and then return of cold weather.
However, on the Ishim River two waves of flood are common, this is related to specific features of sideline inflow (for example, on the section down the Ters-akkan River mouth).
Maximum levels, intensity of growth and recession of flood. Level rising of water
during spring flood periods on the rivers of the Akmola Region is significant. On medium and large rivers the growth of water level is average 3-4 m, on small water courses it is about 1-2 m. In exclusively high-water years the height of flood reaches respectively 5-8 and 2-4 m, and in very low-water years it is 20-30 cm. The rise of spring flood usually takes place rapidly. Its average duration for the most part is 3-5 days on the small watercourses, and 5-10 days for medium rivers, i.e. approximately 15-30% of the entire duration of flood.
A recession of flood is much slower than its rise. The biggest daily decline is typically around 50 cm, and only in separate years it reaches 100-150 cm.
Summer-autumn low water period. After end of spring flood insignificant flow is
maintained only in the largest rivers in the region, as well as in some small water-courses, that have regular groundwater nutrition. Majority of watercourses of con-sidered territory is breaked in lots of separate ples in summer, that are separated by parched erratic sections.
Levels of permanent rivers during the summer-autumn period, due to small fluc-tuations of their water content at this time, are sustainable. If in June in a number of rivers, there is a noticeable reduction of water level (20-25 cm), associated with higher water content in a beginning of a month (it is the impact of flood), then dur-ing July-September the level is almost constant.
On the background of summer-autumn low-water period there are short-term level rises on some rivers of the region, they are caused by rain. Rain flood often oc-curs in the first half of summer (June-July). Duration of freshet does not exceed 5-10 days in most cases.
Winter low water period. In winter the watercourses of study area, that
main-tained small runoff in autumn months, at shoals (and sometimes in ples) freeze and from January do not have any flow. Insignificant fluctuations of water level are pe-culiar to the rivers of the considered territory under. And along with this a significant rise during freeze-up is also characterised for these rivers.
The lowest winter levels usually take place in beginning of freeze-up period and in absolute value it is slightly higher, than summer minimum (in average 10-20 cm). The amplitude of water level fluctuations in winter period on most rivers is 30- 60 cm, and in some small watercourses in some years reaches 1.0-1.5 m.
Flow normals in the Ishim River – Kamenniy karyer station point is 33.0 m3/s when hydrological regime is violated, and 49.1 m3/s in natural (restored) hydrologi-cal regime; variability of flow is characterized by coefficient of variation Cv = 0.64
when hydrological regime is violated and 0.92 in natural (restored) one. Flow nor-mals in the Ishim River – Petropavlovsk city point (upstream the city) is 60.7 m3/s when hydrological regime is violated, and 49.7 m3/s in natural (restored) hydrologi-cal regime; Cv = 0.70 when hydrological regime is violated and 0.63 in natural
(re-stored) one.
Chemical composition of the Ishim River water. Flood period. As a rule, increase
of water level in channel network in spring flood period leads to cessation of groundwater admission in it (backwards hydraulic connection are generated). How-ever, in chemical composition of micro streaming water and channel network water sometimes there are significant differences in peak of flood period. In period of in-tensive snow melting micro streaming water has a well expressed hydrocarbonate character and its mineralization in rare cases exceeds 200 mg/dm3. Channel network water during this period in most cases also has hydrocarbonate character, although it is less pronounced. On the territory with non-saline or slightly saline soils, river wa-ter has salinity less than 200-250 mg/dm3 in flood period.
Periods of summer and winter low water. Depending on hydrogeological
condi-tions of catchment area the leaky aquifer below erosive cutting “dried” channel net-work, can form “under channel water” some time. The main characteristic of this un-der channel water is that they can be very different by chemical composition, because it is more affected by local conditions (by degree of salinization of soils and hydro-geological features of catchment area). Under channel water and water of rivers’ ples that are located on non-saline areas is often little-mineralized (300-600 mg/dm3) and has a well expressed hydrocarbonate character. On saline areas mineralization and chemical composition of under channel water and water of rivers’ ples can vary within wide limits (Surface water resources... 1958, Burlibayev et al. 2006).
Materials and methods
Analysis was performed by calculation and graphing of changeable average val-ue of a particular chemical element. The concentration of a particular substance for ten-year period is calculated by formula:
10 ) ... ( 10 1 10 3 2 1 10 i
∑
+ + + + = i i i i av C C C C C , (1)low water) for ten-year period; Сi 1, 2, 3 ... 10 – average concentration of i-th element in
a particular period for the first (second, third ... tenth) year this decade.
Averaging was performed for ten-year period, for example, total mineral content of flood period is made average from 1940 to 1949, then we do the same in the peri-ods 1941-1950, 1942-1951, etc.
This method allows to smooth or mitigate maximum values that can be caused by a one-time discharge of substances in water. When it has been considered in long-term period it is possible to estimate actual change in concentration of a particular element, excluding the possibility of consideration of peak concentrations. Trend lines are built to identify dynamics of changes, they are also help to see these changes more clearly.
It should be noted that the dynamics of concentrations of substances are consid-ered in different periods of water regime – flood period, flood period and transition to low-water period, and autumn-winter low-water period. This is correct, because the various phases of water regime, concentration of substances are different, for ex-ample, the lowest concentrations is observed during flood period, because there is a dilution of channel water by meltwater, and the highest concentration is in low-water period, when low-water level in river is low (Alekin 1970).
In this paper, as a criterion for surface waters quality assessment, following pa-rameters were chosen:
1) the amount of ions (total mineral content) – the total concentration of dissolved substances in natural waters, mainly the major ions, usually expressed in mg/dm3. In the terrestrial surface waters typically corresponds as water salinity; 2) biochemical oxygen demand (BOD) is amount of oxygen consumption in a def-inite time for biochemical oxidation of substances contained in the water in aerobic conditions. BOD5 index is used frequently, it is biochemical oxygen
demand for 5 days. BOD-index is used for water pollution and oxidizable or-ganic substances assessment;
3) hydrocarbonate ions are typical for most rivers, that is explained by touching between river water and mainly relatively well-washed upper layers of soils and rocks (Zenin, Belousova 1988).
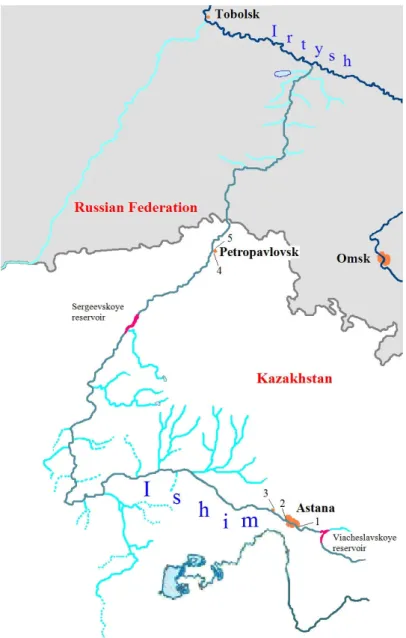
To identify long-term changes in hydro-chemical indicators of the Yesil River water, 5 hydro-chemical points have been chosen:
1) the Ishim River – Astana city point (upstream the city); 2) the Ishim River – Astana city point (downstream the city); 3) the Ishim River – Kamenniy karyer station point;
4) the Ishim River – Petropavlovsk city point (upstream the city);
5) the Ishim River – Petropavlovsk city point (downstream TPP-2 water dis-charge) (Annual data...).
The locations of listed points sites are presented in Figure 1.
Following data provides information about the period of observations, that was taken into account.
Total mineral content: 1) the Ishim River – Astana city point (upstream the city)
– from 1940 to 2008; 2) the Ishim River – Astana city point (downstream the city) – from 1984 to 2008; 3) the Ishim River – Kamenniy karyer station point – from 1950
Fig. 1. Location of researched hydro-chemical points on the Ishim river: 1 – the Ishim River – Astana city point (upstream the city); 2 – the Ishim River – Astana city point (downstream the city); 3 – the Ishim River – Kamenniy karyer station point; 4 – the Ishim River – Petro-pavlovsk city point (upstream the city); 5 – the Ishim River – PetroPetro-pavlovsk city point (downstream TPP-2 water discharge)
Ryc. 1. Lokalizacja badanych punktów hydrochemicznych na rzece Iszym: 1– rzeka Iszym – punkt w mieście Astana (górny bieg rzeki); 2 – rzeka Iszym – punkt w mieście Astana (dolny bieg rzeki); 3 – rzeka Iszym – punkt Kamenniy karyer; 4 – rzeka Iszym – punkt w mieście Pietropawłowsk (górny bieg rzeki); 5 – rzeka Iszym – punkt w mieście Pietropawłowsk (dol-ny bieg rzeki, TPP-2 wypływ wody)
to 2008; 4) the Ishim River – Petropavlovsk city point (upstream the city) – from 1941 to 2008; 5) the Ishim river – Petropavlovsk city point (downstream TPP-2 wa-ter discharge) – from 1987 to 2008.
BOD5: 1) the Ishim River – Astana city point (upstream the city) – from 1968 to
2008; 2) the Ishim River – Astana city point (downstream the city) – from 1984 to 2008; 3) the Ishim River – Kamenniy karyer station point – from 1969 to 2008; 4) the Ishim River – Petropavlovsk city point (upstream the city) – from 1969 to 2008; 5) the Ishim River – Petropavlovsk city point (downstream TPP-2 water dis-charge) – from 1987 to 2008.
Content of hydrocarbonate (HCO3): 1) the Ishim River – Astana city point
(up-stream the city) – from 1941 to 2008; 2) the Ishim River – Astana city point (down-stream the city) – from 1984 to 2008; 3) the Ishim River – Kamenniy karyer station point – from 1953 to 2008; 4) the Ishim River – Petropavlovsk city point (upstream the city) – from 1941 to 2008; 5) the Ishim River – Petropavlovsk city point (down-stream TPP-2 water discharge) – from 1987 to 2008.
The points are selected basing on continuous of data series to estimate the tem-poral variation of hydro-chemical regime. The data for such long period is repre-sentative because the method of determining the concentration of hydro-chemical components in water has not been changed.
Results and discussion
Analyses of hydro-chemical data have shown the following results.
Total mineral content in the flood period (April). At the Astana city point
(up-stream the city), the mineral content in 1941-2008 increased by 2.2 times (compared with the average indicators 240.5 mg/dm3 recorded in 1941-1950, and 534.4 mg/dm3 recorded in 1999-2008) and the trend line increased by 1.8 times (from 275.0 to 490.0 mg/dm3).
At the Astana city point (downstream the city) the mineral content increased by 1.8 times (from 399.1 mg/dm3 in 1984-2008 to 705.9 mg/dm3 in 1999-2008). Trend line increased by 2.1 times (from 390.0 to 835.0 mg/dm3).
At the Kamenniy karyer station point the mineral content increased by 1.2 times (from 472.3 in 1953-1962 to 543.9 mg/dm3 in 1999-2008). Trend line analyses show that the mineral content increased by 1.7 times (from 385.0 to 650.0 mg/dm3).
At the Petropavlovsk city point (upstream the city) the mineral content increased by 1.4 times (from 499.9 in 1941-1950 to 695.6 mg/dm3 in 1999-2008). But in trend line the mineral content increased by 1.2 times (from 550.0 to 660.0 mg/dm3).
At the Petropavlovsk city point (downstream TPP-2 water discharge) the mineral content decreased from 657.3 to 636.2 mg/dm3.
Everywhere the increase in mineral content may be associated with increased sa-linity of soil resulted from aerosol transmission and salt transmission. The mineral content decrease at the Petropavlovsk city point (downstream TPP-2 water dis-charge) is associated with water treatment facilities operated in the TPP-2 area where demineralization and sedimentation of substances processes are held.
Total mineral content in the flood period and transition to low-water period (April-June). At the Astana city point (upstream the city) the mineral content
in-creased by 1.4 times (from 478.5 in 1941-1950, to 664.5 mg/dm3 in 1999-2008). Trend line analyses show an increase by 1.1 times (from 475.0 to 525.0 mg/dm3).
At the Astana city point (downstream the city) the mineral content increased by 1.5 times (from 530.2 in 1984-1993, to 803.5 mg/dm3 in 1999-2008). But trend line analyses show significant increase by 1.8 times (from 495.0 to 890.0 mg/dm3).
At the Kamenniy karyer station point the mineral content increased by 1.4 times (from 441.2 in 1950-1959, to 623.7 mg/dm3 in 1989-2007). But trend line analyses show an increase by 1.6 times (from 400.0 to 630.0 mg/dm3).
At the Petropavlovsk city point (upstream the city) the mineral content increased by 1.3 times (from 468.4 in 1941-1950, to 620.1 mg/dm3 in 1999-2008). Trend line analyses show an increase by 1.2 times (from 480.0 to 590.0 mg/dm3).
At the Petropavlovsk city point (downstream TPP-2 water discharge) the mineral content increased too. But the increase is insignificant.
The general mineral content increase in this period is associated with gradual sal-inization of soil.
Total mineral content in the winter low water period (October-February). At the
Astana city point (upstream the city), the mineral content decreased by 1.1 times (from 814.8 in 1948-1957, to 776.8 mg/dm3 in 1999-2008). Trend line analyses show a decrease by 2 times (from 1120.0 to 550.0 mg/dm3).
At the Astana city point (downstream the city) the mineral content increased by 1.2 times (from 842.0 in 1984-1993, to 1025.6 mg/dm3 in 1999-2008). In trend line, the increase rate is the same.
At the Kamenniy karyer station point the mineral content increased by 1.5 times (from 7552.6 in 1956-1965, to 1164.6 mg/dm3 in 1999-2008). In trend line, the in-crease rate is the same.
At the Petropavlovsk city point (upstream the city) the mineral content decreased by 1.3 times (from 924.2 in 1952-1961, to 716.1 mg/dm3 in 1999-2008).
At the Petropavlovsk city point (downstream TPP-2 water discharge) the mineral content decreased by 1.1 times (from 769.3 in 1987-1996, to 722.1 mg/dm3 in 1999-2008).
Mineral content decrease near Astana city is associated with sedimentation of substances in Vyacheslavskoye water reservoir, and near Petropavlovsk in Ser-geyevskoe water reservoir. The mineral content decrease at the Petropavlovsk city (downstream TPP-2 water discharge) is associated with treatment facilities, where sedimentation of pollutant substances is held.
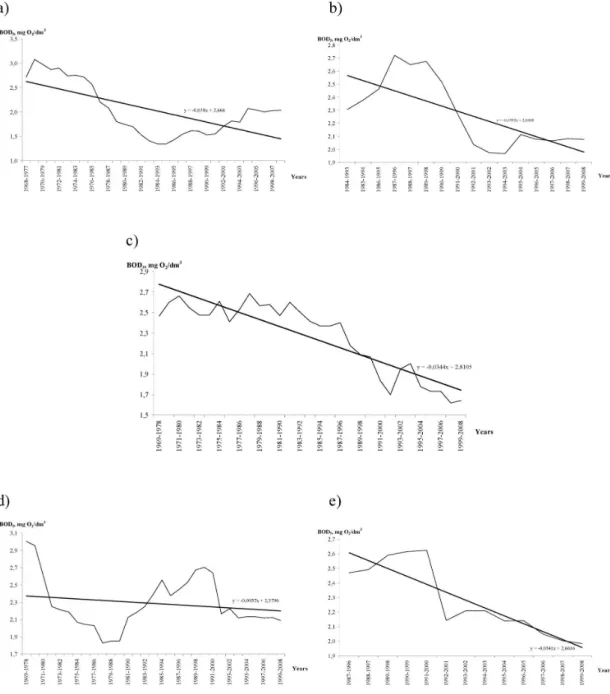
BOD5 in the flood period (April). Biochemical oxygen demand (BOD) is an
amount of oxygen consumption in a definite time for biochemical oxidation of sub-stances contained in the water in aerobic conditions. BOD5 index is used frequently,
it is biochemical oxygen demand for 5 days. BOD index is used for assessment of water pollution and oxidizable organic substances (Alekin 1970).
At the Astana city point (upstream the city), the BOD5 index decreased by 1.3
times (from 2.7 in 1968-1977, to 2.0 mg O2/dm 3
in 1999-2008), and the trend line decreased by 1.7 times (from 2.5 to 1.4 mg O2/dm
3
At the Astana city point, BOD5 index decreased by 1.1 times (from 2.3 in
1984-1993, to 2.1 mg O2/dm 3
in 1999-2008), but the trend line decrease is more signifi-cant, i.e. 1.3 times (from 2.6 to 2.0 mg O2/dm
3
).
At the Kamenniy karyer station point, the BOD5 index decreased by 1.5 times
(from 2.5 in 1969-1978, to 1.6 mg O2/dm 3
in 1999-2008), but trend line analyses show that the BOD index decreased by 1.6 times (from 2.8 to 1.7 mg O2/dm
3
). At the Petropavlovsk city point (upstream the city), the BOD5 index decreased by
1.4 times (from 2.5 in 1969-1978, to 2.1 mg O2/dm3 in 1999-2008), but the decrease
in the trend line is not significant, (it is from 2.4 to 2.2 mg O2/dm 3
).
At the Petropavlovsk city point (downstream TPP-2 water discharge) the BOD5
index decreased by 1.2 times (from 2.5 in 1987-1996, to 2.0 mg O2/dm 3
in 1999-2008), but the trend line decreased by 1.3 times (from 2.6 to 2.0 mg O2/dm
3
). Everywhere we can see that the BOD index has decreased. Figure 2 demonstrates the changes of the BOD5 index in flood period (April).
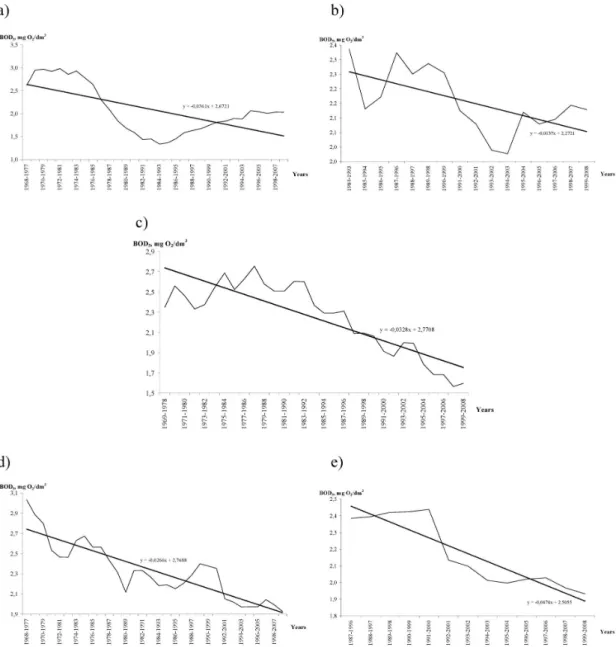
BOD5 in the flood period and transition to low water period (from April to June).
At the Astana city point (upstream the city), the BOD5 index decreased by 1.3 times
(from 2.6 in 1968-1977, to 2.0 mg O2/dm3 in 1999-2008), and the trend line decrease
is significant, by 1.7 times (from 2.6 to 1.6 mg O2/dm3).
At the Astana city point (downstream the city), the BOD5 index decreased by 1.1
times (from 2.3 in 1984-1993, to 2.1 mg O2/dm 3
in 1999-2008), and the trend line decrease is the same.
At the Kamenniy karyer station point the BOD5 index decreased by 1.5 times
(from 2.3 in 1969-1978, to 1.6 mg O2/dm 3
in 1999-2008), but trend line analyses show that the BOD index decreased by 1.6 times (from 2.7 to 1.8 mg O2/dm
3
). At the Petropavlovsk city point (upstream the city), the BOD5 index decreased by
1.6 times (from 3.0 in 1968-1977, to 2.0 mg O2/dm 3
in 1999-2008), but the trend line decreased insignificantly, by 1.4 times (from 2.7 to 1.9 mg O2/dm
3
).
At the Petropavlovsk city point (downstream TPP-2 water discharge) the BOD5
index decreased by 1.2 times (from 2.4 in 1987-1996, to 2.0 mg O2/dm 3
in 1999-2008). Everywhere we can see that the BOD index has decreased, as in previous case, it is associated with decreased amounts of oxidizable substances, as a result of which, the oxygen consumption for oxidation decreases. Figure 3 shows the changes of the BOD5 index in flood period and transition to low water period (from April to June).
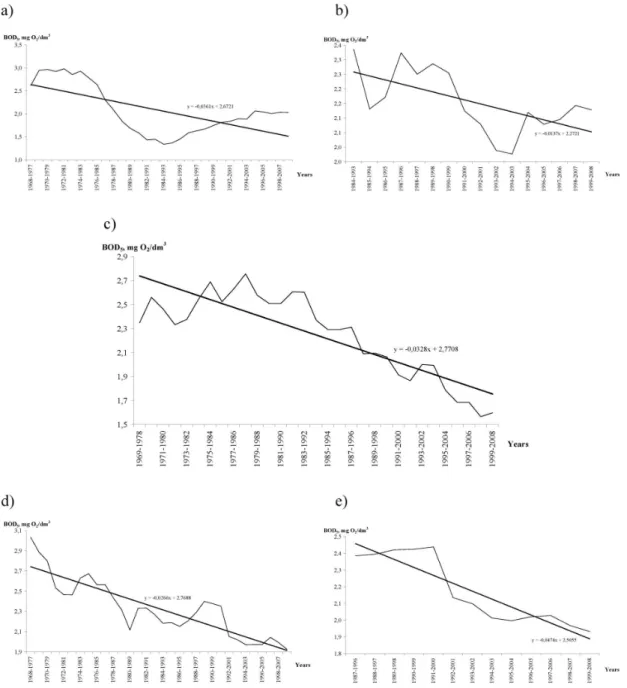
BOD5 index in the winter low water period (October-February). At the Astana
city point (upstream the city), the BOD5 index decreased by 1.4 times (from 2.4 in
1969-1978, to 1.7 mg O2/dm3 in 1999-2008), and the trend line decreased
signifi-cantly, by times (from 2.7 to 1.4 mg O2/dm 3
).
At the Astana city point (downstream the city), the BOD5 index decrease is
in-significant (values are approximately the same in 1984-1993, and in 1999-2008). At the Kamenniy karyer station point the BOD5 index decreased by 1.3 times
(from 2.1 in 1970-1979, to 1.6 mg O2/dm 3
in 1999-2008), but trend line analyses show that the BOD index decreased by 1.2 times (from 2.1 to 1.7 mg O2/dm
3
). At the Petropavlovsk city point (upstream the city), the BOD5 index decreased by
1.4 times (from 2.2 in 1970-1979, to 1.6 mg O2/dm 3
in 1999-2008), the trend line decreased by 1.5 times (from 2.3 to 1.6 mg O2/dm
3
Fig. 2. Changeable average BOD5 value in April (flood time) in different points: a – the Ishim
River – Astana city point (upstream the city); b – the Ishim River – Astana city point (down-stream the city); c – the Ishim River – Kamenniy karyer station point; d – the Ishim River – Petropavlovsk city point (upstream the city); e – the Ishim River – Petropavlovsk city point (downstream TPP-2 water discharge)
Ryc. 2. Zmienna średnia wartość BOD5 w kwietniu (czas powodzi) w różnych punktach:
a – rzeka Iszym – punkt w mieście Astana (górny bieg rzeki); b – rzeka Iszym – punkt w mie-ście Astana (dolny bieg rzeki); c – rzeka Iszym – punkt Kamenniy karyer; d – rzeka Iszym – punkt w mieście Pietropawłowsk (górny bieg rzeki); e – rzeka Iszym – punkt w mieście Pie-tropawłowsk (dolny bieg rzeki, TPP-2 wypływ wody)
Fig. 3. Changeable average BOD5 value from April to June (flood time and transition to low
water period) in different points: a – the Ishim River – Astana city point (upstream the city); b – the Ishim River – Astana city point (downstream the city); c – the Ishim River – Kamenniy karyer station point; d – the Ishim River – Petropavlovsk city point (upstream the city); e – the Ishim River River – Petropavlovsk city point (downstream TPP-2 water dis-charge)
Ryc. 3. Zmienna średnia wartość BOD5 od kwietnia do czerwca (czas powodzi i przejście do
okresu niskiego poziomu wody) w różnych punktach: a – rzeka Iszym – punkt w mieście Astana (górny bieg rzeki); b – rzeka Iszym – punkt w mieście Astana (dolny bieg rzeki); c – rzeka Iszym – punkt Kamenniy karyer; d – rzeka Iszym – punkt w mieście Pietropaw-łowsk (górny bieg rzeki); e – rzeka Iszym – punkt w mieście PietropawPietropaw-łowsk (dolny bieg rzeki, TPP-2 wypływ wody)
Fig. 4. Changeable average BOD5 value from October to February (winter low water period)
in different points: a – the Ishim River – Astana city point (upstream the city); b – the Ishim River – Astana city point (downstream the city); c – the Ishim River – Kamenniy karyer sta-tion point; d – the Ishim River – Petropavlovsk city point (upstream the city); e – the Ishim River – Petropavlovsk city point (downstream TPP-2 water discharge)
Ryc. 4. Zmienna średnia wartość BOD5 od października do lutego (zimowy okres niskiego
poziomu wody) w różnych punktach: a – rzeka Iszym – punkt w mieście Astana (górny bieg rzeki); b – rzeka Iszym – punkt w mieście Astana (dolny bieg rzeki); c – rzeka Iszym – punkt Kamenniy karyer; d – rzeka Iszym – punkt w mieście Pietropawłowsk (górny bieg rzeki); e – rzeka Iszym – punkt w mieście Pietropawłowsk (dolny bieg rzeki, TPP-2 wypływ wody)
At the Petropavlovsk city point (downstream TPP-2 water discharge) the BOD5
index decreased by 1.1 times (from 1.7 in 1987-1996, to 1.6 mg O2/dm 3
in 1999-2008), the same result was obtained in the trend line analysis.
As in the previous cases the decrease in the BOD5 index is associated with
oxy-gen consumption decrease. Figure 4 shows these changes of the BOD5 index in low
water period (October-February).
Content of hydrocarbonate (HCO3) in the flood period (April). At the Astana city
point (upstream the city), hydrocarbonate concentration increased by 1.2 times (from 143.9 in 1941-1950, to 144.4 mg/dm3 in 1999-2008), and the trend line changes are the same, 1.2 times increase.
At the Astana city point (downstream the city), hydrocarbonate concentration in-creased by 1.1 times (from 138.1 in 1984-1993, to 148.5 mg/dm3 in 1999-2008), and the trend line increased by 1.2 times (from 132.0 to 158.0 mg/dm3).
At the Kamenniy karyer station point, trend line was analysed, and 1.2 times in-crease (from 142.0 to 173.0 mg/dm3) was observed.
At the Petropavlovsk city point (upstream the city), changes are insignificant. At the Petropavlovsk city point (downstream TPP-2 water discharge) hydrocar-bonate concentration increased by 1.2 times (from 183.9 in 1987-1996, to 217.0 mg/dm3 in 1999-2008).
Content of hydrocarbonate (HCO3) in the flood period and transition to low
wa-ter period (from April to June). At the Astana city point (upstream the city),
hydro-carbonate concentration decreased by 1.2 times (from 211.3 in 1941-1950 to 176.2 mg/dm3 in 1999-2008), and the trend line, changes are the same, i.e. 1.2 times decrease.
At the Astana city point (downstream the city), the change is insignificant (from 164.1 in 1984-1993, to 167.0 mg/dm3 in 1999-2008), but in trend line, the concen-tration increased by 1.1 times (from 148.0 to 165.0 mg/dm3).
At the Kamenniy karyer station point, there is an insignificant change (from 154.1 in 1950-1959, to 154.2 mg/dm3 in 1999-2008).
At the Petropavlovsk city point (upstream the city), 1.1 times increase (from 185.9 in 1941-1950, to 195.8 mg/dm3 in 1999-2008) has occured. In the trend line, the results are the same, i.e. 1.1 times increase (from 172.0 to 183.0 mg/dm3).
At the Petropavlovsk city point (downstream TPP-2 water discharge) hydrocar-bonate concentration increased by 1.2 times (from 169.0 in 1987-1996, to 199.5 mg/dm3 in 1999-2008).
Hydrocarbonate concentration in the Astana city point (upstream the city) is as-sociated with Vyacheslavskoye water reservoir impact, sedimentation of hydrocar-bonate substances takes place there.
Content of hydrocarbonate (HCO3) in the winter low water period (October-
February). At the Astana city point (upstream the city), the average decade index
analyses show insignificant hydrocarbonate concentration decrease. Trend line anal-yses show a significant decrease, 1.6 times (from 287.0 to 197.0 mg/dm3).
At the Astana city point (downstream the city), hydrocarbonate concentration de-creased by 1.1 times (from 233.6 in 1984-1993, to 218.3 mg/dm3 in 1999-2008), trend line analyses show insignificant changes.
At the Kamenniy karyer station point, there is 1.1 times decrease (from 227.3 in 1956-1965, to 206.3 mg/dm3 in 1999-2008); trend line hydrocarbonate concentration index remains unchangable.
At the Petropavlovsk city point (upstream the city), 1.3 times decrease (from 305.3 in 1952-1961, to 230.8 mg/dm3 in 1999-2008) has occured. In trend line, the results are the same, 1.3 times decrease.
At the Petropavlovsk city point (downstream TPP-2 water discharge), significant changes were not observed.
Conclusions
Changes of hydrochemical regime take place against a background of the de-creasing water resources in time and the growth of anthropogenic load on water bod-ies.
The main result: parallel quantitative change of water resources, growth of total mineral content of river water, reduction of biological oxygen demand. As for the concentration of hydrocarbonate, the results are contradictory: during flood and transition to low water slight growth in almost all points (except Astana city point – upstream the city) is monitored, and in winter low water period there is a reverse di-rection – reduction of the content of hydrocarbonate in all studied points. The great-est growth of total mineral content is noticed in Kamenniy karyer station point. Re-duction of BOD5 in all points shows a decrease of oxygen consumption for
oxida-tion reacoxida-tion.
This change of hydro-chemical regime can be explained by large anthropogenic pressure on the basin territory, for example, large tilling areas (there are huge sowing areas), that are the cause of secondary salinization of soils, consequently the water in the river, because soils have direct contact with channel (riverbed) and underground water; last lies close to the surface in the basin of the Ishim River. Another cause of changes in hydro-chemical regime is the construction of reservoirs – Viacheslav- skoye and Sergeevskoye. These artificial objects undoubtedly change not only hy-drological regime of the river, but also have a great influence on chemical composi-tion of water, because running river regime changes in slow mode of a reservoir, and, as a result, deposition of particles of chemical elements and their accumulation in bed load of the reservoir are occurred.
The Ishim River is the main source of drinking water supplying such big cities as Astana, and Petropavlovsk, as well as other large regional centres, therefore the is-sue of water quality is very actually. Rapid pace of development of the Astana city may appear impressive, but the shortage of clean drinking water significantly inter-fere this process. Currently, there are big problems related specifically to water qual-ity of the Ishim River when we talk about water supply in the cqual-ity of Astana. This problem will be more complicated due to deterioration of the Irtysh River water quality. I.e., after putting into operation the second stage of the channel named after K. Satpayev. This channel has been built to satisfy the needs of the city in clean drinking water supply. But here we find another question – what quality of water in
the river will we have in downstream, for example, after the city of Astana? Because after Astana the Ishim River provides drinking water to many big settlements, and then it flows in Petropavlovsk, and on the territory of the Russian Federation flows into the Irtysh River. How will this affect on the water quality of the Irtysh River?
Therefore, taking into account current condition of hydro-chemical regime of the Ishim river, and contamination of the Irtysh River, preventive measures should be taken to achieve the quality of drinking water of the city of Astana to the level of ex-istent standards and norms.
References
Алекин О.А., 1970, Основы гидрохимии, 444 с. (Alekin O.A., 1970, Fundamentals of hy-
dro-chemistry, Leningrad, 444 p.)
Бурлибаев М.Ж., Муртазин Е.Ж., Турсунов Э.А., 2006, Гидрохимический режим рек, t. 1, Алматы, c. 257-263 (Burlibayev M.Zh., Murtazin Y.Z., Tursunov E.A., 2006, Rivers
hydro-chemical regime, Almaty, p. 257-263)
Ежегодные данные о качестве поверхностных вод (ЕДК). Казгидромет, периодическое
издание. 1940-2008 гг. (Annual data of surface water quality (ADQ). Kazhydromet, pe-riodical publication. 1940-2008)
Ресурсы поверхностных вод районов освоения целинных и залежных земель. Вып. 1: Целиноградская область, 1958, Ленинград (Surface water resources of regions of vir-gin and fallow lands development. Vol. 1: Tselinograd region, 1958, Leningrad)
Зенин А.А., Белоусова Н.В., 1988, Гидрохимический словарь, Ленинград (Zenin A.A., Belousova N.V., 1988, Dictionary of hydro-chemistry terms, Leningrad)
Streszczenie
Artykuł ten dotyczy hydrochemicznego reżimu rzeki Iszym. Miasto Astana boryka się obecnie z problemami dotyczącymi dostaw wody, które są związane z jej jakością w oma-wianej rzece. W przyszłości, po oddaniu do eksploatacji Kanału Saptayeva, kwestia ta stanie się jeszcze bardziej poważna z powodu zanieczyszczenia rzeki Irtysz. Z tej przyczyny, roz-ważając widoczny obecnie reżim zanieczyszczenia rzek Iszym i Irtysz, powinny zostać po-czynione wyprzedzające kroki, aby uzyskać właściwą jakość wody pitnej w mieście Astana. Jej jakość powinna zostać dostosowana do odpowiednich norm i standardów.