TECHNICAL EFFICIENCY OF POLISH COMPANIES
OPERATING IN THE MACHINERY
MANUFACTURING SECTOR
Justyna Kozłowska
Faculty of Management, Bialystok University of Technology, Bialystok, 15-351, Wiejska 45A, Poland, Email: j.kozlowska@pb.edu.pl
Abstract. The machinery sector plays an important role in the economy of each country providing the
technology, machinery, equipment and production lines for other manufacturing sectors. Nowadays, these companies often introduce also services to their portfolio, thus exceeding the boundary between the manufacturing sector and the service sector. These actions are caused by the global trend of shifting towards a service economy and harsh competitive conditions in the market place. The aim of this article is to assess the condition of the selected group of companies operating in the sector of machinery and industrial equipment manufacturing in terms of technical efficiency, and to examine whether the number of services offered by them correlates with the efficiency score. The analysis was made using DEA (Data Envelopment Analysis), which as a non-parametric method, is widely used for studing the efficiency of both business institutions and public organizations, for which the relationship between inputs and achieved outputs (i.e. the production function) is unknown. Data for the study were drawn from the EMIS (Emerging Market Information Service) database, and the sampling was made in accordance with the DEA methodology taking into account factual and statistical methods. Both, companies that offer a wide range of services and those that limit the range of services to warranty support, were analyzed, and then the results were compared and discussed.
Paper type: Research Paper
Published online: 28 October 2016
Vol. 6, No. 5, pp. 443–453
DOI: 10.21008/j.2083-4950.2016.6.5.6 ISSN 2083-4942 (Print)
ISSN 2083-4950 (Online)
Keywords: technical efficiency, machinery manufacturing, DEA method, services in manu-facturing company
1. INTRODUCTION
The machinery sector plays an important role in the economy of each country providing the technology, machinery, equipment and production lines for the other manufacturing sectors. It is one of the heavy industry branches. Among its products are machines for industries like: mining, metallurgy, energy, agriculture as well as machine tools and motors. According to experts (Mrówczyński & Kanikuła, 2014), the recent drop in the machinery industry caused by the economy slowdown in Poland is clearly reflected in the company investments in new machine parks. Therefore, the demand for various types of machines and industrial equipment is one of the barometers of the economy. Experts also indicate that the decline of the value added in the sector of machinery and equipment manufacture in Poland be-tween 2008 and 2013 (of approx. 15% ) is caused by the growing competition in the sector. And the main reason is the fact that foreign manufacturers provide almost three-quarters of machinery and equipment that are sold on the polish market. To become more competitive or even simply to remain on the market place, manufactur-ing companies look for innovative solutions, not only technical or technological but also organizational, management, marketing or other novel modifications which would distinguish them among competition. There are many examples of successful-ly undertaken changes that had ensured the survival and even long-lasting profits by introducing services into the activity of product-oriented companies (IBM, Xerox, Rollce-Roys, Hewlett-Packard). Services, or combination of services and physical products, are considered as an effective means for boosting returns and a market position of manufacturing companies (Shelton, 2009). Leaders in integrating product and service innovations seek to solutions in which value contribution in terms of in-come and profits is increasingly associated to services, namely if a product-oriented company grows in service maturity (Fig. 1) it extends its portfolio with more services and the share of revenue obtained from those services considerably raises. At the first stage of service innovation maturity, a manufacturer offers relatively small amount of services, and they are an addition or complement to the product (e.g. providing spare parts and repairs), whereas at the last level services are integrated inseparably with the product and are offered as a solution or system offerings. The vertical axis at the Figure 1 explains how the share of income, which is generated by services, increases in overall revenue along with the maturity level growth (Shelton, 2009).
It should be noted though, that the revenue or profits as a nominal or absolute value are difficult to compare. Indicators are more useful, if there is a need to
as-sess the condition of company, especially in comparison to other periods of time or companies. An evaluation of organization performance is a key activity in effective management. Among many indicators, productivity is the one which is particularly suitable for the manufacturing sector, and may be described as a production with-out any wastefulness (Samuelson & Nordhaus, 1995, p. 185).
Fig. 1. Solutions innovation progresses through four stages of maturity (Shelton, 2009)
Samuelson and Nordhaus argue that the economy (alike entity, company, organi-zation etc.) is functioning effectively and efficiently, if the production of one good cannot be increased without decreasing the production of another, which means it reaches the frontier of manufacturing capabilities. Productivity can be measured with different indicators, taking into account various aspects (financial, technological, allocative). The term “efficiency”, associated with productivity, and even used alter-natively, was defined by (Farell, 1975; Debreu, 1951) as a single input-output ratio and is applicable in any organization that functions as a production system – namely uses inputs (resources like: materials, money, human work, machines etc.) and con-verts it by various processes into outputs. In last decades this measure is increasingly applied for performance evaluation in business practice as well as in academic re-search (Domagała, 2007).
2. METHODOLOGY OF THE STUDY
The aim of this work is to assess the condition of the selected group of compa-nies operating in the sector of machinery and industrial equipment manufacturing
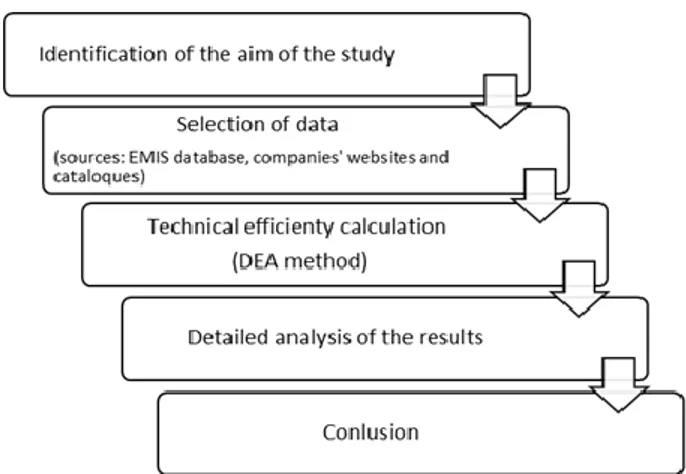
in terms of technical efficiency, and to examine whether the number of services offered by them correlates with the efficiency score. The research was conducted by the procedure presented at the Figure 2.
Fig. 2. The study process
The first step of the study was the identification of its aim. The main prerequisite for undertaking such study was the literature review on services in industry. Some authors (e.g. Shelton, 2009; Meier, Roy & Seliger, 2010) point out that combining services with physical products is a solution that brings a lot of benefits, including financial profits. Others (Neely, 2009; Gebauer, Fleisch & Friedli, 2005) argue that the costs of extending service offerings not always generate corresponding higher returns. Therefore, the main goal of this paper is to calculate the technical efficiency of chosen group of enterprises operating in machinery production industry and the analysis of obtained results – in particular the examination whether in the group of best performers (the units that achieve the highest efficiency scores) in terms of re-sources exploitation are those who offer a vast range of different types of services or those who specialized in delivering limited number of services to their clients.
The second step was the data selection. Data for analysis were drawn from Emer-ging Market Information Service database (EMIS, www.emis.com), which brings time-sensitive news, research and analytical data and peer comparisons for over 120 emerging markets. The information platform provides data and news on companies, industries and countries as well. The sample for analysis includes over 50 enterprises chosen from database by stratified sampling method. Stratification in statistics means dividing the population into homogeneous subgroups before sampling. In this study the company size has been used as a criterion for division. The author conducted the manual searching (companies websites and catalogues) to examine whether analyzed manufacturers follow the global trends and add services to their portfolio.
In the next step the efficiency analysis was made. As the author would like to take into account few and different in kind inputs and calculate the relative tech-nical efficiency – namely the one which assesses the way of converting resources into outputs in comparison to other entities – therefore the DEA (Data Envelopment Analysis) method is applied for such examination. DEA, which is a non-parametric method, is widely used for studying the efficiency of both business institutions and public organizations (in DEA terminology they are DMU – Decision Making Units), where the precise relationship between inputs and produced outputs (i.e. the tion function) is unknown. Its advantage is that it allows, in contrary to other produc-tivity evaluating methods or indicators, to measure the efficiency as a ratio of multi-ple inputs and multimulti-ple outputs and to determine the efficiency of DMU in relation to other similar units. Thus, in result it enables to estimate the “best practice” frontier – namely the points (units) that achieve the best scores in particular group (Cooper, Seiford & Zhu, 2004). This subsequently enables to indicate benchmarks for ineffi-cient entities so they could improve their performance. The basic DEA model is defined as a linear programming task by formula:
subject to:
where:
z – weighted sum of outputs calculated for DMUm (m = 1, .., N); yj,m – denotes DMUm outputs (j = 1, .., J);
xi,m – represents inputs (I = 1, …, I) of DMUm;
ui,m, vj,m – weights that are unknown variables.
The methodology has been found very useful for productivity assessment and is worldwide applied in many sectors (see e.g. Rangan, Grabowski, Aly & Pasturka, 1988; Kozłowska, 2014; Perek, 2014), including public sector (Nazarko & Šaparauskas, 2014; Chodakowska, 2015). There has been developed many modifi-cations of basic DEA model since its first introduction in late 70’s of XX century so this method has very vast range of application.
The penultimate step of the study was the detailed analysis of obtained results. In particular, they were examined in terms of the number of services that are offered by the units which indicate 100% efficiency in comparison to the inefficient entities. Finally, some conclusions has been drawn and discussed as a last step of the re-search.
3. EFFICIENCY OF MACHINERY MANUFACTURERS
3.1. Variables and DEA model choice
As inputs following variables were chosen: Number of Employees (NoE), Num-ber of services (NoS), Raw materials and consumables used (Rmc), Employee bene-fit expense (EbE), Total assets (Ta) and Total equity (Te). Variables represent differ-ent aspects of costs that manufacturer bears in production processes. DEA method allows to include variables that are expressed in different units (numbers, currency, indicators, etc.). As an output the Net sales revenue was chosen, which is relatively representative measure of current operational activity of the company. Data represent companies outcomes from the year 2014. According to DEA methodology there should not be a significant relation between variables that are considered as inputs, so the Pearson correlation coefficient has been calculated and the outcomes are present-ed in Table 1. Likewise, DEA requires the positive relationship between inputs and outputs, which was also tested by the same coefficient.
Table 1. Pearson correlation coefficient values
NoE NoS Rmc Ebe Ta Te NoE 1 0.227 0.749 0.971 0.961 0.978 NoS 1 0.187 0.226 0.231 0.216 Rmc 1 0.881 0.857 0.742 EbE 1 0.986 0.956 Ta 1 0.974 Te 1 NoS Rmc NoE
Net sales revenue 0.20 0.99 0.80
Raw materials and consumables used (Rmc), Employee benefit expense (EbE), Total assets (Ta) and Total equity (Te) occurred to be highly correlated with each other, so to avoid duplication of information in the analysis, one of them (Rmc) has been chosen as a representative variable in DEA model. Finally, the model includes three input variables (Rmc, NoE and NoS) and one output – Net sales revenue.
The author decided to calculate technical efficiency (TE) using input-oriented model (namely – minimization of inputs with the constant outputs level) assuming variable return to scale (VRS). This choice stems from the author’s opinion that in the manufacturing sector the main focus is laid on minimizing inputs and that constant return to scales is rather rare in real market conditions for manufacturing sector.
3.2. Technical efficiency of analyzed companies
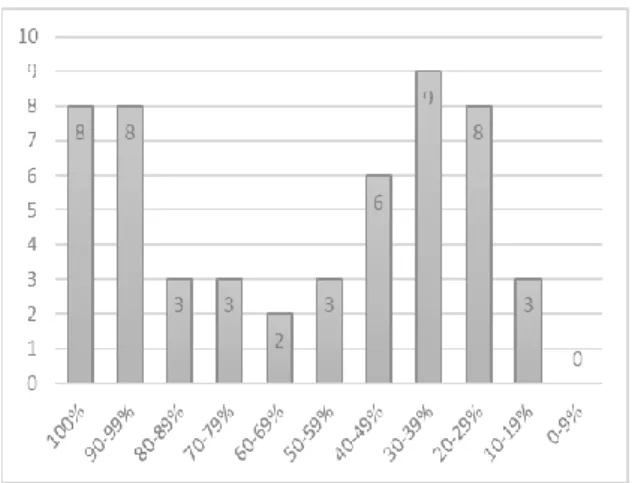
According to DEA assumptions analysed units should be homogenous, in re-spect to the profile of activity, geographical are-spects, size of the company or other features. In this work the author decided to take into account the companies operat-ing in the same sector of economy (machinery manufacturoperat-ing) and the scope of their activity is limited to polish market. There are small, medium and large enterprises included into examination. The results of analysed units outcomes are presented at Figures 3 and 4. The calculation has been made using Frontier Analyst Application software, which is dedicated to DEA method.
Fig. 3. Distribution of efficiency scores
The Figure 3 shows the distribution of the efficiency scores in analyzed group of machinery manufacturing companies. Fully efficient (100% score) is 8 of over 50 units, which account for 15% of all entities. Another 8 achieve over 90% TE, so summing up – 30% of the group obtains very high level of productivity. It is note-worthy that 50% of best performers are large companies, but the rest of them are small producers that employ not more than 25 of staff.
It can be observed that TE scores of 70% and higher account for around 40% of all scores, what proves that those manufacturers quite effectively manage with exploitation of their resources. Still, over 40% of examined units obtain the produc-tivity result at the level of 40% and lower, what indicates considerable reserves for efficiency improvement. DEA method is useful because it also returns as a result benchmarks for inefficient DMUs. For example, a DMU38 (manufacturer of heat exchangers and condensers) obtained efficiency score of 68% – that means there are areas requiring improvements. Companies that are 100% productive, the most technologically similar, and may serve as examples are also determined during the calculation for each inefficient unit, and for DMU38 the benchmarks are: DMU17,
DMU44, DMU52. Hence, the inefficient unit can benefit and learn from their expe-rience, may investigate technological, organizational or other solutions they use, to enhance its own performance.
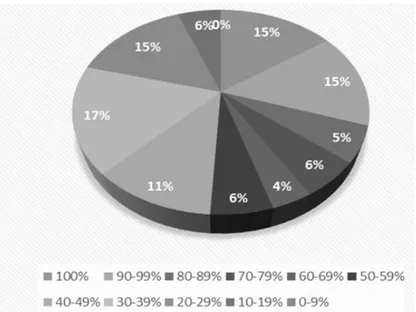
Fig. 4. Percentage distribution of efficiency scores
3.3. Services in analyzed group of polish machinery manufacturers
The author also conducted research for identification whether polish machinery and equipment manufacturers provide any kind of services. As a result (which in details is described in another publication) the catalogue of 13 forms of services was developed. It occurred that every manufacturer of machines and industrial equipment offers at least one type of service (the most common is warranty sup-port), therefore it is highly probable that a pure machinery manufacture sector in Poland no longer exists – everyone is also involved in service business. Neverthe-less, they usually represent low level of innovation maturity (stage 1 and 2) and services are provided generally for customer demand.Once the calculation of technical efficiency is done, more challenging task is to examine the results and identify the differences between the two groups – best performers, namely units that obtained 100% score of efficiency, and inefficient units (TE < 100%). The author finds the Number of Services particularly interest-ing for detailed analysis, therefore the summary of the NoS occurrence was done for both groups and is presented in Table 2.
Table 2. Number of services occurrence in two groups: best performers and inefficient
units
Number of
Services (NoS) Best Performers Inefficient units
1 38.00% 7.00% 2 13.00% 27.00% 3 13.00% 22.00% 4 13.00% 22.00% 5 13.00% 16.00% 6 and more 13.00% 6.00%
It can be noticed that the most frequent NoS in best performers group is 1 form of service – 38% of them offers only warranty support. What seems interesting is that these are mainly small enterprises employing 20–25 of staff. Regardless the limited range of services delivered, they achieve very satisfactory efficiency of performance in comparison to other manufacturers in branch. Large companies from the same group usually offer 4–6 forms of services, and account for 39% of the group. Noteworthy is that comparing both groups – best performers and ineffi-cient units – the major difference in NoS occurrence can be observed for 1 form of service and from 6 and more service types in portfolio. The differences equal 31 and 7 percentage points, respectively.
To analyze the relation between the efficiency score and the Number of Ser-vices, two simple statistics have been calculated. The covariance value for the two variables equals –4.75, and the Pearson correlation coefficient is equal to –0.08. This proves that the relationship between the two variables is negative but the val-ue is very close to zero, so the dependence is very weak and definitely not linear. Hence, it should be stated that basically no significant differences can be observed in terms of NoS in both groups and also technical efficiency scores are insignifi-cantly negatively correlated with the number of services in examined set of ma-chinery and equipment manufacturers.
4. CONCLUSIONS
The results of study presented in this paper shows that analyzed manufacturing companies indicate various level of technical efficiency. Relatively substantial group (30%) obtain satisfactory scores over 90% productivity, however in the same set there are 40% of those which efficiency of performance is somewhat low (be-low 40%). That means they should consider carefully the way of resources utiliza-tion and processes of converting inputs into effects. The analysis of results in re-gards to services allows to draw a conclusion that the range of services, which was
expressed as its number in offering, has no significant impact on technical efficien-cy in analysed group. There is very weak negative relationship between those two characteristics. This study (though its obvious constraints like the scope of study and the arbitrary character of data selection) may advocate for the option that com-bining services into company’s offer or delivering system solution not necessarily reflect positive changes in its performance. The calculation of technical efficiency was done from economic point of view (the output variable as well as one of the inputs were financial in nature) and its results point out no significant differences in group of best performers in comparison to inefficient units taking into account the number of services. Though it should be noted that in the best performers group the percentage of companies that offer 1 form of service is 30 points higher, and those which offer 6 and more types of services – 7 point higher, than in the ineffi-cient units group. It might be questioned whether the Number of Services is a suit-able measure to represent the influence of services on effects that are produced by a company (as the nature of each service, and therefore its impact on company effects, differs a lot from others). However, in order to assess the performance of entity, one approach has to be chosen from available methods, and these are mainly oriented on calculating some indicator using quantity data. The share of revenue, which is associate with services, in overall income would be probably more appro-priate here. Regrettably, such data were not accessible for the author and might be a challenge for future research. Obviously, the study was conducted on the small group of manufacturers, so the conclusions should not be generalized. Nonetheless, the author believes, that the study brings an interesting insight into the field of studying the phenomenon of how product-oriented companies cope with a trend to deliver more customer-specific solutions by providing services and how it is re-flected in the efficiency of its performance.
ACKNOWLEDGEMENTS
The research was conducted within S/WZ/1/2014 project and was financed from Ministry of Science and Higher Education funds.
REFERENCES
Chodakowska E. (2015), The future of evaluation of lower secondary schools’ manage-ment, Business Management and Education, 13(1), pp. 112–112.
Cooper W.W., Seiford L.M., Zhu J. (2004), Handbook on data envelopment analysis, Klu-wer Academic Publishers, Boston.
Debreu G. (1951), The Coefficient of Recourse Utilisation, Econometrica, No 19(3), pp. 273–292.
Domagała A. (2007), Metoda Data Envelopment Analysis jako narzędzie badania względ-nej efektywności techniczwzględ-nej, Badania Operacyjne i Decyzje, No. 3–4, pp. 21–34.
Emerging Market Information Service database, available at <www.emis.com> [accessed: 30.06.2016].
Farrell M.J. (1975), The Measurement of Productive Efficiency, Journal of the Royal Sta-tistical Society, Series A, No. 120(III), pp. 253–281.
Gebauer H., Fleisch E. & Friedli T. (2005), Overcoming the service paradox in manufactu-ring companies, European Management Journal, 23(1), pp. 14–26.
Kozłowska J. (2014), Technical efficiency of Polish companies operating in the couriers and messengers sector – the application of data envelopment analysis method, Quantitative Methods in Economics, XV(2), pp. 339–348.
Meier H., Roy R. & Seliger G. (2010), Industrial Product-Service Systems – IPS2, CIRP Annals-Manufacturing Technology, 59, pp. 607–627.
Mrówczyński K. & Kanikuła S. (2014), Powiew optymizmu w sektorze maszynowym, available at <http://www.magazynprzemyslowy.pl/zarzadzanie-i-rynek/Powiew-op-tymizmu-w-sektorze-maszynowym,4770,2> [accessed: 28 July 2016].
Nazarko J. & Šaparauskas S. (2014), Application of DEA method in efficiency evaluation of public higher education institutions, Technological and Economic Development of Economy, 20(1), pp. 25–44.
Neely A.D. (2009), Exploring the Financial Consequences of the Servitization of Manufacturing, Operations Management Research, Vol. 1, No. 2, pp. 103–118. Perek A. (2014), Wykorzystanie metody DEA do oceny efektywności banków
spółdziel-czych w Polsce, Economics and Management, No. 3, pp. 222–235.
Rangan N., Grabowski R., Aly H.Y. & Pasturka C. (1988), The technical efficiency of US banks, Economy Letters, Vol. 28, Issue 2, pp. 169–185.
Samuelson P. & Nordhaus W. (1995), Ekonomia, t. 1, Wyd. Nauk. PWN, Warszawa. Shelton R. (2009), Integrating product and services innovation, Research – Technology
Management, Vol. 52(3), pp. 38–44.
BIOGRAPHICAL NOTES
Justyna Kozłowska is a PhD student and academic teacher at Bialystok University
of Technology, Faculty of Management. She teaches mathematics, operational re-search, service engineering and forecasting in logistics and information technology. Her research interests are: service science, service management and engineering, pro-ducts and service integration in particular. Her papers appear in numerous journals including: Economy and Management, Quantitative Methods in Economics, and Business Management and Education. She is a member of: International Society for Manufacturing, Service and Management Engineering (ISMSME), Polish Society of Production Management, Scientific Society of Organization and Managing, and Association of Engineering, Project, and Production Management (EPPM).

![[2007/Nr 2] Rola chromu w życiu człowieka](data:image/gif;base64,R0lGODlhAQABAIAAAP///wAAACH5BAEAAAAALAAAAAABAAEAAAICRAEAOw==)