OPTIMIZING PLANT’S MAINTENANCE COST USING
STRATEGIC SWITCHING APPROACH
Buliaminu Kareem *
* Department of Mechanical Engineering, Federal University of Technology, P.M.B. 704, Akure, Ondo State, 34001, Nigeria, Email: karbil2002@yahoo.com
Abstract Inadequate supply of public electricity in Nigeria has affected the productivity of many
manufacturing industries. Electric generating plant is being used as a standby supplement to public electricity at outage hours. The high cost of running and maintenance of this generating plant has adversely affected the sustainability of the industry. A maintenance strategic switching approach was developed to minimize the cost of running the electric generating plant in the industries. Maintenance strategic switching and cost control parameters are preventive, repair/corrective and replacement. The maintenance cycle for each of the components served as tool for the determination of cumulative sum of maintenance cost from which the minimum cost schedule was selected. Data collected on power machinery from a water generating company was used to test the model. The least probability of failure (non-progressive deterioration) for components was recommended for adoption. There was a significant saving in maintenance cost of components under the non-progressive deterioration. In the 750 schedule, while the cost of maintenance with progressive deterioration was N149, 677, that of non-progressive, least failure probability was N75, 960.35 with savings of 49.25% over the former. Therefore, most economic schedule was 750 cycles. This scheme predicted for the organization the optimal maintenance strategy to utilize.
Paper type: Research Paper Published online: 30 July 2013
Vol. 3, No. 3, pp. 193-212 ISSN 2083-4942 (Print) ISSN 2083-4950 (Online)
© 2013 Poznan University of Technology. All rights reserved.
1. INTRODUCTION
Inadequate supply of public electricity in Nigeria has affected the productivity of many manufacturing industries. Electric generating plant is being used as a standby supplement to public electricity at outage hours. The high cost of running and maintenance of this generating plant has adversely affected the sustainability of the industry. A maintenance strategic switching approach was developed to minimize the cost of running the electric generating plant in the industries. Maintenance strategic switching and cost control parameters are preventive, repair/corrective and replace-ment. The maintenance cycle for each of the components served as tool for the deter-mination of cumulative sum of maintenance cost from which the minimum cost sched-ule was selected. Data collected on power machinery from a water generating company was used to test the model. This scheme predicted for the organization the optimal maintenance strategy to utilize. A sequence of maintenance policies that was found to give minimum cost were presented for the organization.
One of the greatest challenges that affect a greater percentage of manufactur-ing industries all over the world, especially in Nigeria, today is on the issue of ade-quate, timely and effective maintenance (Eti and Emovon, 2005). The resultant effects of the aforementioned are uneconomic management of the production in-dustry (Grant and Eugene, 1989). The value of the machine’s output is independent of age, but the natural probability of machine failure increases with age (Ashayeri et al., 1996). Preventive maintenance can be applied to reduce the probability of ma-chine failure (Okah-Avae, 1996). The challenge is to select an optimal preventive maintenance policy / model for the period of ownership (Preinreich, 1990). One of the major factors of production is the machinery (Okah-Avae, 1996). The condition or state of machines used for production goes a long way to determining whether there would be increase in profit, loss of man-hours and even downsizing of the total workforce. Failure rates, maintenance types and technological advancement played a prominent role in determining the status of the production industry (Okoli and Akhighemidu, 2003). This challenge calls for a continuous non-increasing mainte-nance expenditure (Pradhan and Bhol, 2006). The necessary condition for machine age at sale is critical in the determination of optimal economic utility of machinery (Gertsbakh, 1977). It is therefore important to develop a good maintenance scheme for the production machinery (Shepard, 2001). It can be seen that electric generat-ing plants constituted the highest percentage of failures in production machinery in the industry (Eti and Emovon, 2005; Wheelwright, 2008). For this reason, eco-nomic maintenance of the generating plant needs to be critically looked into.
Most production industries all over the globe today are struggling to stay afloat in achieving productivity Austin and Burns, 1985). Amidst the challenges of ma-chine failures during production which usually affect the profitability was in-creased total annual overhead cost incurred in operations (Martand, 2007). The durability of machinery in a production industry is an ultimate goal for
eco-nomic consideration in every aspect of production (Harvey, 1989). This study seeks to develop a strategy that will provide maximum economic maintenance of electric generating plant in a selected production industry. This approach can then be used for any other selected industry taken into consideration the major parame-ters that constituted economic maintenance for that industry. The strategy provided will also enhance system economy in term of manufacturing outputs. Increased annual profits would give room for employment of skilled and the unskilled cate-gories of labor into the company (Levin et. al., 1989). The aim of this study is to develop a strategy for optimizing maintenance of an electric generating plant in a production industry using strategic switching approach. A mathematical model was developed to optimize the process. The model was applied to a water Corpora-tion in Nigeria. The research provides an optimal strategy for economic mainte-nance of electric-power generating plant in Water Corporation in Nigeria.
1.1. General Review of Maintenance Concept
Effective utilization of electric generating plant used as an alternative power source for production has a significant positive effect in the successful running of manufacturing industry, most especially in the power challenging sectors of Nige-rian manufacturing industries. Machineries are the basic tools required by produc-ers to generate outputs (Hans, 1999). There are five types of equipment / machin-ery: production machinery; auxiliary machinery; materials handling equipment; transportation equipment; and office equipment (Corder, 1976).
Production machinery: this refers to all the components in a machine or equip-ment required for active production process. Examples of production machinery in Water Corporation are high-lift pumps, low-lift pumps, generating sets (Aderoba et. al., 2003). Auxiliary machinery: this is the category of machines which does not play a primary role in the production process in the industry. This type of machines includes the blower, backwashing fans, fuel tank etc. (Aderoba et-al, 2003). Mate-rials handling equipment: these are the machines responsible for the ease of con-veying materials or products from one location in the factory to another without much human effort. These include; forklift, small cranes, overhead cranes and trol-leys (Eti and Emovon, 2005). Transportation equipment: these are machines re-quired for the conveyance of goods and services from one point to another for the benefit of the industry. Examples are pick up vans and tankers, (Aderoba et. al., 2003). Office equipment: these are the accessories required in the office for the comfort and ease of working condition for staff and operators of equipment in the industry. These include; furniture of all types- chairs, tables, air-conditioners, file rack etc. (Dunlop, 1990). Among the aforementioned categories of machinery, production machinery was considered. Under this production machinery, electric generating plant and its mechanical components was selected for this study.
According to Ashayeri et-al, (1996), the optimal policy for running a manufac-turing industry required non-increasing rate of maintenance expenditure. The ma-chine age at sale is critical in the determination of optimal efficiency and durability of the machine. There must be explicit distinction between machine’s natural failure rate and the actual failure rate to warrant preventive maintenance policy (Tiwari & Sep-pala, 2009). Replacement of assets is one of the most important and frequently made decisions in maintenance system. The net present value decision model described discounted maintenance cost as difference between cash flows and terminal (salvage) values of the replace and do-not-replace alternatives (Ballal & Lewis, 2009).
A huge drop in annual machinery maintenance costs with reduced failure rate can be achieved year after year if a good maintenance practice is in place. The cost of maintenance is measured with failure rate of the machine on a yearly basis (Grant and Eugene, 1989; Ashayeri et al., 1996). Precision maintenance ensures production at less operational cost (Wheelwright, 2008). This is because it im-proves the reliability of the machinery (Martand, 2007). In preventive maintenance, equipment is maintained before the occurrence of break-down (Basu, 1989). Re-cent studies have shown that preventive maintenance is effective in preventing age related failures of the equipment (Basu, 1989). For random failure patterns which amount to 80% of the failure patterns, condition monitoring proves to be effective (Denbow, 2009). In corrective maintenance, equipment is maintained after break-down (Lawal, 2000). This maintenance is often most expensive because worn equipment can damage other parts and causes multiple damage (Lawal, 2000). Corrective maintenance is carried out on all items where the consequences of fail-ure or wearing-out are not significant, and the cost of this maintenance is not greater than preventive maintenance (Hans, 1999; Denkena, et. al., 2009). Proper management of the aforementioned maintenance strategies will enhance economic maintenance of the equipment in the production industry, especially in Water Corporation. However, if maintenance system is not managed strictly, major dam-ages may occur and the cumulative cost of corrective maintenance may be exorbi-tant. This is the negative trend of maintenance in most of the industries today.
Electric power is the major factor for consideration in setting up any produc-tion outfit or industry anywhere in the world. This required adequate planning for power resources in order to avoid disruptions due to power outages along produc-tion or manufacturing lines in the industry. Hence, the need for a strategy of opti-mizing maintenance of the electric generating plant in the Water Corporation. Most industries today are grossly affected by inadequate and ineffective maintenance challenges. Maintenance approach by most production industries today cannot cater for the new trends in the maintenance of components of the electric generat-ing plant. The approach of industries to maintenance of this nature is based on con-ventional progressive deterioration. This paper has provided an alternative ap-proach by considering the non-progressive deterioration. The rest of paper is pre-sented this: methods of approach are detailed in Section 2; results and discussion
are in Section 3; Section 4 concludes the study; and acknowledgements are pre-sented in Section 5.
2. METHODOLOGY
2.1. Modelling Conditions
Modeling conditions involved in this study is based on maintenance strategies namely; preventive/routine, repair/displacement, and replacement:
Preventive / routine maintenance: this is a form of maintenance that is carried out to enable the elongation of the lifespan of any of the machine components. It can be carried out by following the stipulated period/cycle by the manufacturers, in hours, weeks or on a monthly basis, depending on the service requirement of the machine (Li and Nilkitsaranont, 2009).
Replacement: this is the form of corrective maintenance that is done by making necessary changes to affected machine parts to restored efficient functionality of the machine (Lawal, 2000).
Displacement/repair: this is the maintenance that is carried out when a particu-lar technological advancement or innovation performs better that the component used initially or by reason of high output demand. The equipment can be upgraded through repairing/displacement of some of the components (Denkena et al, 2009). Components can undergo progressive and non-progressive deterioration (Preinreich, 1990; Corder, 1976). Presented in Fig. 1 is the proposed maintenance strategic switch-ing approach showswitch-ing the relationships among the considered parameters, namely: failure pattern of components of the plant; maintenance groupings (preventive, re-placement, and repair) of components; progressive and non-progressive policies; and strategic switching to minimize cumulative maintenance cost of plant.
Fig. 1 Hierarchical Strategic Switching of Maintenance Parameters
2.2. Model Development
In developing the model, the parameters considered include the Reliability of the machines,
R
(t
)
, the Probability of failure of the machines,P
(t
)
(Taha, 2008). The maintenance cycle for preventive maintenance is,t
p, the maintenance cycle for repair maintenance is,t
r, and the maintenance cycle for replacement maintenance, tc, were put into consideration. The economic preventive mainte-nance rate is given as,
ipt, while that for economic repair maintenance is given ast
i r
, and economic replacement maintenance is
ict
. Where,
ipt is the failurerate for preventive maintenance,
irt is the failure rate for repair maintenance,t
i c
is the failure rate for replacement maintenance, then reliability based on negative exponential distribution of equipment /component i in plant j is respectively expressed as: i p t R )( t i p
e
fort
t
p (1) i r t R )( eirt for r p
t
t
(2)
i ct
R )
(
eict for c r t t t (3)The corresponding probabilities of component failures for preventive, repair and replacement are respectively given as:
i p i p R t t P( ) 1 ( ) (4) i r i r R t t P( ) 1 ( ) (5) i c i c
R
t
t
P
(
)
1
(
)
(6)where, the preventive cost per cycle for component, i =Cip, repair cost per cycle for component, i = Cri and replacement cost per cycle for component, i =
i c
C
, In the formulation of the model for the optimal maintenance of electric generating plant, the conventional progressive deterioration approach was applied. Progressive deterio-ration refers to the maintenance strategy where the components of the plant are allowed to keep on working without replacing the component until they get damaged. This type of maintenance planning is prevalent in many developing countries. The cost of maintenance based on progressive deterioration of the component, i is respectively modeled as,i p i p i pm C P t C ( ) (7) i r i r i rm C P t C ( ) (8) i c i c i c
m
C
P
t
C
(
)
(9)Where, Cipmtotal cost of components for preventive maintenance; C m
i
r total cost of components for repair maintenance; and
C
cim
total cost of components for replacement maintenanceThe outcomes of equations (4), (5), (6), (7), (8) and (9) were used to estimate total maintenance cost for the components (i, … , k) in the plant j based on maintenance cycle expressed as equation (10).
k i k i i c i c i r i r i p k i i p i j C P t C P t C P t C 1 1 1 ) ( ) ( ) ( (10)and this is equivalent to,
k i i cm k i i rm k i i pm i m C C C C 1 1 1 (11a)The optimal cost of maintenance is the minimum cost,
C
mi*That is,
min
C
mi
C
mi* (11b)A new concept known as non-progressive deterioration was developed and integrated into the model. Non-progressive deterioration of the components explains the situation where the machine’s components are replaced or restored before the actual failure of the plant. It was assumed that the replacement of the failed component has restored the plant to a new status. If the components are restored to as new ones by maintenance actions that is; non-progressive deterioration, then the maintenance cost for the three scenarios are respectively,
i p i p p i pm t t C P t C / ( ) (12) i r i r r i rm t t C P t C / ( ) (13) i c i c c i c
m
t
t
C
P
t
C
/
(
)
(14)Where,
t
is the maintenance cycle time,t
p is the maintenance cycle for preventive maintenance, tc is the maintenance cycle for replacement maintenance, andt
r is the maintenance cycle for repair maintenance.
Similarly, as formulated in progressive deterioration, the total cumulative cost for non-progressive deterioration maintenance system is then given as
k i i cm c k i i rm r k i i pm p i m t t C t t C t t C C 1 1 1 / / / (15)The optimal cost is the minimum cost of maintenance,
C
mi**That is,
min
C
mi
C
mi**In the three scenarios, the replacement time of the machine/component happens at maintenance cycle time,
t
when the cumulative cost of maintenanceC
mi is greater than initial cost of components, Ci.For a single component;
i cm i rm i pm i m C C C C (16)
If
C
mi*,
C
mi**
C
i then replace the component and if otherwise the components should not be replaced, instead, other types of maintenance policies may be considered.2.3. Model Application to a Water Corporation’s Generating Plant
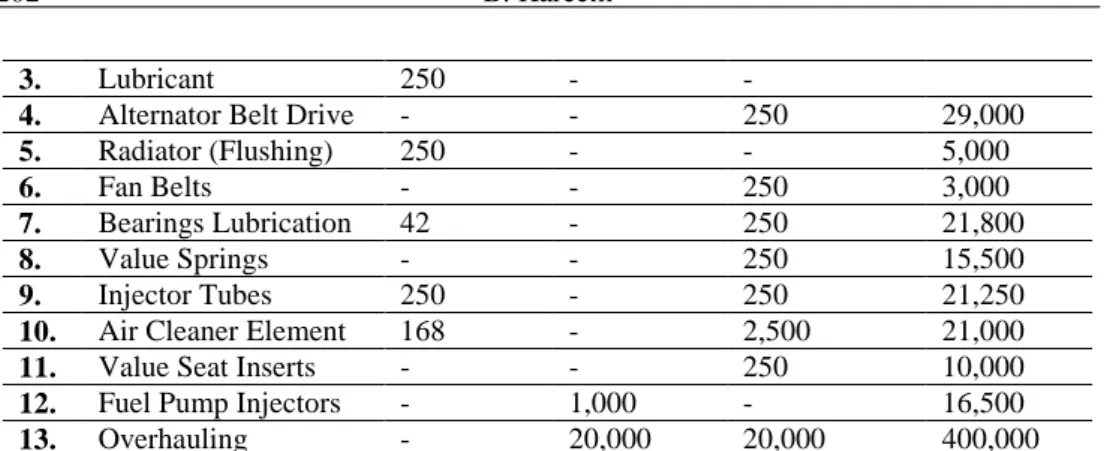
This is an establishment vested with the responsibilities of producing on a constant basis, highly hygienic potable water to the entire population of a city in Nigeria. The entire city has a well structured pipeline network for the effective distribution of water to towns and villages. Due to the epileptic nature of public electric power supply to energize the pumps, all the water schemes, booster stations and head-works are powered by the aid of heavy duty generating sets. This varies from 50KVA to the maximum of 2.2MVA (i.e. 2200KVA). There were over sev-enty (70) of such heavy duty generators in the city. Data on generating plant com-ponents (alternator, fuel pump, oil filter, fuel filter, lubricant, fan belts, bearings lubrication, valve springs, air cleaner element, injectors, overhauling, etc) and their maintenance schedules (preventive, repair and replacement) were collected. These data were analyzed as shown in Table 1. Table 1 is the summary of the sampled components of the electric power generating plant that was considered for the study. The components were grouped into the maintenance schedules of preven-tive, repair and replacement based on their respective maintenance cycles as stipu-lated by the manufacturer. The maintenance parts ranging from the oil filter, fuel filter, lubricant for the servicing of the generator, alternator belt drive, radiator (flushing), fan belts, bearing lubrication, valve springs, injector tubes, air cleaning element, fuel pump injectors and overhauling are constituents of maintenance ma-terials that required replacement, routine checks, or displacement as the case may be. These spare- parts were re-grouped according to the standardized time/schedule of maintenance as specified by the manufacturer.
Preventive maintenance, for example, the stipulated change/check period was 250 hours for the oil filter, fuel filter, lubricating, radiator flushing and fuel pump injector. The items for repair were fuel pump injectors and overhauling at 1000 and 20,000 hours, respectively. At this time/schedule, the user was required to carry out necessary maintenance as stipulated. The schedules for replacements were also indicated against their materials. For the basis of this study, the cost of mainte-nance of each of the components of the plant was considered in evaluating the fi-nancial or economic implication of the respective maintenance strategy. The re-spective schedules of maintenance were presented in the table with the costs in Naira (Naira, N, is the symbol for Nigeria currency, N250 is equivalent to 1USD approx.). The schedules were re-grouped into respective maintenance policies (preventive, repair and replacement), which served as input into the model.
Table 1 Maintenance Schedule for 350KVA Perkin Generator
S/N Materials/parts Preventive (hrs) Repair (hrs) Replacement (hrs) Cost(N) 1. Oil Filter 250 - - 26,000 2. Fuel Filter 250 - -
3. Lubricant 250 - -
4. Alternator Belt Drive - - 250 29,000
5. Radiator (Flushing) 250 - - 5,000
6. Fan Belts - - 250 3,000
7. Bearings Lubrication 42 - 250 21,800
8. Value Springs - - 250 15,500
9. Injector Tubes 250 - 250 21,250
10. Air Cleaner Element 168 - 2,500 21,000
11. Value Seat Inserts - - 250 10,000
12. Fuel Pump Injectors - 1,000 - 16,500
13. Overhauling - 20,000 20,000 400,000
In Table 2, the detailed schedule maintenance chart for the preventive aspect of the study is shown. The table is divided into fourteen (14) time/schedule inter-vals. For example, radiator flushing was to be carried out at every 250 hours. Then the next schedule was 500 hours. All components covered under preventive maintenance were scheduled into the 250 hours intervals [items (i), (ii) and (v)], 42 hours interval and 168 hours as indicated on the manual. The duration of re-placement of maintenance materials was mainly dependent on the reliability or failure rate of the plant components. This explains why changes in intervals for some materials were 42 hours, 250 hours, 1000 hours and 2000 hours depending on the type of maintenance material with respect to its lifespan (Table 2).
Table 2 Time Schedule for Preventive Maintenance Material/
cycle
Servicing, oil
filter, fuel filter, lubricant (i) (hrs) Radiator flushing (ii) (hrs) Bearing lubrication (iii) (hrs) Air cleaner element (iv) (hrs) Injector tubes (v) (hrs) 1 250 250 42 168 250 2 500 500 84 336 500 3 750 750 126 504 750 4 1000 1000 168 672 1000 5 1250 1250 210 840 1250 6 1500 1500 252 1008 1500 7 1750 1750 294 1176 1750 8 2000 2000 336 1344 2000 9 2250 2250 378 1512 2250 10 2500 2500 420 1680 2500 11 2750 2750 462 1848 2750 12 3000 3000 504 2016 3000 13 3250 3250 546 2184 3250 14 3500 3500 588 2352 3500
Table 3 is the time schedule interval for replacement maintenance for the plant. The overhauling was to be carried out after every 20,000 hours. The injector pump tubes required check and replacement after every 2500 hours. Other items under replacement maintenance were alternator’s belt drive, fan belts, bearing lubrication, valve springs, air cleaner element and fuel pump. Materials for maintenance under replacement were assumed to be completely replaced with new ones. Given in Ta-ble 4 are the schedule intervals for repair maintenance for the plant. The materials covered here are mainly fuel pump injector and the overhauling. The fuel pump injector was done at every 1000 hours while the overhauling at every 20,000 hours. It took a longer period for these materials to get worn-out.
Table 3 Time Schedule for Replacement
Spare parts/ cycle Alternat or belt drive (hrs) Fan belt (hrs) Bearing (hrs) Valve springs (hrs) Injector tubes (hrs) Air cleaner element (hrs) Fuel pump (hrs) Overha uling (hrs) 1 250 250 250 250 2500 2500 2000 20000 2 500 500 500 500 5000 5000 4000 40000 3 750 750 750 750 7500 7500 6000 60000 4 1000 1000 1000 1000 10000 10000 8000 80000 5 1250 1250 1250 1250 6 1500 1500 1500 1500 7 1750 1750 1750 1750 8 2000 2000 2000 2000 9 2250 2250 2250 2250 10 2500 2500 2500 2500 11 2750 2750 2750 2750 12 3000 3000 3000 3000 13 3250 3250 3250 3250 14 3500 3500 3500 3500
Table 4 Time Schedule for Repair
Parts Time/(hrs) (hrs) (hrs) (hrs)
Fuel Pump Injector 1000 2000 3000 4000
Overhauling 20,000 40,000 60,000 80,000
Time intervals of failures for these components were arranged based on their failure tendency (probability of failure) which can be either long-termed or short. For example, overhauling is long-termed. The parts affected here include pistons, rings, sleeves, and connecting rods, whose wear frequency is very low. Fuel filters and oil filter elements have very short useful lifespan because of the short-termed collapsible nature of the internal structure of the elements.
3. RESULTS AND DISCUSSION
The results obtained after testing the model are highlighted in this section. The resulting probabilities of failure obtained from the case study are as presented in Tables 5- 14.
3.1. Reliability of the Plant under Preventive Policy
Reliability for preventive maintenance at 750 hrs schedule is shown in Ta-ble 5a. The least reliaTa-ble policy was obtained at 84 hour-cycle while the most relia-ble one was at 500 hour-cycle. Under the 1500 schedule, the least reliarelia-ble component was obtained at 42 hour maintenance cycle while the most reliable was at 500 hour cycle. These were also replicated in schedules 2250 and 3000, respectively.
Table 5a Reliability R(tp ) of the Plant under Preventive Policy
R(tp )/ Actual mtce Time (hrs) 750 (hrs) 1500 (hrs) 2250 (hrs) 3000 (hrs) 42 1.769 x 10⁻⁸ 3.13 x 10⁻¹⁶ 5.54 x 10⁻²⁴ 9.8 x 10⁻³² 84 0.0001 3.33 x 10⁻⁴ 2.35 x 10⁻¹² 3.13 x 10⁻⁶ 250 0.0498 0.0025 0.00012 6.14 x 10⁻⁶ 336 0.1069 0.0114 1.22 x 10⁻³ 1.31 x 10⁻⁴ 500 0.2231 0.0498 0.111 2.48 x 10⁻³
Table 5b Probability of failure P(tp ) under preventive maintenance policy
P(tp ) / Actual mtce Time (hrs) 750 (hrs) 1500 (hrs) 2250 (hrs) 3000 (hrs) 42 1.0000 1.0000 1.0000 1.0000 84 0.9999 1.0000 1.0000 0.9999 250 0.9502 0.9975 0.9999 0.9999 336 0.8930 0.8860 0.9978 0.9998 500 0.7769 0.9502 0.8890 0.9975
In Table 5b, the preventive maintenance policy for probability of failure, under the 750 schedule was presented. The least probability of failure occurs at the 500 maintenance cycle while the highest probability of failure occurs at the 42 hour maintenance cycle. Under the 1500 schedule, the least probability of failure occurs at the 336 hour- cycle, while the highest probability for this schedule occured at 42 and 84 maintenance cycles, respectively. This is also replicated in the 2250 and 3000 schedules. It could be noted here that the tendency of failure of the machine component occurs at the least maintenance cycle. It is therefore safer to replace
the components before the end of this cycle to prevent premature failure of the component. There is need to pay particular attention to this maintenance schedule to avoid any unnecessary breakdown.
3.2. Reliability of the Plant under Replacement Policy
In the reliability Table 6a for replacement, in each of the schedules from 750 hour to 3000 hour, the reliabilities increases down the schedules. This indicates that the 20,000 maintenance cycle was the most reliable component under replacement mainte-nance. It is therefore cost effective to effect replacement at the higher hour cycle.
Table 6a Reliability R(tr) of components for Replacement Maintenance Policy
R(tr)/ Actual mtce Time (hrs) 750 (hrs) 1500 (hrs) 2250 (hrs) 3000 (hrs) 250 0.0498 0.0025 0.0001 6.14 x 10⁻⁶ 500 0.2231 0.0498 0.0111 0.0025 750 0.3679 0.1423 0.0537 0.0185 1000 0.4724 0.2231 0.1054 0.0498 2500 0.7408 0.5488 0.4066 0.3012 20,000 0.9632 0.9277 0.8936 0.8607
In Table 6b, the probability of failure for replacement decreases down the table from the 750 schedule to the 3000 schedule. This meant that the highest probability of failure for replacement occurred at the lower maintenance cycle of 250, 500, 750 etc. The plant’s components under the replacement maintenance were most reliable at the highest maintenance cycle than at the lower cycles. Maintenance should promptly be carried out at the time of attaining lower maintenance cycles. This will ensure that failure does not occur to disrupt production activities.
Table 6b Probability of Failure of components for Replacement Policy Prob. of failure at Scheduled
mtce cycle P(tr )/ Actual mtce
Time (hrs) 750 (hrs) 1500 (hrs) 2250 (hrs) 3000 (hrs) 250 0.9502 0.9975 0.9999 0.9999 500 0.7769 0.9502 0.9889 0.9975 750 0.6321 0.8577 0.9463 0.9815 1000 0.5276 0.4512 0.8946 0.9502 2500 0.2592 0.4512 0.5934 0.6988 20,000 0.0368 0.0723 0.1064 0.1392
3.3. Reliability of the Plant under Repair Policy
In Table 7a, it was observed that the reliability of the plant components in-creases from top to the bottom of each of the schedules from the 1000-20000 hrs. It was advisable to carry out maintenance at the period allotted to it. Failure to car-ry out such maintenance will allow the component to fail pre-maturely, and may adversely affect other components and thereby increase maintenance cost. This model made the provision that there was no need of waiting until the component got damaged before repair was done. This can be done by making the replacement before failure occurs (Table 7b).
Table 7a Reliability of components for Repair Maintenance Policy Reliability at Scheduled
mtce cycle
R(tc)/Actual mtce Time (hrs)
750 (hrs) 1500 (hrs) 2250 (hrs) 3000 (hrs) 1000 0.4724 0.2231 0.1054 0.0498 2000 0.6873 0.4724 0.3247 0.2231 3000 0.7788 0.6096 0.4759 0.3716 4000 0.8290 0.6873 0.5698 0.4723 20,000 0.9632 0.9277 0.8936 0.8607
Table 7b Probability of Failure of components for Repair Maintenance Policy Prob. of failure at Scheduled
mtce cycle P(tc)/ Actual mtce Time (hrs) 750 (hrs) 1500 (hrs) 2250 (hrs) 3000 (hrs) 1000 0.5276 0.7769 0.8946 0.9502 2000 0.3127 0.5276 0.6753 0.7769 3000 0.2212 0.3904 0.5241 0.6284 4000 0.1709 0.3127 0.4302 0.5276 20,000 0.0368 0.0723 0.1064 0.1392
From the Table 8, total cost of components’ maintenance under progressive de-terioration, the component with highest probability of failure was the worst scenar-io, while the maintenance with the least failure probability was termed the best scenario (Table 9). In all the schedules of Table 8 (750, 1500, 2250 and 3000), the preventive policy has a uniformity of cost of N95, 050. In the 750 schedule, the repair policy cost was zero; hence no repair maintenance was required at those cycles. In this schedule, the preventive maintenance policy has the highest cost followed by the replacement maintenance. In the 1500 schedule, the highest cost was recorded in the preventive maintenance, while replacement policy had the least cost. Under the 2250 schedule, the preventive maintained the lead in cost while
the repair had the least cost. The same was observed in the 3000 schedule. A steady increase observed in the total cost from the 750 to 3000 schedule (that is N149, 677 to N156, 180.5 and N162, 989.34 to N166, 186.34, respectively).
The replacement maintenance had its least cost fall at the 1500 maintenance schedule. This implied that carrying out replacement maintenance at this schedule would be the most economical (save cost) and less failure prone than waiting until the 3000 maintenance schedule.
Table 8 Total Cost of Maintenance with Respect to Highest Failure Probability Schedule Policy 750 (hrs) 1500 (hrs) 2250 (hrs) 3000 (hrs) Preventive 95,050 95,050 95,050 95,050 Repair 0 16,458.75 16,499.84 16,499.84 Replacement 54,636.5 4,471.75 51,439.5 54,636.5 Total 149,686.5 156,180.5 162,989.34 166,186.34
In the table 9 the consideration is on the total cumulative cost incurred on the components’ maintenance under progressive deterioration with the highest probability of failure (the worst scenario) in place. In the 750 schedule, no repair maintenance was carried out since it had zero value. The highest cost was observed in the preventive maintenance policy, N285, 121.49. In the 1500 maintenance schedule, repair maintenance policy had the least cost, while preventive maintained the highest cost, N570, 300. In the 2250 maintenance schedule, preventive had the highest cost followed by replacement and the least was repair maintenance. The same also occurred in the 3000 schedule. Repair maintenance had the best (minimum) maintenance cost. The best time to carry out the preventive and re-placement maintenance was at the 750 cycles.
Table 9 Total Cost of Maintenance under Progressive Deterioration Schedule/ Policy 750 (hrs) 1500 (hrs) 2250 (hrs) 3000 (hrs) Preventive (N) 285,121.49 570,300 855,400 1,140,600 Repair (N) 0 24,688.13 148,498 49,499.52 Replacement (N) 163,909.5 268,030.5 462,955.5 655,638 Total 449,030.99 863,018.63 1,466,904.1 1,845,737.52
Table 10 indicates the cost of maintenance based on least failure probability. The preventive maintenance policy was expensive but optimized that of progres-sive deterioration by about 74%. There was no repair maintenance in the 750 schedule while the cost of maintenance increases across the schedules. The most effective cost to maintain was in the 750 schedule.
Table 10 Total Cost of Maintenance under Non-Progressive Deterioration Schedule/ Policy 750 (hrs) 1500 (hrs) 2250 (hrs) 3000 (hrs) Preventive (N) 73,844.35 84,214.30 84,499.45 94,812.38 Repair (N) 0.00 1,192.95 1,755.60 2,296.8 Replacement (N) 2,116.00 4,157.25 6,118.00 8,004.00 Total 75,960.35 89,564.5 92,373.05 105,113.18
3.4. Optimality for Maintenance Policies
In Table 11, highest cost was observed in the preventive maintenance policy. There was no repair maintenance in 750 hrs schedule. Throughout the schedules, the preventive maintenance policy had the highest cost followed by replacement maintenance. The least cost was repair maintenance. The highest cost of repair maintenance was observed at the 2250 schedule.
Table 11 Cumulative Cost for Non-Progressive deterioration Schedule Policy 750 (hrs) 1500 (hrs) 2250 (hrs) 3000 (hrs) Preventive (N) 221,533.04 505,285.80 760,495.05 1,137,748.50 Repair (N) 0 1,789.43 15,800.40 6,890.40 Replacement (N) 6,348.00 24,943.50 55,062.00 96,048.00 Total (N) 227,881.04 532,018.73 831,357.45 1,240,686.90 0.00 500,000.00 1,000,000.00 1,500,000.00 2,000,000.00 1 2 3 4 maintenance schedule CO S T (N) Least probability of failure highest probability of failure
Fig. 2 Cumulative cost of progressive and non-progressive deteriorations
Fig. 2 compares the total cumulative cost on maintenance using the highest and least probabilities of failure. At 750-hour schedule, the total cumulative cost of the highest probability was N449, 030.99 while that of the least probability was
N227, 881.04. There was high disparity of N221, 149.95. This disparity was signif-icant that the surplus can be utilized to solving some other maintenance or adminis-trative problems. In the 1500 schedule, the highest probability has a total of N863, 018.63 while the least probability has N532, 018.73 with difference of N330, 999.90. In the 2250 schedule, the highest probability has N1, 466, 904.10 while the least probability has N831, 357.45, and it defers by N635, 546.65. For the 3000 schedule, the highest probability recorded N1, 845, 737.52. This was about eight-een times the amount used to carry out the total maintenance in the 3000 schedule under the least probability of failure. The highest amount for total cumulative for least probability of failure is N831, 357.45 while that of highest probability is N 1,845,737.52. A lot of money was saved by adopting non-progressive deteriora-tion over progressive.
0.00 50,000.00 100,000.00 150,000.00 200,000.00 750 1500 2250 3000 Schedule C os t ( N ) least probability highest probability
Fig. 3 Cost of components using least and highest probabilities
In comparing the total cost of components with respect to high and least proba-bilities, there was a remarkable disparity between the total cost of components in Figs. 2 and 3. Therefore, the least probability of failure (non-progressive deteriora-tion) for components was recommended for adoption. There was a significant sav-ing in maintenance cost of components under the non-progressive deterioration. In the 750 schedule, while the cost of maintenance with progressive deterioration was N149, 677, that of non-progressive, least failure probability was N75, 960.35 with savings of 49.25% over the former. Therefore, most economic schedule was 750 cycles. The summary of the differences in the total cost based on least or high-est probability of failure was presented by Table 12, from which the highhigh-est per-centage difference lies with 750-hrs schedule.
Table 12 Difference in total cost based on least or highest probability of failure Maintenance Schedule/ cost 750 (hrs) 1500 (hrs) 2250 (hrs) 3000 (hrs)
Cost wrt progressive 149, 677 156, 180.50 162, 989.34 166, 186.34 Cost wrt non-progressive 75, 960.35 89, 564.50 92, 373.05 105, 113.18 Difference/ % 73, 716.65 /49.25% 66, 616 /42.65% 70, 616.29 / 43.32% 61,073.16 /36.75%
4. CONCLUSION
Most manufacturing industries all over the world today are experiencing chal-lenges with production in the area of electric power as a significant input for the factor of producing new products. Among these challenges are inadequate maintenance strategies or policies employed to checkmate this negative trend as it affects the totality of the industry on the overhead and general running of the industry if not adequately addressed. The conventional maintenance procedures utilized in the industry can no longer cope with latest and vibrant technological challenges in the areas of components’ rebranding and miniaturization. This study has adequately addressed the problem of electric power plant failure through provi-sion of adequate maintenance scheduling method that disallowed component pro-gressive deterioration. The method of continuous or propro-gressive deterioration em-ployed to tackle maintenance problems in the industry will keep machines and power plant operable whenever there was public electric power outage. The main-tenance switching strategy provided has solved the problem of operations of the corporation by providing effective guidelines for choosing the best maintenance option(s) that can sustain the prevailing production system. The developed ap-proach can be extended for solving maintenance problem in other production or-ganizations by careful identification of critical components of the plant and their maintenance cycles. The maintenance switching mechanism provided can be ap-plied to minimize maintenance costs. From the results it can be concluded that non-progressive strategy was promising for Corporation’s maintenance management. It was the most economic maintenance plan (preventive, repair, or replacement) be-cause of its timely checkmating unplanned sudden damages and high maintenance cost. Study on the effects of changing maintenance environment such as speeds, temperatures and vibration on maintenance cost will be treated in the future.
ACKNOWLEDGEMENTS
The author acknowledges the Federal University of Technology, Akure, Nigeria for providing necessary facilities for the successful completion of this study.
The contribution of Adewumi, A.S., a postgraduate student in the Department of Mechanical Engineering, Federal University of Technology, Akure, Nigeria, in the collection of part of data used in this study is appreciated.
REFERENCES
Aderoba, A. A., Kareem B., and Ogedengbe, T.I. (2003). “A Model for Progressive Inventory Management for Job-Shop. Nigerian Journal of Engineering Management (NJEM), Vol. 4, No. 1. pp. 1-6.
Ashayeri, J. Teelen, A. and Selen, W. (1996). “A Production and Maintenance Model for the Process Industry”. International Journal of Production Research, Vol. 34 No. 12,, pp. 3311-26.
Austin, M.L., Burns J.R. (1985). “Management Science and Aid for Managerial Design Making”. Macmillan Publishing Company, New York.
Ballal, O., and Lewis, F. (2009). “Condition-Based Maintenance Using Dynamic Decisions by Petri Nets and Dempster-Shafer Theory: a Matrix-based Approach”. Transaction of the Institute of Measurement and Control, Vol. 31, No. 3-4, pp. 323-340.
Basu, P.B. (1989). “Operation Research for Engineers”. Oxford and IBH Publishing Company Ltd, New Delhi.
Corder, A.S. (1976). “Maintenance Management Techniques”. McGraw-Hill, Maidenhead. Denbow, N. (2009). “Outsourcing: Condition monitoring: Outsourcing Support for
Engineers Process Engineering”. Vol. 90 , No. 4, pp. 27-28.
Denkena, B., Mohring, H.C., Blumel, p., Robbing, J., Pruschek, P. (2009). “Condition-Based Maintenance Planning”. (Zustandsorientierte Instandhaltungsplanung and Steuerung) VDI Berichte (2065). pp. 225-236.
Dunlop, C.L. (1990) . “A Practical Guild to Maintenance Engineering”. Butterworth & CO (Publishes) Ltd, International Edition.
Eti, M.N., and Emovon, I. (2005). “Strategic Dimensions of Maintenance Management”. Comp. of Engineering Monograph (CEM). Vol.2, No.3. pp. 17-27.
Gertsbakh, I.B. (1977). “Models of Preventive Maintenance”. Prentice hall, North-Holland, Amsterdam.
Grant, I.E., and Eugene, L. (1989). “Handbook of Industrial Engineering and Management”. Prentice-Hall of India Private Ltd., New Delhi.
Hans, L. (1999). “Management of Industrial Maintenance-Economic Evaluation of Maintenance Policies”. International Journal of Operations and Production Management, Vol. 19 Issue: 7, pp 716-737.
Harvey, M.W. (1989). “Application to Management Decision”. Prentice Hall, India Lawal, Y.O. (2000). “Maintenance Culture: The Nigerian Situation”. Nigerian Journal of
Engineering Management, (NJEM), Vol. 1, No. 4. PP. 38-43.
Levin, R.L., Rubin, D.S., Simpson, J.P., and Gardener, E.S. (1989). “Quantitative approach to management”. McGraw-Hill Book Company, new York.
Li, Y.G., and Nilkitsaranont, P.(2009). “Gas Turbine Performance Prognostic for Condition-Based Maintenance” Applied Energy, Vol. 86, No. 10, pp. 2152-2161 Martand, T.T. (2007). “ Production Management”. S.Chand & Company Ltd.
Okah–Avae, B.E. (1996). “The Science of Industrial Machinery and System Maintenance”. Spectrum Book Ltd. Nigeria
Okoli, J.U., and Akhighemidu, C.O. (2003). “Failure Prevention Strategies in Pipeline Operations in the Niger Delta Area of Nigeria”. Nig. Journal Ind. and System Studies, Vol.2, No. 2. pp. 61-66.
Pradhan, M.K., and Bhol, J.P. (2006). “Trend and Perspectives in Industrial Maintenance Management Technical Proceeding of National Symposium on recent Development in Industrial Maintenance Management”. Aril 22nd, 2006 SIET, Dhenkanal, pp. 27-35.
Preinreich, G. (1990). “The Economic Life of Industrial Equipment”. Econometrical Journal, Vol. 8, pp. 12-44.
Shepard, R.N. (2001). “On subjectively optimum selection among multi-attribute alternatives”, in M.W. Shelly and G.L. Bryan, eds.; Human Judgment and Optimality, pp 279-280, Wiley, New York.
Taha, H.A. (2008). “Operations Research: an Introduction”. Prentice-Hall of India Private Ltd, New Delhi.
Tiwari R. and Seppala, J. (2009). “Effective maintenance: Asset monitoring for a Low-voltage Integrated Motor Control System (IMCS): A case study”. ABB Review, Vol. 1, pp. 20-25
Wheelwright, S.C. (2008). “Manufacturing strategy: defining the missing link”. Strategic Managerial Journal, Vol. 5, pp 71-91.
BIOGRAPHICAL NOTES
Buliaminu Kareem is an Associate Professor in the Department of Mechanical Engineering of the Federal University of Technology, Akure, Nigeria. He holds the degrees of B.Eng. in Mechanical Engineering (1994), M.Eng. in Production Engineering (1999), and P.hD. in Industrial Engineering (2004) from the same Institution. He specializes in industrial systems’ design, optimization, and maintenance from which he has published several papers in reputable journals and books of conference proceedings. He has registered with engineering professional bodies including Council for the Regulation of Engineering in Nigeria (COREN), International Association for Engineers (IAENG), and World Assembly of Sciences, Engineering and Technology (WASET).