STUDIES IN PHYSICAL CULTURE AND TOURISM Vol. 14, No. 2, 2007
MAŁGORZATA WASZAK1, KRYSTYNA CIEŚLIK1, MAŁGORZATA GRABOWSKA2 1
University School of Physical Education in Poznań 2
Mikołaj Kopernik University of Toruń
PHYSICAL ACTIVITY AS A MODIFIER OF THE COURSE OF MENOPAUSE
Key words: physical capacity, menopause, physical activity.
ABSTRACT
The study attempted to investigate how a biological feature, i.e. physical capacity, that has developed due to physical activity, can modify the course of menopause in comparison with other biological and cultural determinants. The study material comprised measurements and questionnaire data collected from 347 women aged 39-75 years. Our results show that the occurrence and intensity of menopausal symptoms depend on many biological and environmental determinants. Higher physical capacity, stronger body structure and better health are all related to increased physical activity and higher level of education. Physical activity is a factor which strongly affects the course of menopause, and physically non-smoking urban active women who are in good health experience less severe menopausal symptoms.
INTRODUCTION
Menopause (climacteric) is not an unequi-vocal concept, yet, according to recommendations of the International Federation of Gynecology and Obstetrics regarding gynecological terminology, it should denote the period which spans several years preceding the last menstruation and several years which follow it [2].
Menopause is a natural and genetically programmed physiological process leading to expiration of ovarian function with the resulting cessation of reproductive capacity. Menopause involves both somatic and mental changes and is a particularly difficult period in every woman’s life, often being the time of negation and re-evaluation arising from the awareness of an irreversible loss of the attributes of youth.
Estrogen deficiency in perimenopausal women is responsible for the onset of several characteristic menopausal symptoms. Early meno-pausal symptoms include vasomotor symptoms – these occur most early and are reported by the highest proportion of women – such as hot flushes, excessive sweating, vertigo, increased body tempe-rature; and an array of psychological symptoms, such as irritability, depression and insomnia. In addition to irregular menstruation, menopausal syndromes also involve development of atrophic changes in the genitourinary tract, i.e. urinary incontinence, vaginal atrophy, atrophy of the external genital skin and vaginal dryness, as well as sexual dysfunction and loss of libido [15, 10, 4, 13, 20].
Late symptoms of estrogen deficiency, which develop several years after the last menstruation,
Correspondence should be addressed to: Małgorzata Waszak, University School of Physical Education, Królowej Jadwigi 27/39, 61-871 Poznań, e-mail: waszak@awf.poznan.pl
include cardiovascular diseases and osteoporosis [12]. Estrogen deficiency has a negative influence on various tissues and organs – adverse changes have been observed in the skin, heart, urinary tract, liver, blood vessels, bones and the brain [21].
Menopause is experienced by each woman differently, and the only unquestionably common symptom is the loss of menses; the remaining symptoms vary in their incidence and severity – some women find perimenopausal symptoms to be only a mild discomfort, whereas for others they constitute a major health problem.
Problems of menopause in women have long been the subject of extensive research and have been widely written about. However, despite researchers’ great interest in the subject, the evidence based on data concerning menopause and its various consequences is rather limited, and there is significant scarcity of reports concerning the impact of physical activity on the course of meno-pause and the occurrence of menopausal symptoms. As research on menopause problems primarily focuses on its physiological, medical and social aspects, we have decided to study the scarcely investigated role of physical activity in the course of menopause and its effects on the type, incidence and severity of menopausal symptoms.
The chief aim of our work was the analysis of the role of physical activity in the course of menopause. The following research tasks were set forth:
1) Determining the elements of lifestyle with the most significant impact on women’s health status.
2) Determining whether physical activity in the premenopausal period and perimenopausal period affects the type and severity of meno-pausal symptoms experienced by women.
METHODS Study material
The study material comprised measurements and questionnaire data collected between 2002 and 2004 from 347 women, aged 39-75 years, living in the Cuiavia-Pomerania Province in Poland. The research tool was a questionnaire that investigated the following aspects:
1) Socio-economic conditions:
– place of birth and residence,
– education,
– type of job,
– source of income and family budget,
– household and accommodation conditions. 2) Lifestyle:
– physical activity,
– type of leisure activities,
– smoking.
3) Current health status and health history:
– patient’s history, i.e. most frequent diseases and disorders,
– ongoing diseases and disorders,
– self-assessment of the health status,
– age and menopause characteristics,
– occurrence and severity of menopausal
symptoms.
The subjects’ physical activity was evaluated using the Pilicz physical capacity test and the following motor skills were evaluated:
– reaction time based on the time needed to catch a falling stick;
– dynamic endurance based on the number of times legs could be lifted to a vertical position from supine position;
– explosive strength based on the length of jump from a standing position;
– dynamic endurance measured with a modified Burpee test;
– flexibility measured by the degree of trunk stooping downward from a standing position.
The results of these tests were presented in the form of a numerical score following the trans-formation using the Pilicz norms, and thus allowing for evaluation of the subjects’ general physical capacity (GPC) regardless of their age [16].
Based on the Pilicz table of norms the following general physical capacity categories were proposed: 1 = Poor and very poor; 2 = Satisfactory; 3 = Good and very good. The first category encompassed 20.2% of women and the remaining two 48.7% and 31.1%, respectively.
The subjects’ anthropometric measurements were also taken, i.e. body weight and body height for BMI; waist and hip girth for waist to hip ratio (WHR); arm and lower leg girth and the arm, subscapular and suprailiac skin fold thickness. Biological and cultural variables used in the study were categorized.
General characteristics of biological and cultural variables
Of all the subjects, 254 women (73.20%) were born in the city and 93 (26.80%) were born in
the country; 308 (88.76%) women were city dwellers and most of them, i.e. 268 (77.23%), lived in cities with the population over 100,000 inha-bitants; whereas 40 women (11.53%) lived in small cities of less than 100,000 inhabitants; the rema-ining subjects (11.24%) lived in the country. 43.8% of subjects were college graduates, 44.09% com-pleted their secondary education, 7.20% comcom-pleted their secondary vocational education and 4.90% had only primary education.
220 women (63.40%) reported to have been undertaking physical activities, i.e. taking part in organised sports activities or exercised on their own at home for at least nine months preceding the study as compared with the group of 127 women (36.60%) considered physically inactive. The popu-lation of physically active women was characte-rised by higher mean values of somatic parameters as compared with the inactive subjects.
Statistical methods
The following statistical methods were used in the analysis:
– χ2 test to detect correlations betweens the pairs
of variables;
– One-factor variance analysis for continuous variables and selected factors to find out whet-her the values of a dependent variable are the same for all factor categories;
– Two-factor analysis to find out whether there is interaction between two factors;
– Multiple regression analysis to implement a hierarchy of factors with regard to their impact on a given dependent variable, and a progressive stepwise method used to eliminate non-signi-ficant factors;
– Shapiro-Wilk test for measurement of obliqueness and flattening, used to check for the normal distribution of continuous variables.
RESULTS
At the beginning of the study the group of physically active women was compared with the group of physically inactive women with regard to their morphological features. The former was characterised by higher mean values of somatic parameters (Table 1).
Variance analysis was performed to investigate the relationship between the women’s physical capacity and selected biological
characteristics and environmental factors. The results of one-factor variance nalysis for the mean values of general physical capacity in the analysed population differ significantly with regard to the analysed factors (with the exception of smoking) (Table 2).
As shown in the analyses, the differences in general physical capacity were statistically signi-ficant and depended on the level of physical activity, leisure activities, level of education, source of income, stage of a woman’s life and type of menopause. The differences have been presented in Figures 1-8:
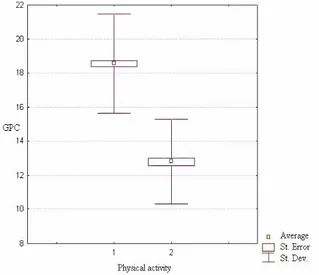
Fig. 1 clearly shows that physically active women display a significantly higher level of general physical capacity than physically inactive women.
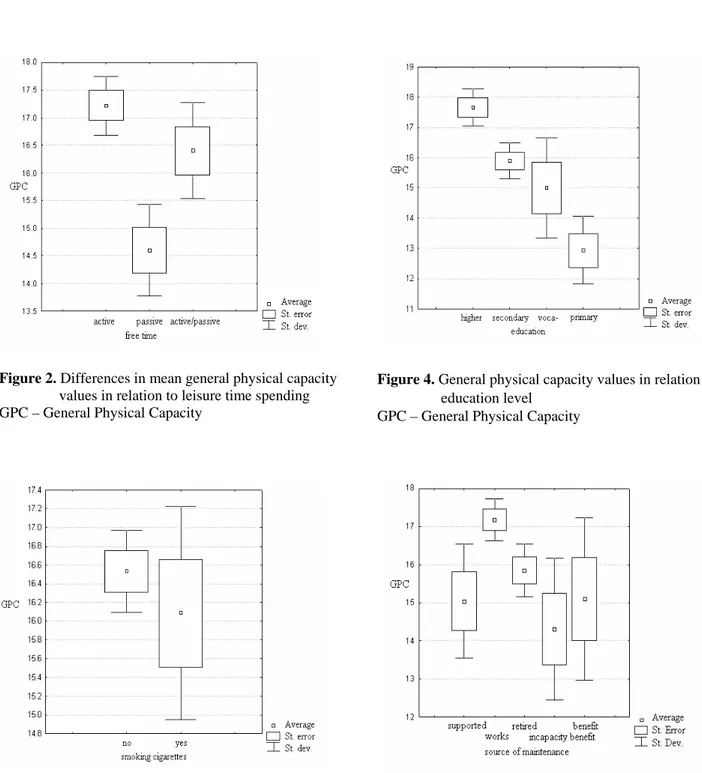
Physical capacity values are the highest among women who actively spend their leisure time; lower in women who spend when only some time on physical activity and the lowest in those women who declare spending their leisure time passively (Fig. 2).
Smoking is related to lower general physical capacity values, and non-smoking women have higher physical capacity (Fig. 3). Although this correlation is statistically non-significant, yet the mentioned tendency can be seen in the graphic presentation.
Figure 4 shows that higher general physical capacity is related to higher levels of education.
Working women appear to be the most physically capable. The mean physical capacity values were similar for retired women, those on benefits and those supported by another person. The lowest physical capacity was noted among women receiving incapacity benefits (Fig. 5).
An age-related decrease in general physical capacity is a natural phenomenon and therefore the oldest postmenopausal women had their general physical capacity lower than premenopausal or perimenopausal women (Fig. 5). Physical capacity was the lowest among women undergoing hormonally controlled menopause, whereas in women with natural and artificially induced menopause their general physical capacity was comparable and slightly higher. General physical capacity proved to be the highest in premenopausal women (Fig. 6).
Additionally, a two-factor variant analysis was carried out to investigate the relationship between the subjects’ physical capacity and their
Figure 1. Differences in mean general physical capacity values in relation to physical activity
1 – Physically active women, 2 – Physically inactive women, GPC – General Physical Capacity
Table 2. Results of one-factor variant analysis of the mean values of general physical capacity and selected factors Degrees of freedom Factor f1 f2 F p Physical activity 1 345 346.691 0.000** Leisure time activities 2 344 13.945 0.000**
Smoking 1 345 0.645 0.423
Education category 3 343 12.679 0.000** Source of income 4 342 0.517 0.001** Stage of life 2 344 4.855 0.008** Type of menopause 3 343 3.054 0.029* F – Snedecor’s F-test value, p – probability
Table 1. Somatic parameters of the analysed groups
Feature Activity X Min. Max SD
1 162.96 150.00 177.00 5.24 Body height 2 161.80 143.00 176.00 5.30 1 63.83 42.00 93.00 8.77 Body weight 2 70.13 40.00 119.00 13.75 1 24.08 17.06 35.00 3.13 BMI 2 26.75 17.31 39.76 4.86 1 21.04 8.00 46.00 6.23
Arm skin fold
2 23.58 6.00 45.00 7.87
1 21.49 7.00 42.00 7.75
Subscapular skin fold
2 23.64 5.00 46.00 9.59
1 19.25 4.50 47.00 8.29
Abdominal skin fold
2 21.68 3.00 58.00 10.46
1 20.87 8.00 45.00 6.68
Lower leg skin fold
2 23.43 7.50 55.00 9.99
1 27.24 20.00 39.00 2.55
Arm circumference
2 29.47 21.00 67.00 5.23
1 35.32 28.00 44.00 2.50
Lower leg circumference
2 36.50 26.50 51.00 3.80 1 76.89 41.00 105.00 8.96 Waist circumference 2 85.20 60.00 145.00 8.59 1 100.64 61.00 123.00 7.27 Hip circumference 2 104.66 83.00 140.00 10.11 1 0.76 0.63 0.95 0.06 WHR 2 0.81 0.65 1.06 0.08
Figure 2. Differences in mean general physical capacity values in relation to leisure time spending GPC – General Physical Capacity
Figure 3. General physical capacity values in relation to smoking
GPC – General Physical Capacity
Figure 4. General physical capacity values in relation to education level
GPC – General Physical Capacity
Figure 5. General physical capacity values in relation to the source of income
Figure 6. General physical capacity values in relation to the stage of life
Figure 7. General physical capacity values in relation to the type of menopause
GPC – General Physical Capacity
place of birth and residence (Fig. 8). Both the city-born and city dwellers displayed higher general physical capacity values than those born and living in the country.
Pearson’s χ2 test was used in the analysis of subjects’ self-assessed health status and its relation to physical capacity and physical activity (Table 3).
The results of self-assessment of the health status reveal a statistically significant relationship with the degree of physical activity and general
Figure 8. General physical capacity values in relation to place of birth and residence
GPC – General Physical Capacity
physical capacity. The more physically active the subjects were and the higher their general physical capacity was, the better they perceived their health status.
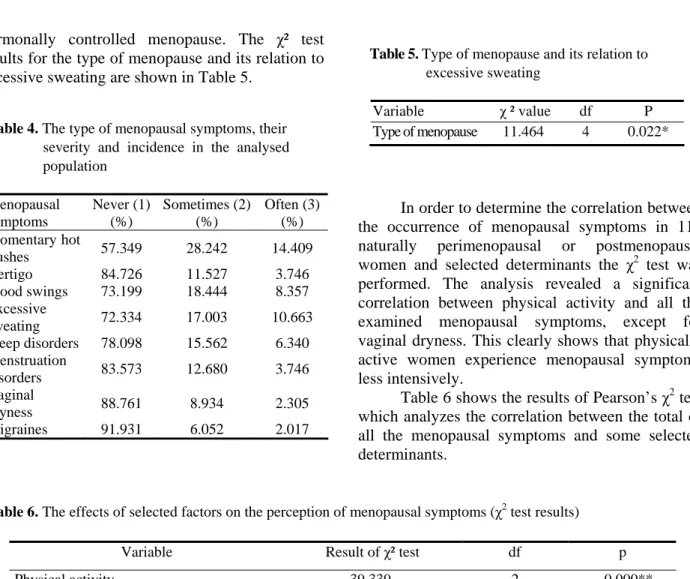
Another field of investigation involved the type of menopausal symptoms and their severity in relation to selected biological and cultural factors. The type of menopausal symptoms, their severity and incidence have been shown in Table 4. It was found that the most common symptoms included momentary hot flushes, excessive sweating and mood swings.
Table 3. Health status and its relation to physical capacity and physical activity (χ2 test)
Variable χ² value df p Physical activity 26.958 4 0.000** General physical
capacity 40.881 8 0.000**
df – degrees of freedom, p – probability
In order to investigate a potential link between the course of menopause and the type of climacteric symptoms Pearson’s χ² test was used to analyse values from 164 subjects. Thus obtained results allowed us to conclude that the type of menopause was related to the occurrence of only one symptom, i.e. excessive sweating. Women who experienced excessive sweating most often inclu-ded those currently undergoing or having already undergone natural menopause. Excessive sweating was experienced least frequently by women with
hormonally controlled menopause. The χ² test results for the type of menopause and its relation to excessive sweating are shown in Table 5.
In order to determine the correlation between the occurrence of menopausal symptoms in 118 naturally perimenopausal or postmenopausal women and selected determinants the χ2 test was performed. The analysis revealed a significant correlation between physical activity and all the examined menopausal symptoms, except for vaginal dryness. This clearly shows that physically active women experience menopausal symptoms less intensively.
Table 5. Type of menopause and its relation to excessive sweating
Variable χ ² value df P Type of menopause 11.464 4 0.022* Table 4. The type of menopausal symptoms, their
severity and incidence in the analysed population Menopausal symptoms Never (1) (%) Sometimes (2) (%) Often (3) (%) Momentary hot flushes 57.349 28.242 14.409 Vertigo 84.726 11.527 3.746 Mood swings 73.199 18.444 8.357 Excessive sweating 72.334 17.003 10.663 Sleep disorders 78.098 15.562 6.340 Menstruation disorders 83.573 12.680 3.746 Vaginal dryness 88.761 8.934 2.305 Migraines 91.931 6.052 2.017
Table 6 shows the results of Pearson’s χ2 test which analyzes the correlation between the total of all the menopausal symptoms and some selected determinants.
Table 6. The effects of selected factors on the perception of menopausal symptoms (χ2 test results)
Variable Result of χ² test df p
Physical activity 39.339 2 0.000**
Place of birth (city vs country) 1.443 2 0.486
Place of residence (city vs country) 14.418 2 0.001**
Education 9.665 6 0.139
Type of job 3.502 6 0.744
Source of income 9.859 8 0.275
Family budget 2.892 4 0.576
Household conditions 5.285 2 0.071
Leisure time spending 1.372 3 0.849
Use of contraception 2.024 2 0.364
Diseases 3.778 2 0.151
Smoking 8.126 2 0.017*
Number of cigarettes smoked daily 0.687 2 0.709
Past history of smoking (for how long) 7.226 4 0.124
Health status self-assessment 8.164 4 0.086
Duration of menstrual cycle 2.692 4 0.611
Number of pregnancies 9.672 6 0.139
Number of children born 4.511 6 0.608
Menarche age category 2.880 4 0.578
Menstrual cycle regularity 2.476 2 0.290
The categorised total of menopausal symp-toms significantly depends only on the extent of physical activity, place of residence and smoking status. Rural, inactive and smoking women expe-rience menopausal symptoms more often.
DISCUSSION
Our study confirms a statistically significant effect of physical activity on the occurrence and severity of menopausal symptoms in women with a natural menopause (both perimenopausal and postmenopausal women). This correlation is the strongest for the occurrence of hot flushes, excessive sweating, sleep disorders and mood swings. Physically active women experience these symptoms less intensely. No correlation was detected between physical activity and vaginal dryness.
There have been numerous publications concerning various aspects of physical activity and its positive impact on the course of menopause in women. According to Lock and Kaufert [14] the low severity of menopausal symptoms in Japanese women is the effect of healthy diet and a high level of physical activity. Kaczmarek and Szwed [11] observed that women who engaged in sports during the perimenopausal period experienced hot flushes and migraine less often than physically inactive women, and the effect of physical activity on those symptoms was statistically significant. Ivarsson et al. [9] reported that physically active Swedish women exercising for more than two hours a week experienced significantly fewer vasomotor symptoms than those leading sedentary lives. One explanation may be that physically active women may have grown accustomed to feeling hot and to sweating and thus do not report any of these as particularly disturbing experiences. Another possible explanation may be that in women who regularly exercise neuromediators are released, which stabilises the function of the thermoregu-latory centre in the brain.
Based on the results of research carried out in Australia, Dennerstein [4] reported that menopausal symptoms were less of a problem among women exercising at least once a week. Coope [3] showed that physical exercise could be effective in preventing hot flushes – moderate and severe hot flushes were about 50% less frequent in Swedish women who were physically active (21.5%) as compared with inactive women (43.8%). This
report also analyzes the role of relaxation training carried out in a London university hospital in reducing the incidence of hot flushes and other symptoms. Guthrie et al. [6], however, present a different opinion and they do not find any correlation between the level of physical activity and the severity of the symptoms of natural menopause. Their conclusions may be to some extent justified, considering the types of physical activity they analysed, as they include such non-strenuous activities as gardening and walking the dog. As a result, the level of such physical activity did not have any major impact on how Australian women experienced the symptoms of their meno-pause.
The reports from other authors often suggest the existence of a correlation between the mood and general wellbeing of menopausal women as well as their physical activity and physical capacity. Improvement in the overall wellbeing in perimenopausal women due to regular physical exercise was noticed by Prywer [17]. In their study of women over 50 years of age Stefaniak [19] observed a significant increase in their physical capacity after six months of physical exercise which co-occurred with increased assertiveness and vitality. Based on the subjects’ responses Guthrie et al. [6] reported that good health, good mood and overall wellbeing, as well as a low stress level, are significantly related to physical exercise undertaken at least once a week.
Analysing the intensity of climacteric symptoms in relation to selected morphological parameters it can be concluded that the rise in BMI and body weight is accompanied with increased intensity of menopausal symptoms such as hot flushes, excessive sweating and vertigo. The data on the impact of obesity on the intensity of climacteric symptoms are unequivocal. Skałba [18] suggests that obesity can favour occurrence of excessive sweating and hot flushes, which remains in agreement with the results of our study. Leidy [13] showed in her studies that women of BMI <23 experienced mood swings and depression more often, while Erlik et al. [5] reported that women with higher body weight experienced milder climacteric symptoms – higher intensity of these symptoms and a more pronounced decrease in the level of estrogens can be observed in women with low body weight, which confirms the role of fat tissue in extraglandular aromatisation of androgens. It is hard to find out which of the two findings is closer to the truth, as the cause of climacteric
symptoms has not been yet fully established. Assuming that hot flushes stem from a complex interaction of neurotransmitters in thermoregulatory central nervous system centres, then obesity should predispose to such symptoms. However, once it is assumed that climacteric symptoms stem from decreased estrogen levels, then women with higher body weight should experience milder symptoms, as menopausal estrogen deficiency is to some extent alleviated by extraglandular estrogen production in the adipose tissue.
The impact of health status and lifestyle on the course of menopause was also investigated, and it was found that women in poor health suffered more intense climacteric symptoms as compared with healthy women. Such results could be expected as diseases of genital organs, respiratory tract and cardiovascular diseases can exacerbate the intensity of menopausal symptoms [12].
Smoking also affects the intensity of menopausal symptoms [12, 3, 13, 11] and studies have shown that it decreases the level of estrogens [2] and induces cardiovascular diseases, thus increasing the intensity of menopausal symptoms.
Our results also show that there is a correlation between the subjects’ education and the intensity of menopausal symptoms, i.e. women with lower education suffered from menopausal symp-toms more than women with secondary education or a college degree. Similar results were obtained by other researchers, i.e. Abe and Moritsuka [1], Hunter [8], Coope [3] and Leidy [13].
The results of our study confirm the other researchers’ suggestions pertaining to significant correlations between the place of birth and residence and the course of menopause [8, 7, 3, 20] – women born and living in cities experience milder climacteric symptoms.
Our results show that the occurrence and intensity of menopausal symptoms in women depend on many biological and environmental determinants. Higher physical capacity, stronger bodily structure and better health are related to increased physical activity and better education. Women who are physically active, non-smokers, in good health, born and living in the city experience milder climacteric symptoms. The importance of advocating a healthy lifestyle is extremely important, as it can predispose to a milder course of menopause.
REFERENCES
[1] Abe T., Moritsuka T., A case – control study on climacteric symptoms and complaints of Japanese women by symptomatic type for psychological variables, Maturitas, 1986, 8: 255-265.
[2] Baron J.A., La Vecchia C., Levi F., The antiestro-genic effect of cigarette smoking in women,
American Journal of Obstetrics and Gynaecology,
1990, 162: 505-514.
[3] Coope J., Hormonal and non-hormonal interven-tions for menopausal symptoms, Maturitas, 1996, 23: 159-168.
[4] Dennerstein L., Well–being, symptoms and the menopausal transition, Maturitas, 1996, 23: 147-157. [5] Erlik Y., Meldrum D.R., Judd H.L., Estrogen
levels in postmenopausal women with hot flushes,
Obstetric and Gynaecology, 1982, 59: 403-407.
[6] Guthrie J.R., Smith A.M.A., Dennerstein L., Morse C., Physical activity and the menopause experience: a cross – sectional study, Maturitas, 1995, 20: 71-80.
[7] Holte A., Influences of natural menopause on health complains: A prospective study of healthy Norwegian women, Maturitas, 1992, 14: 127-141. [8] Hunter M., Battersby R., Whitehead M.,
Relation-ships between psychological symptoms, somatic complaints and menopausal status, Maturitas, 1986, 8: 217-228.
[9] Ivarsson T., Spetz, A.C., Hammar M., Physical exercise and vasomotor symptoms in postmeno-pausal women, Maturitas, 1998, 29: 139-146. [10] Jakowicki J., Klimakterium, Problemy kliniczne.
Hormonalna terapia zastępcza (Climacteric, clinical problems, supplementary hormonal therapy), Wydawnictwo FOLIUM, Lublin 1995.
[11] Kaczmarek M., Szwed A., Wpływ warunków życia kobiet na wiek menopauzy oraz przebieg kli-makterium u kobiet (Influence of women’s lifestyle on climacteric age and the course of menopause), (in:) A. Jopkiewicz, Auksologia a promocja
zdro-wia, Kielce 2000, vol. 2: 67-75.
[12] Kronenberg F., Hot Flashes: phenomenology, quality of life, and search for treatment options,
Experimental Gerontology, 1994, vol. 29: 319-336.
[13] Leidy L.E., Symptoms of menopause in relation to the timing of reproductive events and past meno-pausal experience, American Journal of Human
Biology 8, 1996, pp. 761-769.
[14] Lock M., Kaufert P., Menopause, Local Biologies, and Cultures of Aging, American Journal of
[15] McKinlay S.M., Jefferys M., Thompson B., An investigation of the age at menopause, Journal of
Biosocial Science, 1972, 4: 161-173.
[18] Skałba P., Endokrynologia ginekologiczna (Gyne-cological endocrinology), Wydawnictwo Lekarskie PZWL, Warszawa 1998.
[19] Stefaniak T., Trening siłowy + 50, Body Life 3 (Strength training + 50, Body Life 3) Warszawa 2004 vol. 1: 22-24.
[16] Pilicz S., Gdzie sprawność – tam zdrowie (Where there is fitness, there is health), Sport i Turystyka, Warszawa 1984.
[17] Prywer J., Wpływ rekreacyjnych ćwiczeń gimna-stycznych na wybrane cechy somatyczne i moto-ryczne u kobiet w okresie menopauzy (The effect of recreational exercise on selected somatic and motor traits in women during menopause), (in:) Biologia populacji ludzkich współczesnych i pra-dziejowych (Biology of ancient and modern human populations), Słupsk 1992, pp. 359-362.
[20] Warennik-Szymankiewicz A., Klimakterium (Cli-macteric), Kliniczna Perinatologia i Ginekologia, 1996, vol. 16: 66-74.
[21] Wellmann J., Wromer E., Hormony (Hormones), Diogenes Grupa Wydawnicza Bertelsmann, War-szawa 2000.