Corresponding author: sodrikos@phed.uoa.gr
1 National and Kapodistrian University of Athens, School of Physical Education and Sport Science, Athens, Greece 2 Aristotle University of Thessaloniki, School of Physical Education and Sport Science, Thessaloniki, Greece
Received: 5 September 2019 Accepted: 12 December 2019
SOTIRIOS DRIKOS1, KONSTANTINOS SOTIROPOULOS1, SOPHIA D. PAPADOPOULOU2,
KAROLINA BARZOUKA1
Multivariate analysis of the success factors in high-level male
volleyball: a longitudinal study
TRENDS
in
Sport Sciences
2019; 26(4): 177-185 ISSN 2299-9590 DOI: 10.23829/TSS.2019.26.4-6 AbstractIntroduction. In volleyball a team’s performance in skills is connected to the game result and to the team’s success in a championship. Apart from analyzing the importance of each skill separately, assessing performance after classifying teams based on their ranking can be an effective procedure to understand
the performance determinants. Aim of Study. The aim of the
present study was to identify those parameters that discriminate the teams ranked in positions 1-2 from those ranked in positions 3-4, 5-6, 7-8, 9-10 and 11-12, through a longitudinal analysis of
12 championships of the Greek Volleyball League. Material and
Methods. Performance data for all teams of 12 Greek Volleyball championships from 2005-2006 until 2016-2017 (n = 143) was used. The effectiveness of twelve (12) parameters from 5 basic volleyball skills: serve, attack after serve’s pass, attack after the defence, block and reception were examined. Multinomial logistic regression was used in order to model the relationship
between predictors and membership in the six groups. Results.
The multinomial logistic regression model was fitting well. The best predictors of a team’s success in the final ranking are serve errors, serve aces, passing errors, win attack after serve’s pass and after defence, and avoidance of blocked attack after serve’s pass. The increase of one unit in each one of these parameters increases the odds of being in the superior teams’ group. The relevant function classified correctly 79.2% of the teams in
positions 1-2 and 65.7% in all groups. Conclusions. Volleyball
coaches should focus more on the specific scoring skills of serve and attack in order to improve them aiming at increasing their team’s odds to be in the superior group.
KEYWORDS: match analysis, skills, attack, performance indicators, outcome, coaching.
Introduction
Q
uantitative analysis, performance evaluation and statistical processing are becoming an increasingly important process for those involved in several sports and, in particular, in team sports. Especially in volleyball, it is important to collect data from the observation and evaluation of the sport skills in order to carry out match analysis, to make decisions during matches and to analyze home team and opponents in a competition [18]. Volleyball is offered for such analyses due to the large number of contacts made by players during the match so as to ensure the adequate analysis of a team’s technical and tactical performance [23].Volleyball consists of a series of individual skills that are highly relevant to the team’s performance and success [8]. Tsivika and Papadopoulou [28] pointed out that each of these skills has its own special value and specific gravity in the game, and, therefore this should be taken into serious account during training planning. Three of them are scoring skills: serve, attack (split in attack 1 after reception & attack 2 after defence), block, and the rest are non-scoring skills: pass, setting and dig [11]. Scoring skills have a stronger correlation with the
result [15]. However, as for the serve, in more recent studies, Pena et al. [21] have pinpointed the limited importance of the technical skill of the serve and in extension to this, Kountouris et al. [14] mentioned that in men’s high-level volleyball serve is a disadvantage for the team which is to perform it.
On the other hand, the attack is the main factor to predict whether a team will win or lose [3, 10] without distinguishing attack after a pass from attack after defence. Zetou et al. [29] using data from an Olympic tournament proved that effectiveness in complex 1 (pass–setting–attack 1) can predict winners in men’s top-level volleyball, and attack after defence is the most important skill for a team’s performance during complex 2 (serve–block–setting–attack 2) [30]. In addition, the block is the skill that differentiates teams of level 1 from the teams of level 2 with data from 2000 Olympic Games [18], but its recording and evaluation are difficult since only blocks with a touch of the ball are recorded. Many coaches attribute the main reason for a defeat to poor efficiency in the reception. The importance of reception has been confirmed in many types of studies [2, 11], while other studies [7, 12] proposed the avoidance of direct errors to be of equal importance with accurate pass.
The use of accumulated data in order to determine elements that encourage winning in a single championship [18, 19] or a tournament [8, 24] is frequent as an effective procedure to understand better the performance determinants. In addition, studies using data from a series of championships or tournaments [4, 20, 26] analyzed the effect of team level on skill performance, with each level consisting of 4 or more teams. Nevertheless, in the regulations of a typical league, the play-off format is used. So, the advantage of playing more play-off matches in home court exists for every higher pair of teams in the final ranking. Teams placed in first and second position of regular-season final ranking have home advantage against all the other teams until the finals. Teams ranked in third and fourth position of regular season have a home advantage against all the lower ranked teams until semi-finals, and so on. That is the reason why it could be of some interest to analyse teams in the relevant pairs as described above.
Aim of Study
The aim of the present study was to identify those parameters that discriminate the teams ranked in positions 1-2 from those ranked in positions 3-4, 5-6, 7-8, 9-10 and 11-12 respectively, through a longitudinal analysis of 12 championships of the Greek Volleyball
League. Multinomial logistic regression was used in order to model the relationship between predictors and membership in the six groups.
Material and Methods
In the regular season of Greek Volleyleague 12 clubs are involved every season. Each club competes with the rest of the teams twice (home and away matches) in a double round-robin system. Additional play-off games among the first eight teams of the regular season, as well as play-out games among the teams holding the 9th–12th positions take place. In play-off/out games there is a home advantage for the highest-ranked team during all phases of the procedure.
In the Greek men’s league a software system to collect, elaborate and analyze statistical data has been established. The official system used in men’s Greek Volleyball Professional League is Data Volley with the main purpose to record and analyze the performance of teams and players. The skills recorded are: serve, reception, attack 1 (after serve’s pass), attack 2 (after defence) and block. The sample (n = 143) of the present study consists of the performance data of each team of the Greek male Volleyleague from 12 seasons (2005-2006 until 2016-2017) recorded by the Data Volley users. A team which disqualified before the end of the regular season from the championship 2011-2012 was excluded from the sample. The primary recorded and evaluated skills from 1562 matches were: 257.184 serves, 216.140 passes, 181.811 attacks 1 (after serve’s pass), 103.106 attacks 2 (after defence) and 109.022 blocks. For the evaluation of each skill, a six-level ordinal scale was employed, with the value of “one” indicating a poorly executed skill and the value of “six” an excellent executed skill. Further definitions for the evaluation scale per skill are included in Drikos et al. [9] about the serve, Costa et al. [6] about the attack, Palao et al. [18] about the block, and Drikos [7] about the reception.
The reliability of the data collection and entry was checked by an independent observer as following: all the matches are video recorded and for each championship five particular match days were randomly selected (30 matches per season, 23% of the total sample) and an independent observer who was a volleyball coach, participating in the league either as a club’s or national team’s coach, expert in evaluation and recording of volleyball performance data and excellent user of the software, re-evaluated all the skills. The Adjusted Κappa Cohen was Adjusted Κappa = 0.81, very good [1]. The intra-observer reliability was tested in previous studies [10]
using the intraclass correlation coefficient and finding it to be in highly acceptable levels (>0.90). Set statistics included variables of effectiveness (the number of the categorized events divided by the total number of events and multiplied by 100) for serve, serve’s pass, attack 1 (after serve’s pass), attack 2 (after defence) and block. So the data set consisted of the following twelve (12) performance indicators: 1) serve error %, 2) serve ace %, 3) pass error %, 4) pass precise % (pass perfect %+ pass excellent %), 5) attack 1 errors %, 6) attacks 1 stuffed by win block %, 7) attack 1 win %, 8) attack 2 errors %, 9) attacks 2 stuffed by win block %, 10) attack 2 win %, 11) block points %, 12) block errors %.
Descriptive statistics was applied in order to determine means and standard deviations for the teams grouped as: group 1 (teams ranked in 1st-2nd position), group 2 (teams ranked in 3rd-4th position), group 3 (teams ranked in 5th-6th position), group 4 (teams ranked in 7th-8th position), group 5 (teams ranked in 9th-10th position) and group 6 (teams ranked in 11th-12th position) for each independent variable. A one-way factor analysis of variance (ANOVA) with Bonferroni corrected, pairwise comparisons were employed to compare group differences. Effect sizes (ES) based upon the partial eta squared (np2) were calculated to show the magnitude
of the effect with the following interpretation criteria adopted by Cohen [5]: 0.001-0.05 = small effect, 0.06-0.13 = medium effect, ≥0.14 = large effect.
In order to proceed in multivariate analysis, the absence of multicollinearity was verified through the level of simple correlation among independent variables and the level of tolerance and variance inflation factor (VIF). As the acceptable value of VIF, the value 10 and less than 10 was set [25].
A multinomial logistic regression analysis was conducted to construct models that could predict the differences between the six groups of teams. Therefore, likelihood ratio tests were conducted to test the overall effect of each independent variable on the model. Independent variables that had an overall significant effect (p < 0.05) were subsequently identified. Odds ratio and 95% confidence of intervals (CIs) were reported. The odds ratio is the chance in odds of being in one of the categories of the dependent variable. Actually it is the probability of the event (outcome) occurring in the observed characteristics versus the non-observed characteristics. An important feature of the multivariate logistic regression is that it estimates k-1 models, where k is the number of levels of the outcome variable. In this case, group 1, as the superior level group, is selected as the reference group, in order to facilitate the comparison
between teams of subsequent levels. Therefore, since the parameter estimates are relative to the reference group, the standard interpretation of the multinomial logit is that for a unit change in the predictor variable, the logistic of comparison outcome relative to the base outcome is expected to change by its odds ratio given that the other characteristics in the model remain unchanged. An alternative way to interpret multinomial logistic regression analysis is, if the odds ratio of the predictor variable is more than 1, the comparison outcome is more likely to occur, and if it is less than one, the base outcome is more likely to occur. That is, the further the odds ratio from 1, the more influential the predictor [27].
Results
Table 1 summarizes all the variables employed in this study for teams’ performance-related statistics for all groups. An ANOVA revealed significant differences for all the variables except serve errors, block win and block error.
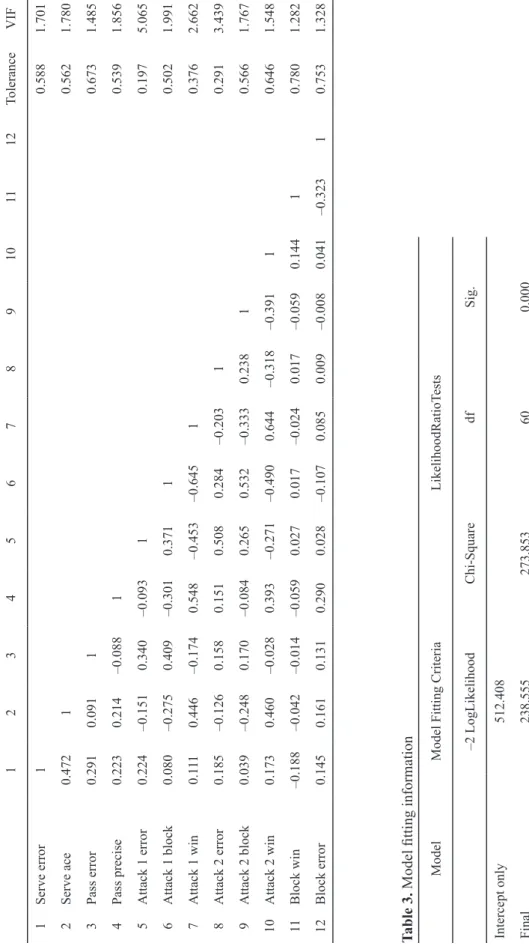
In the data set, there were no missing values, extreme scores, or outliers, and the basic statistical assumptions were tested and met. In particular, there was no multicollinearity between the dependent variables as the simple correlations, presented in Table 2 were all <|0.65|). In addition, based on the statistics presented in Table 2 the twelve variables appear not to be affected even by moderate collinearity as variance inflation factors were lower than 10 (from 1.282 for block win to 5.065 for attack 1 error). Only the variable attack 1 error presents a tolerance value in the range of 0.2 but it is associated with a VIF of 5 and moderate correlation indices ≤|0.5| with other independent variables. Consequently, according to Stevens [25] this is not considered problematic and, therefore, it was included in the analysis.
Table 3 summarizes all the model fitting information. In addition to the predictors of the model that contained only the intercept, the fit between the final model and the data improved significantly, χ2 (60, N = 143) =
273.853, Nagelkerke R2 = 0.877, p < 0.001. There was
a pretty good model fit (discrimination among groups) on the basis of the twelve performance indicators, χ2 (650, N = 143) = 238.555, p = 1, using a deviance
criterion.
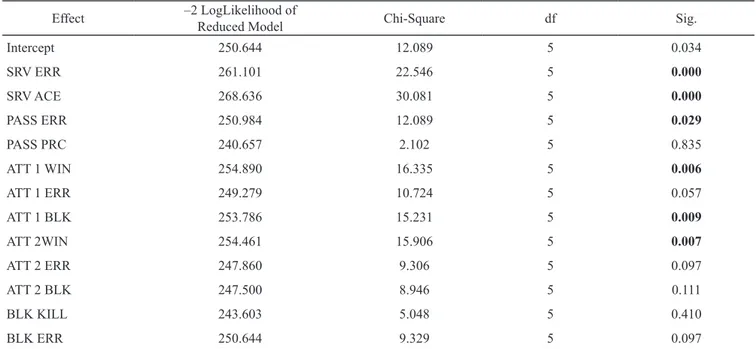
As shown in Table 4, significant unique contributions (in bold) were made by serve errors, serve aces, pass errors, attack 1 win, attack 1 blocked and attack 2 win. Parameters estimates and odds ratios with their 95% confidence limits are in Table 5. Only one predictor
had a significant parameter for comparing group 2 with group 1. If a team were to increase its attack 1 win score by one-unit (1%), the multinomial log odds of being in group 2 rather than in group 1 would be expected to decrease by e–0.945 = 0.389. Alternatively, given by the
reciprocal of 0.389, the odds of being in the superior group would be expected to increase by 2.57 (95% C.I., 1.246-5.311), given the other variables at the model remain the same. The same predictor had a significant parameter for comparing group 3 with group 1. For each one-unit increase in att 1 win, the odds of being in group 1 rather than in the group 3 increased (given by the reciprocal of 0.393) by 2.55 (95% C.I., 1.122-5.782) while holding all the other variables stable.
Four of the predictors had significant parameters for comparing group 1 with group 4. The odds of being in group 1 rather than in group 4 almost tripled (given by
the reciprocal of 0.389) for each one-unit of increase of att 1 win (2.72, 95% C.I., 1.101-6.731) and att 2 win (2.66, 95% C.I., 1.265-5.580). The odds multiplied nearly 13 times for each one-unit increase in serve aces (12.9, 95% C.I., 2.073-80.382) and almost 6 times for each one unit of decrease of the att 1 blocked (5.64, 95% C.I., 1.232-25.841). Five of the predictors had significant parameters for comparing groups 5 and 6 with the reference group 1. About serve errors one unit of decrease almost tripled (2.94, 95% C.I., 1.251-6.911) and quadrupled (4.0, 95% C.I., 1.573-10.360) the odds of being in the superior group for teams 9-10 and 11-12 respectively. For serve aces one unit of increase multiplied approximately 22 times the probability for teams 9-12 to be in group 1 (21.932, 95% C.I., 3.063-157.051 and 21.824, 95% C.I., 2.739-173.866, for group 5 and group 6 respectively). Pass error variable
Table 1. Performance indicators for the groups 1-6. Values are presented as mean ± SD
Performance
Indicator Group 1(n = 24) Group 2(n = 24) Group 3(n = 24) Group 4(n = 24) Group 5(n = 24) Group 6(n = 23) Sig. np2
Serve error 15.62 (±1.90) 15.76 (±2.65) 15.43 (±2.30) 15.29 (±1.99) 15.74 (±2.15) 16.52 (±1.85) 0.468 0.033 Serve ace 6.68 (±1.23)G4,5,6*** 6.38 (±1.45)G5,6*** G4** 6.54 (±1.12) G5,6*** G4** 5.58 (±0.89) G1*** G2,3** 5.44 (±0.75) G1*** G2,3** 5.43 (±0.94) G1*** G2,3** <0.001 0.201 Pass error 6.53 (±1.04)G5,6*** 6.70 (±0.99)G5,6*** 7.01 (±1.11)G5* 6.86 (±1.04)G5**, G6* 7.88 (±1.11)G1,2*** G4**, G3* 7.78 (±1.45) G1,2*** G5**, G4* <0.001 0.180 Pass precise 60.68 (±5.3)G5,6** 58.64 (±5.80) 57.90 (±5.13) 57.95 (±5.68) 55.87 (±5.30)G1** 55.59 (±5.38)G1** 0.019 0.093 Attack 1 win G2,3,4,5,6***56.70 (±2.91) 53.65 (±2.62)G2,4,5,6*** G3* 52.19 (±1.99) G1,4,5*** G2** 50.80 (±2.14) G1,2,6*** 49.44 (±2.44)G1,2,3*** G6* 47.42 (±2.93) G1,2,3,4*** G5* <0.001 0.590 Attack 1 error 7.44 (±1.09)G2*, G3,4,5,6*** 8.13 (±0.82) G1,5* G6*** 8.66 (±1.09) G1*** G6** 8.63 (±1.09) G1,6*** 8.78 (±1.09)G1***, G6* 9.63 (±1.09)G1,2,4*** G3**, G5* <0.001 0.291 Attack 1 block 7.86 (±1.24)G3,4,5,6*** 8.14 (±1.00)G3,4,5,6*** 9.42 (±0.78)G1,2,6*** 10.07 (±1.05)G1,2*** G1,2***, G3*10.16 (±0.99) 10.72 (±1.67)G1,2,3*** <0.001 0.468 Attack 2 win 49.72 (±3.67)G2** G3,4,5,6*** 47.46 (±2.81) G1** G4,5,6*** 46.27 (±2.54) G1,6*** G5** 44.67 (±2.37) G1,2*** G5** 43.67 (±2.62) G1,2*** G3** 42.02 (±3.29) G1,2,3*** G4** <0.001 0.437 Attack 2 error 8.41 (±1.45)G2,4** G3,5,6*** 9.67 (±1.43) G1** 10.13 (±1.32)G3*** 9.70 (±1.52)G1** 10.02 (±1.75)G1*** 10.33 (±1.35)G1*** <0.001 0.158 Attack 2 block 9.08 (±1.31)G3,4,5,6*** 9.15 (±1.40)G3,4,5,6*** 10.66 (±1.33)G1,2*** 10.88 (±1.57)G1,2*** 10.82 (±1.05)G1,2*** 11.32 (±1.60)G1,2*** <0.001 0.292 Block win 25.52 (±5.30) 27.13 (±5.24) 26.77 (±6.11) 25.91 (±5.25) 26.80 (±6.60) 26.00 (±6.75) 0.927 0.010 Block error 34.34 (±9.43) 33.25 (±6.75) 33.75 (±6.07) 32.07(±12.84) 33.37 (±7.30) 36.16 (±5.87) 0.687 0.022 Note: G1-6 = Group 1-6 *** p < 0.001, ** p < 0.005, * p < 0.05
Table 2.
Correlation matrix of selected performance indicators
1 2 3 4 5 6 7 8 9 10 11 12 Tolerance VIF 1 Serve error 1 0.588 1.701 2 Serve ace 0.472 1 0.562 1.780 3 Pass error 0.291 0.091 1 0.673 1.485 4 Pass precise 0.223 0.214 –0.088 1 0.539 1.856 5 Attack 1 error 0.224 –0.151 0.340 –0.093 1 0.197 5.065 6 Attack 1 block 0.080 –0.275 0.409 –0.301 0.371 1 0.502 1.991 7 Attack 1 win 0. 111 0.446 –0.174 0.548 –0.453 –0.645 1 0.376 2.662 8 Attack 2 error 0.185 –0.126 0.158 0.151 0.508 0.284 –0.203 1 0.291 3.439 9 Attack 2 block 0.039 –0.248 0.170 –0.084 0.265 0.532 –0.333 0.238 1 0.566 1.767 10 Attack 2 win 0.173 0.460 –0.028 0.393 –0.271 –0.490 0.644 –0.318 –0.391 1 0.646 1.548 11 Block win –0.188 –0.042 –0.014 –0.059 0.027 0.017 –0.024 0.017 –0.059 0.144 1 0.780 1.282 12 Block error 0.145 0.161 0.131 0.290 0.028 –0.107 0.085 0.009 –0.008 0.041 –0.323 1 0.753 1.328 Table 3.
Model fitting information Model
Model Fitting Criteria
LikelihoodRatioT ests –2 LogLikelihood Chi-Square df Sig. Intercept only 512.408 Final 238.555 273.853 60 0.000 Pearson 519.91 1 650 1.000 Deviance 238.555 650 1.000
Table 4. Predictor’s unique contribution in the multinomial logistic regression
Effect –2 LogLikelihood of Reduced Model Chi-Square df Sig.
Intercept 250.644 12.089 5 0.034 SRV ERR 261.101 22.546 5 0.000 SRV ACE 268.636 30.081 5 0.000 PASS ERR 250.984 12.089 5 0.029 PASS PRC 240.657 2.102 5 0.835 ATT 1 WIN 254.890 16.335 5 0.006 ATT 1 ERR 249.279 10.724 5 0.057 ATT 1 BLK 253.786 15.231 5 0.009 ATT 2WIN 254.461 15.906 5 0.007 ATT 2 ERR 247.860 9.306 5 0.097 ATT 2 BLK 247.500 8.946 5 0.111 BLK KILL 243.603 5.048 5 0.410 BLK ERR 250.644 9.329 5 0.097
Note: The chi-square statistic is the difference in –2 log-likelihoods between the final model and a reduced model. The reduced model is formed by omitting an effect from the final model. The null hypothesis is that all parameters of that effect are 0.
Table 5. Parameters estimate contrasting group 1 versus each other group
Ranking
Group* B χWald2-test Sig.
Exp(B) Odds Ratio
95% Confidence Interval
for Odds Ratio
Reciprocal Exp(B) Odds Ratio
95% Confidence Interval for Odds
Ratio Lower
Bound BoundUpper BoundLower BoundUpper
Group 2 ATT1WIN –0.945 6.526 0.011 0.389 0.188 0.803 2.572 1.246 5.311 Group 3 ATT1WIN –0.935 4.993 0.025 0.393 0.173 0.892 2.547 1.122 5.782 Group 4 SRVACE –2.558 7.514 0.006 0.077 0.012 0.482 12.909 2.073 80.382 ATT1WIN –1.001 4.697 0.030 0.367 0.149 0.909 2.722 1.101 6.731 ATT1BLK 1.730 4.969 0.026 5.643 1.232 25.841 0.177 0.039 0.811 ATT2WIN –0.977 6.660 0.010 0.376 0.179 0.791 2.657 1.265 5.580 Group 5 SRVERR 1.079 6.121 0.013 2.941 1.251 6.911 0.340 0.145 0.799 SRVACE –3.088 9.451 0.002 0.046 0.006 0.327 21.932 3.063 157.051 PASSERR 2.317 6.146 0.013 10.142 1.624 63.320 0.099 0.016 0.616 ATT1WIN –1.189 6.092 0.014 0.305 0.119 0.783 3.282 1.277 8.435 ATT2WIN –1.147 8.379 0.004 0.318 0.146 0.690 3.149 1.448 6.846 Group 6 SRVERR 1.396 8.424 0.004 4.037 1.573 10.360 0.248 0.097 0.636 SRVACE –3.083 8.478 0.004 0.046 0.006 0.365 21.824 2.739 173.866 PASSERR 2.003 4.263 0.039 7.411 1.107 49.608 0.135 0.020 0.903 ATT1WIN –1.663 9.710 0.002 0.190 0.067 0.539 5.277 1.854 15.023 ATT2WIN –1.154 7.585 0.006 0.315 0.139 0.717 3.170 1.395 7.204
is pointed out in the comparison of lower-ranked teams to the superior ones. So, one unit of decrease multiplied the odds of being in group 1, by 7 and 10 times, for groups 9-10 and 11-12 respectively. One unit of increase in attack 1 win for group 5 tripled the odds (3.282, 95% C.I., 1.277-8.435) and multiplied 5 times the odds for group 6 (5.277, 95% C.I., 1.854-15.023) of being in group 1, while one unit of increase in attack 2 win tripled the odds for teams 9-12 of being in group 1 (3.149, 95% C.I., 1.448-6.846 for group 5 and 3.170, 95% C.I., 1.395-7.204 for group 6).
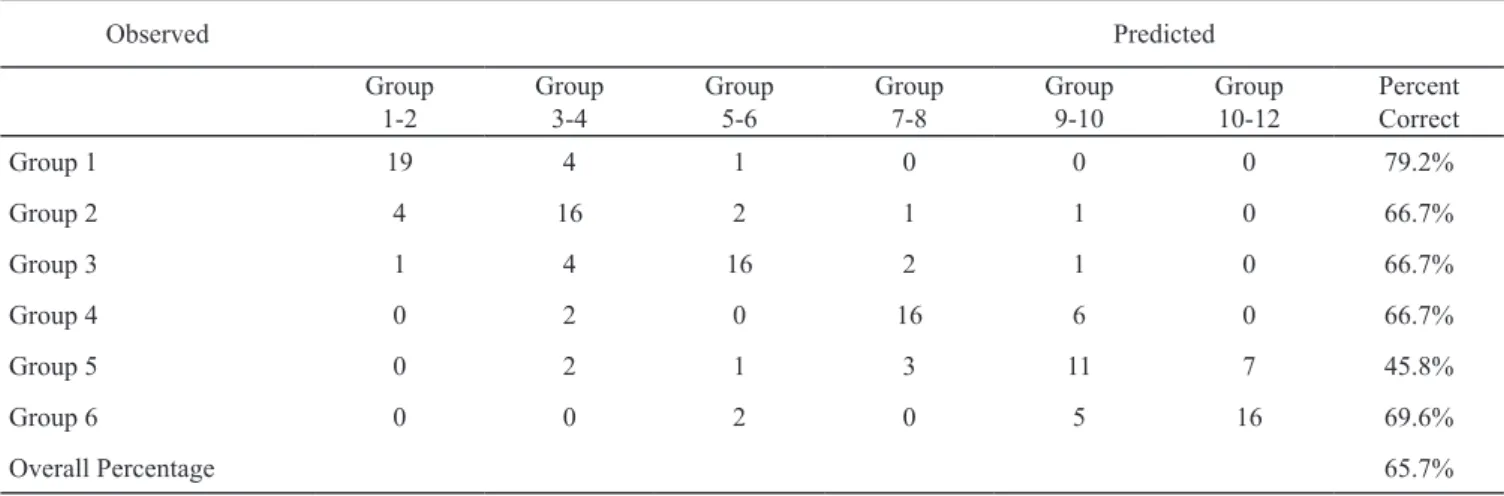
On the basis of the 12 performance indicators, the overall correct classification rate was 65.7%. The success rates were >65% (from 66.7% to 79.2%) for all the groups except group 5, which was moderate (45.8%). All the results are shown in Table 6.
Discussion
The present study aimed to analyse performance indicators in the context of Greek Volleyball male League in a period of twelve championships. More specifically, it attempted to highlight those variables that distinguished the final ranking of the teams. The effectiveness of serve errors, serve aces, serve’s pass errors, attack win 1, 2 and attack 1 blocked were found as volleyball performance factors in this study. The six groups of teams are distinguished on the basis of these predictors. The differentiation between group 1 with the following groups 2 and 3 depends on only one performance indicator: attack 1 win. Also, attack 1 win is the only variable which was demonstrated as a significant predictor for distinguishing all the groups of teams. This finding is consistent with those of Rodriguez-Ruiz et al. [22] and Zetou et al. [29], but in disagreement with those of Peña and Casals [20] who found no evidence of any
of attack categories becoming a critical performance indicator in a study with data from official box scores of four different European male professional volleyball leagues. Contrary to this, in Greek Volleyball league the difference in attack 1 win between teams of group 1 comparing with those of groups 2 and 3 (56.70% vs 53.65% and 52.19%) is the only variable with significant parameter. Characteristically, in order to express odds ratio in terms of probability, the improvement of 1% in this skill increases the probability to be in the superior group by 72%.
Teams ranked in positions 7-8 and marginally compete in the play-off phase with permanent home disadvantage, differ from superior teams ranked in the first two positions of the regular season in serve aces, attack win 1, 2 and attack 1 blocked. The importance of serve skill in volleyball has been shown in several studies [14, 30]. Mean group differences in serve aces were marginal. However, the first three groups had effectiveness >6% and the three lower groups <6%.
Another significant parameter concerning attack 1 is the blocked attacks. The importance of block avoidance in attack is related to a part of the game which usually lacks special preparation: the attack coverage [16]. Attack coverage is a pre-contact defensive action that coincides with the team’s own attack hit during which players of the attacking team manage to volley the blocked ball before it lands in their own court.In high-level men’s volleyball, it accounts approximately 4% of all actions [16]. According to Hileno et al. [13] attack coverage is more effective in counterattack phase (attack after defence). Supplementary to this, coaches have to work more on attack coverage systems aiming to reduce the numbers of blocked attacks landed in their team’s court even in attack after serve’s pass.
Table 6. Classification table
Observed Predicted
Group
1-2 Group 3-4 Group5-6 Group 7-8 Group 9-10 Group10-12 Percent Correct
Group 1 19 4 1 0 0 0 79.2% Group 2 4 16 2 1 1 0 66.7% Group 3 1 4 16 2 1 0 66.7% Group 4 0 2 0 16 6 0 66.7% Group 5 0 2 1 3 11 7 45.8% Group 6 0 0 2 0 5 16 69.6% Overall Percentage 65.7%
A novel finding of the present study is the determination of those skills that with increase in team’s performance the probability to reach an elevated ranked group is higher. The results of the current analysis show that the increase of 1% in serve aces increase 12 times the odds to upgrade team’s level, while the increase of 1% in attack win 1, 2 almost tripled the odds and the reduction of 1% in attack 1 blocked multiply the odds 5 times for a team being in the superior group. Based on the values of such analyses the process of decision making for coaches, in order to exploit training time, would be more effective.
The general trend that the lower-ranked teams performed poorly in all skills comparing to the higher-ranked teams is stable. Teams ranked 9-12 disqualified from the play-off phase and continuing in the play-out phase in order to avoid relegation differ from teams ranked in the positions 1-2 in serve errors, serve aces, passing errors, and in attack 1 and 2 win. It seems that lower group teams differ from the higher ones, not only in attack skills but also in the ability to win a direct point with their serve and to avoid a passing error. This is a finding in agreement with Peña et al. [21] who found a similar result for team categories in Spanish men’s league. The reduction 1% in serve errors for a week team (positions 9-12) has equal raise in odds being in the higher-ranked group of teams as the increase of 1% in attack wins 1 and 2. Taking into account that errors in serve are connected directly not only with players’ abilities but also with the tactical plan of the team, a more conservative tactic in serve skill is a good point for a team to raise its ranking position. Furthermore, the reduction of 1% in passing errors has multiple benefits in terms of odds than the raising of 1% in attack win. The weaker teams of a league in order to improve their ranking is preferable to invest training time on the reduction of unforced errors in serve and avoidance of direct errors in serve’s pass than to take into account the importance of attack which is affected by technical, anthropometric, physical and financial parameters (in terms of the budget and the quality of the players).
Contrary to coaches’ belief and the results of several studies [17, 29] serve’s pass, as expressed by the pass precise variable, did not prove to be a predictor for the categorization of teams in ordinal groups. Also, it is important to highlight the moderate correlation between precise pass and attack 1 win in this amount of data. The impact of serve’s pass was rather small as indicated by the lack of significance of the likelihood ratio test to the overall contribution of the model. Apparently it may not be enough for a team to receive well in order to
be successful, as the skills which largely determine the result of a match are mostly attack related.
Regarding the accuracy of the logistic model functions, a tendency is revealed for the percentage of correct classification of cases which is higher for the teams 1-2 (79.2%), teams 3-4, 5-6, 7-8 (66.7%) and teams 11-12 (69.6%) than for teams 9-10 (45.8%). The model did a particularly good job of predicting most of the groups, with correct classification rates >65%, except the group of teams ranked in 9-10 position of the league.
Conclusions
Overall, using twelve primary variables from all the teams of 12 championships in a row from the Greek men’s Volley League the important performance indicators for classification of teams according to their ranking in the superior group of teams ranked 1-2, and in groups of teams ranked 3-4, 5-6, 7-8, 9-10, and finally for the relegation group 11-12 was specified and quantified. The model can correctly classify 65.7% of the original cases of the 6 groups and evaluate the statistically significant predictors that change the odds of the outcome as the most important. Attack 1 win was a predictor that significantly discriminates between reference group 1 and all the other groups of teams. From an applied point of view, the results can be utilized as references for the process of selecting and developing players or for the system to play and for the establishment of goals for practice and competition.
References
1. Altman DG, Ludbrook J, Altman DG. Practical statistics for medical research. London: Chapman & Hall; 1991. DOI: 10.1111/j.1445-2197.1991.tb00019.x.
2. Bergeles N, Barzouka K, Nikolaidou ME. Performance of male and female setters and attackers on Olympic-level volleyball teams. Int J Perform Anal Sport. 2009; 9(1): 141-148. DOI: 10.1080/24748668.2009.11868470. 3. Castro J, Souza A, Mesquita I. Attack efficacy in volleyball:
elite male teams. Percept Mot Skills. 2011; 113(2): 395- -408. DOI: 10.2466/05.25.PMS.113.5.395-408.
4. Ciemiński K. The efficiency of executing technical actions in volleyball and the teams’ gender and sports level. Trends Sport Sci. 2018; 25(3): 159-165. DOI: 10.23829/TSS.2018.25.3-6.
5. Cohen J. Statistical power analysis for the behavioral sciences. 2nd ed. Hilsdale, NJ: Lawrence Erlbaum Associates; 1988.
6. Costa GDCT, Afonso J, Barbosa RV, Coutinho P, Mesquita IR. Predictors of attack efficacy and attack type
in high-level Brazilian women’s volleyball. Kinesiology. 2014; 46(2): 242-248.
7. Drikos S. Pass level and the outcome of attack for age categories in male volleyball. J Phys Act Nutr Rehabil. 2018: 428-438.
8. Drikos S, Kountouris P, Laios A, Laios Y. Correlates of team performance in volleyball. Int J Perform Anal Sport. 2009; 9(2): 149-156. DOI: 10.1080/24748668.2009.11868472. 9. Drikos S, Ntzoufras I, Apostolidis N. Bayesian analysis of
skills importance in World Champions Men’s Volleyball across ages. Int J Comput Sci Sport. 2019; 18(1): 24-44. DOI: 10.2478/ijcss-2019-0002.
10. Drikos S, Vagenas G. Multivariate assessment of selected performance indicators in relation to the type and result of a typical set in men’s elite volleyball. Int J Perform Anal Sport. 2011; 11(1): 85-95. DOI: 10.1080/24748668.2011.11868531.
11. Eom HJ, Schutz NR. Statistical analysis of volleyball team performance. Res Q Exerc Sport. 1992; 63(1): 11-18. 12. Florence LW, Vehrs PR, Fellingham GW, Nina P. Skill
evaluation in women’s volleyball. J Quant Anal Sport. 2008; 4(2).
13. Hileno R, García-De-Alcaraz A, Buscà B, Salas C, Camerino O. What are the most widely used and effective attack coverage systems in men’s volleyball? J Hum Kinet. 2018; (62): 111-121. DOI: 10.1515/ hukin-2017-0163.
14. Kountouris P, Drikos S, Aggelonidis I, Laios A, Kyprianou M. Evidence for differences in men’s and women’s volleyball games based on skills effectiveness in four consecutive olympic tournaments. Compr Psychol. 2015; 4: 30.50. CP.4.9. DOI: 10.2466/30.50.CP.4.9.
15. Laios Y, Kountouris P. Evolution in men’s volleyball skills and tactics as evidenced in the Athens 2004 Olympic Games Laios. Int J Perform Anal Sport. 2004: 1-8.
16. Laporta L, Nikolaidis P, Thomas L, Afonso J. Attack coverage in high-level men’s volleyball: organization on the edge of chaos? J Hum Kinet. 2015; 47(1). DOI: 10.1515/hukin-2015-0080.
17. Marelić N, Rešetar T, Janković V. Discriminant analysis of the sets won and the sets lost by one team in A1 Italian volleyball league – a case study. Kinesiology. 2004; 36(1): 75-82.
18. Palao JM, Santos JA, Ureña A. Effect of team level on skill performance in volleyball. Int J Perform Anal Sport. 2004; 4(2): 50-60. DOI: 10.1080/24748668.2004.11868304.
19. Patsiaouras A, Kokaridas D. Technical skills predictive of winning at CEV Volleyball Men’s Champions League: identification and importance. Trends Sport Sci. 2019; 26(2): 71-76. DOI: 10.23829/TSS.2019.26.2-5.
20. Peña J, Casals M. Game-related performance factors in four European men’s professional volleyball championships. J Hum Kinet. 2016; 53(1): 223-230. DOI: 10.1515/ hukin-2016-0025.
21. Peña J, Rodriguez-Guerra J, Busca B, Serra N. Which skill and factors better predict winning and losing in high-level men’s volleyball? J Strength Cond Res. 2013; 27(9): 487-493.
22. Rodriguez-Ruiz D, Quiroga ME, Miralles JA, Sarmiento S, de Saá Y, García-Manso JM. Study of the technical and tactical variables determining set win or loss in top-level European men’s volleyball. J Quant Anal Sport. 2011; 7(1). DOI: 10.2202/1559-0410.1281.
23. Silva M, Lacerda D, Vicente João P. Match analysis in volleyball: a systematic review. Montenegrin J Sport Sci Med. 2016; 5(1): 31-46.
24. Stamm R, Stamm M, Torilo D, Thomson K, Jairus A. Comparative analysis of the elements ofattack and defence in men’s and women’s games in the Estonian volleyball highest league. Pap Anthropol. 2016; 25(1): 37-54.
25. Stevens JP. Applied multivariate statistics for the social sciences. Hillsdale, NJ: Erlbaum; 2002.
26. Stutzig N, Zimmermann B, Büsch D, Siebert T. Analysis of game variables to predict scoring and performance levels in elite men’s volleyball. Int J Perform Anal Sport. 2015; 15(3): 816-829. DOI: 10.1080/24748668.2015.11868833. 27. Tabachnick BG, Fidell LS. Using multivariate statistics.
5th ed. Pearson, Allyn and Bacon; 2007.
28. Tsivika M, Papadopoulou S. Evaluation of the technical and tactical offensive elements of the Men’s European Volleyball Championship. Phys Train. 2008; (7): 1-16. 29. Zetou E, Moustakidis A, Tsigilis N, Komninakidou A.
Does effectiveness of skill in complex I predict win in men’s Olympic Volleyball games? J Quant Anal Sport. 2007; 3(4). DOI: 10.2202/1559-0410.1076.
30. Zetou E, Tsigilis N, Moustakidis A, Komninakidou A. Playing characteristics of men’s Olympic Volleyball teams in complex II. Int J Perform Anal Sport. 2006; 6(1): 172-177.