TRENDS
in
Sport Sciences
2016; 2(23): 73-79 ISSN 2299-9590What is already known on this topic?
Changes in blood lactate and ammonia as a response to exercise in athletes have been analyzed in different studies. There is limited data available on these biomarkers measured during real workout in highly-trained sprinters. An evaluation of kinematic characteristics using the Catapult OptimEye S5 system was performed in team sports athletes, in particular, but not yet in sprinters.
Received: 12 March 2016 Accepted: 22 June 2016
Corresponding author: adam.kantanista@gmail.com
Poznan University of Physical Education, Poznań, Poland
ADAM KANTANISTA, KRZYSZTOF KUSY, KAROLINA DOPIERAŁA, JACEK TRINSCHEK, HUBERT KRÓL, MICHAŁ WŁODARCZYK, JACEK ZIELIŃSKI
Blood lactate, ammonia and kinematic indices during
a speed-endurance training session in elite sprinters
Abstract
Introduction. The analysis of both athletic performance and individual response to exercise helps control the training process. In order to fulfill these needs, various blood biomarkers, along with physiological and biomechanical parameters are tested using modern technology. Aim of Study. The aim of this study was to evaluate athletes’ response to the performed speed-endurance training session during the pre-competition phase.
Material and Methods. The study sample comprised male sprinters competing in the 100 m, 200 and 4 × 100 m events at the national and international level. During training, blood samples were taken, which were analyzed regarding ammonia and lactate concentrations. Kinematic parameters were analyzed using the Catapult OptimEye S5 system. Results. In all athletes, maximum blood ammonia (176-181 µmol/l) and lactate concentrations (18.0-20.3 mmol/l) were observed three minutes after the last run during the main part of the training session. At the 30th minute of cool down, blood ammonia concentration was similar to the level before warm up, and lactate concentration was still increased. During the main part of the session, sprinters achieved maximum velocity 10.3-10.4 m/s. Conclusions. In highly-trained sprinters, a speed endurance training session causes a strong and prolonged exercise response, manifested by extremely high blood ammonia and lactate concentration as well as maximal heart rate. Kinematic indices help to individually optimize athletes’ exercise loads.
KEYWORDS: sprinters, blood ammonia, lactate, speed endurance, monitoring training session.
Introduction
A
n important factor which helps athletes achieve higher results in sports is control over the trainingprocess. Conscious and planned implementation of
training loads, appropriate training methods as well as recovery time allows athletes to peak at the most important competitions [1].
There are three main phases in a sprinter’s annual training plan: preparatory, competition and transition [2, 3]. The realization of certain tasks depends on the competitions in which the athlete will participate in. In each phase, the training is focused on specific aspects to prepare the athlete for competition. In the first phase, the most important aspect is anatomical adaptation (body composition), tempo training, and maximum strength training; in the second phase - power, maximum speed, and speed maintenance. In the last phase, the focus is on active rest and recovery along with gradual preparation
for the preparatory phase once again [3, 4, 5]. According
to Winckler [6], most coaches understand the quality of speed endurance to be the athlete’s ability to maintain
high speed over extended sprint distances. Thus, a 100 m sprinter must work at an intensity of 95-l00% of his
maximum velocity over distances of 60-150 m [7]. A
classic method for developing speed endurance is the so-called “anaerobic lactic training”, resulting in high blood lactate concentration. In practice, coaches plan interval training sessions, consisting of maximal- or submaximal-intensity sprints, separated by relatively short recovery periods to stimulate anaerobic energy sources.
Before the main competition, coaches and athletes use a tapering phase. A taper can be defined as a period of reduced training volume in order to optimize competition performance [8]. The aim of the pre-competition preparation is to bring athletes to their highest potential, in similar conditions to those that will take place during the main competition. There are many studies verifying the efficacy of a taper, especially in swimming, running and triathlon [9]. A very important part during a tapering period is the appropriate decrease in training load, realized by adjusting the training volume, intensity, and frequency [10]. It is also important to enhance recovery during this period. Stress and fatigue induced by training must be rapidly minimized. Recovery is an integral component in optimizing performance [1]. The analysis of both athletic performance and individual response to exercise helps to control the training process.
In order to fulfill these needs, various blood biomarkers are tested along with physiological and biomechanical
indices, using modern technology. Monitoring the
levels of blood biomarkers fulfills an informative function necessary to control the training process and to assess the impact of exercise on the body [11]. Taking into account the level of a biomarker, it is possible to estimate training status, muscle damage, hydration status, oxidative fatigue, and overtraining. The analysis of biomarker concentration and its application in training planning helps to optimally increase performance in elite sprinters. The most commonly evaluated biomarkers used in sports training are lactate and ammonia in blood [12]. Accumulation of lactic acid and ammonia is the factor limiting work efficiency during moderate and
high-intensity exercise [13].
Blood lactate increases when phosphate sources, derived
mainly from phosphocreatine, are reduced. Lactic acidosis will progress when lactate production exceeds its clearance [14]. Lactate concentration in blood offers valuable information not only about glycolytic changes, but also the ability of athletes to work anaerobically [11]. Lactate is used to assess the anaerobic potential of
athletes and serves to determine exercise intensity and
time needed for post-exercise recovery [15].
Blood ammonia accumulation in athletes is dependent on the type and intensity of exercise [16]. During high-intensity exercise, the main source of ammonia production in blood is adenosine monophosphate deamination [17, 18]. Blood ammonia concentration can indirectly indicate the adenosine triphosphate content in muscles [18]. It also affects the central nervous system and muscle function [17, 19]. This is why the analysis of ammonia concentration in sports training provides additional support in appropriate planning of training loads.
Technological advances and the development of complex monitoring systems for athletes allow recording a great deal of kinematic, physiological and biomechanical data during exercise, as well as between training sessions. Monitoring fatigue and exercise capacity
is desired to achieve better performance. It helps to optimize the training process and minimize unplanned
fatigue [20]. The most advanced technological systems
used to monitor sports training in athletes can measure such characteristics as athlete’s position, velocity and acceleration, heart rate (HR), and time spent in certain exercise intensity bands. For a coach, being able to visually follow each characteristic which illustrates an athlete’s response to exercise in real time makes it possible to immediately adjust training loads accordingly.
First complex systems used for monitoring athletic activity started being used mainly in team sports. In field
hockey [21], soccer [22], basketball [23], Australian rules football [24], and rugby [25] movement patterns, distance travelled, HR, acceleration, deceleration and the so-called Player Load were measured. GPS-based systems, however, have not been used yet to monitor and analyze sprinter training.
The aim of this study was to evaluate the response of highly-trained sprinters to a speed-endurance training session during the pre-competition phase, using the measurements of levels of blood ammonia, lactate and heart rate. Additionally, characteristics of speed endurance training, distance, time, velocity, and player load were evaluated.
Method
Participants
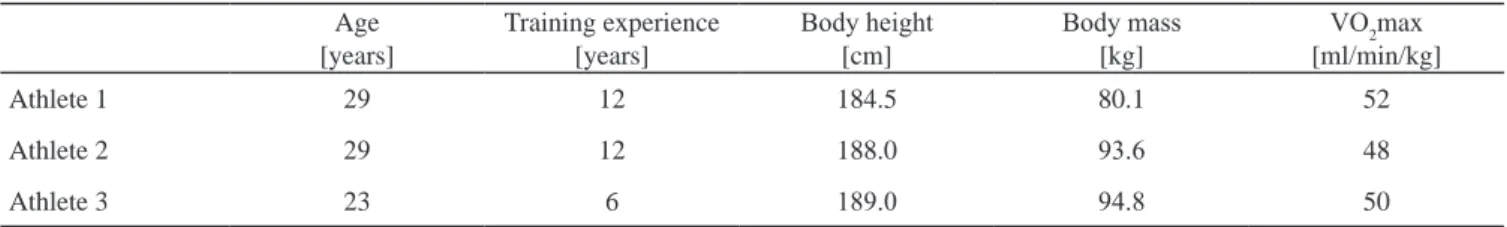
The study participants were three male sprinters competing in 100 m, 200 m and 4 × 100 m, at the national and international level, aged 23-29 years, with their competitive sport training experience of 6 to 12 years, body weight of 80.1-94.8 kg, body height of 184.5-189.0 cm,
and maximal oxygen uptake (VO2max) of 50-52 ml/ /kg/min. The basic characteristics of each athlete are presented in Table 1. The participants were informed of the procedures and gave their written consent to participate in the study. The study was approved by the Local Bioethical Committee at the Poznan University of Medical Sciences.
Speed-endurance training session
The study was carried out during a training camp in
May in wind-free conditions and at the air temperature of 24ºC. The measurements were performed on a standard 400-m running track. The aim of the session, designed by a coach, was to develop speed endurance. The workout schedule was the same for each athlete and
consisted of the the warm up, main part (four sprints:
120 m, 150 m, 120 m, 150 m), and cool down sections.
Blood ammonia and lactate measurement
During the training session, blood samples were taken from the athletes, to be analyzed for ammonia and lactate concentrations. Blood was taken before and after the warm-up, three minutes after each sprint performed in the main section, and on the 20th and 30th min of the cool-down.
To determine the concentration of blood ammonia, 20 µl of whole blood was applied on a test strip and analyzed with PocketChem BA (Arkray, Japan). To
measure blood lactate accumulation, Biosen C-line
(EKF Diagnostics, Germany) was used. In brief, 20 µl
of whole blood was filled into the prefilled micro test tube using a capillary. L-lactate contained in the sample was converted enzymatically to pyruvate and hydrogen peroxide, which was detected by the electrode.
Kinematic evaluation
The evaluation of kinematic characteristics and HR was performed using the Catapult OptimEye S5 system (Catapult Sports, Melbourne, Australia). HR was measured with the use of POLAR monitors, Bluetooth and ANT. OptimEye S5 sensors were equipped with 10 Hz GPS, an integrated 100 Hz 3-axis accelerometer, a 100 Hz 3-axis gyroscope, and a 100 Hz 3-axis
magnetometer. During the session, total duration and distance covered, maximum and mean HR, and maximum velocity (Vmax) were measured. The so-called Total Player Load was also calculated. The Player Load is a resultant vector magnitude derived from tri-axial accelerometer data. It is expressed as the square root of the sum of the squared instantaneous rates of change in acceleration in each of the three vectors (X, Y and Z axis) and divided by 100 [24]. The calculation utilized a scaling factor of “100” to make the output data more applicable to use. It is reported in arbitrary units (au) using the formula:
Note: ay – antero-posterior acceleration; ax – medio-lateral acceleration; az – vertical acceleration
Results
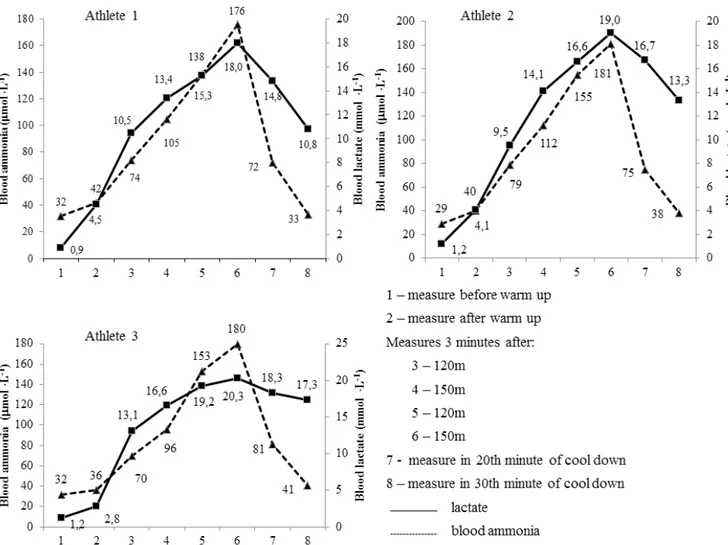
Figure 1 shows blood lactate and ammonia levels that were measured in the three athletes before, during, and after the training session. In the first athlete, before the warm-up, the ammonia concentration was 32 µmol/l, and then increased up to 138 and 176 µmol/l after the 3rd
and 4th sprint, respectively. After 30 minutes of the
cool-down, the blood ammonia concentration decreased to 33 µmol/l. Blood lactate concentration was 0.9 mmol/l before the warm-up and attained 18.0 mmol/l 3 minutes after the 150 m run (4th repetition). 30 minutes after the
main section, the lactate concentration decreased to 10.8 mmol/l.
In the second athlete, before the warm-up, the blood ammonia concentration was 29 µmol/l. An increase in blood ammonia concentration was noted in the consecutive measurements. The maximal level of blood ammonia was observed after the 4th sprint (150 m),
and it amounted to 181 µmol/l. The blood ammonia concentration decreased to 81 µmol/l after 20 minutes, and after 30 minutes of the cool down it decreased 41 µmol/l. The blood lactate concentration before the warm-up was 1.21 mmol/l and increased to 4.1 mmol/l after the warm-up. The maximal level (19.0 mmol/l)
2 1 1 1 1 1 ( ) = 100 2 2 x y y - x - + z z - a - a ) + (a - a ) (a - a Player Load
Table 1. Basic characteristics of studied athletes
Age [years] Training experience [years] Body height [cm] Body mass [kg] VO2max [ml/min/kg] Athlete 1 29 12 184.5 80.1 52 Athlete 2 29 12 188.0 93.6 48 Athlete 3 23 6 189.0 94.8 50
was attained after the last sprint. Thirty minutes after the main section of the training session, the blood lactate concentration decreased to 13.3 mmol/l.
In the third athlete, before the warm-up, the blood ammonia concentration was 32 µmol/l. After the 3rd
sprint, it increased to 153 µmol/l, and after the last run to 180 µmol/l. The blood ammonia level decreased to 81 and 41 µmol/l after 20 and 30 minutes of the cool down, respectively. Before the warm-up, the blood lactate concentration was 1.2 mmol/l, and after the warm-up it increased to 2.8 mmol/l. The maximal concentration of 20.3 mmol/l was reached 3 minutes after the 150-m sprint (4th repetition). 30 minutes after the main part of
the training session, it decreased to 17.3 mmol/l. Table 2 shows the characteristics recorded using the Catapult System with OptimEye S5 sensors. During the 2-hour training session, the first runner travelled a distance of 5700 m, with the Player Load of 507 au, maximal heart rate (HRmax) of 204 bpm, and Vmax of
10.4 m/s. In the main section of the training session, the HRmax and Vmax in consecutive sprints were 194 bpm and 10.0 m/s (120 m), 198 bpm and 10.2 m/s (150 m), 199 bpm and 10.4 m/s (120 m), and 204 bpm, and 10.0 m/s (150 m), respectively.
The second runner covered almost 5000 m during the 2-hour training session, with the Player Load of 377 au, HRmax was 204 bpm, and Vmax was 10.4 m/s. In the main section of the training session, the HRmax and Vmax in consecutive sprints amounted to 202 bpm and 9.7 m/s (120 m), 204 bpm and 9.8 m/s (150 m), 178 bpm and 10.4 m/s (120 m), and 178 bpm, and 10.0 m/s (150 m), respectively.
The third runner travelled almost 5300 m during the 2-hour training session. In the main section of the training session, his HRmax and Vmax in consecutive sprints were: 180 bpm and 10.3 m/s (120 m), 181 bpm and 10.2 m/s (150 m), 167 bpm and 10.2 m/s (120 m), and 177 bpm and 10.0 m/s (150 m), respectively.
Discussion
The aim of this study was to evaluate sprinters’ response to training loads during a speed-endurance training session. Despite individual differences the studied athletes displayed a similar and consistent time course
in their blood ammonia and lactate concentrations, HR, and kinematic indices in sprinters. The speed endurance training session caused a strong and prolonged exercise response, manifested by extremely high post-exercise blood ammonia and lactate concentrations as well as maximal heart rate.
During high-intensity exercise, energy is mainly obtained from anaerobic sources. The main source of ammonia is the deamination of adenosine monophosphate to inosine monophosphate through the purine nucleotide cycle [11, 26]. An increase in ammonia concentration occurs predominantly after high-intensity exercise, where ammonia aids in stimulating glycolysis [27]. In the athletes under study, the highest concentration of blood ammonia was observed after the last sprint repetition. The blood ammonia level was slightly higher 30 minutes after the main training part than before the warm-up.
Blood lactate concentration in all the athletes gradually increased during the session, reaching the maximum after the main part of the training session. In two athletes (1 and 2), 30 minutes after training the lactate concentration decreased by 30-40%. However, in the third athlete it was only 15% lower than the maximal
concentration. High levels of blood lactate during training session are typical for elite athletes, who tolerate high amounts of lactate during maximal exercise [28]. In the studied athletes, the maximal concentration of lactate produced was 18-20 mmol/l. In another study, a sprinter attained a slightly lower concentration of lactate after completing a training plan consisting of 60 m + 60 m + 100 m + 120 m runs (with recovery breaks of 5, 8, 8 min, respectively). After completing the runs, the athlete’s lactate level was 16.2 mmol/l [29]. The lower lactate levels in that study were most likely due to shorter distances run in the training session compared to longer distances covered in the analyzed training session. Since both training sessions were performed at maximal or near-maximal intensity, and the time needed to perform each repetition was higher for the 120 m/150 m distances, more lactate was produced through anaerobic glycolysis.
An increase in blood ammonia and lactate concentrations during a training session in sprinters is a typical response to the training load [30]. In the present study, blood ammonia and lactate concentrations increased considerably in all the athletes through all the performed repetitions. A similar observation was made by Kantanista et al. [31], who examined sprinters and triathletes during an incremental exercise test, even though they were tested in laboratory conditions and not during a real track session. This shows that both biomarkers are effective as training load indicators in highly-trained sprinters. With increasing
Table 2. Characteristics recorded by the Catapult System using OptimEye S5 during the speed-endurance training session
Session part Total duration[min:s] Total distance[m] [beat/min]HRmax [beat/min]HRmean Vmax[m/s] Total player load[au]
Athlete 1 Warm-up 47:49 3361 178 132 8.2 307 Main part 47:07 2030 204 142 10.4 164 Cool down 33:02 312 149 133 1.6 36 Total 127:58 5703 204 135.7 10.4 507 Athlete 2 Warm-up 47:50 2928 183 109 8.6 236 Main part 38:54 1639 204 124 10.4 117 Cool down 34:22 220 190 117 2.0 24 Total 121:06 4787 204 116.7 10.4 377 Athlete 3 Warm-up 47:49 2857 147 112 8.6 257 Main part 45:36 2090 188 134 10.3 155 Cool down 32:21 342 141 126 1.7 21 Total 125:46 5289 181 124 10.3 433
fatigue, the levels of both biomarkers increase, reflecting the physiological status of the athlete. This information can then be used by coaches to plan or adjust training sessions according to the athlete’s status; more fatigued athletes may need more recovery and reduced training load. The Catapult OptimEye S5 system provided some additional characteristics, which produced information about the training session and its effects. The gathered data, i.e. total duration, total distance, HRmax, mean HR, Vmax, and Total Player Load, made it possible to optimize the performed training session. The system recorded characteristics at distances longer than 20-40 m in a straight line [32], so in this case the presented
results can be considered reliable. HRmax in two
athletes was 204 bpm, and in the third athlete it was 181 bpm, i.e. higher than during a standard incremental laboratory test. Kusy et al. [30] carried out a preliminary study on one highly-trained sprinter during a speed-endurance workout and the HRmax achieved was lower (174 bpm) after the last repetition (120 m) than that in laboratory conditions (194 bpm). This discrepancy may be connected with shorter distances analyzed by Kusy et al. During the main part of the training session, the athletes achieved Vmax of 10.3-10.4 m/s. Maćkała
and Antti [33] compared the best performances in the 100 m during the World Championship final in Berlin 2009, and the two highest Vmax were 12.26 m/s and 11.80 m/s. It is typical of speed-endurance training sessions that athletes must work at their near-maximal speed, and their goal is to maintain that speed as long as possible and to minimize the decrease in speed. In the investigated session, the so-called Player Load was recorded, which gives additional information on the training load an athlete goes through in certain phases of the training session. The Player Load helps to modify the training load on the spot as well to plan/modify training periodization in a longer perspective (annual training cycle). Certain indices can help characterize an athlete’s response to a given exercise bout and, when bouts are repeated throughout an annual plan or training phase, they can be analyzed and compared to other sessions. Our study has certain strengths. The research was carried out in the pre-competition phase on highly-trained athletes. Additionally, the training load was registered by the reliable Catapult OptimEye S5. Unfortunately, it was not possible to compare our results with other reports, because it is, to the best of our knowledge, the first study which used this measuring system on sprinters. In the future, performing this type of research in all phases of an annual training cycle on larger groups of athletes would yield a more comprehensive image of
the effects of speed endurance workout on biochemical and kinematic exercise response in highly-trained sprinters.
Conclusions
The obtained data show that a speed endurance training session causes a strong and prolonged exercise response in highly trained sprinters, manifested by extremely high blood ammonia and lactate concentration as well as maximal heart rate. Kinematic indices help to individually optimize the athletes’ exercise loads.
Acknowledgements
This work was funded by the Polish Ministry of Science and Higher Education from financial resources within the “Development of Academic Sports” programme (grant number RSA3 03653).
References
1. Le Meur Y, Hausswirth C, Mujika I. Tapering for competition: A review. Sci Sports. 2012; 27: 77-87. 2. Kurz T. Periodization made really simple. Stadion News.
Training Info for Serious Athletes. 2005; 12: 1-3. 3. Warden P. Planning training for the sprints and hurdles.
Track Coach. 1988; 105: 3351-3354.
4. Bompa T. A model of an annual training programme for a sprinter. New Stud Athlet. 1991; 6: 47-51.
5. Hoffman JR. Periodized training for the strength/power athlete. NSCA’s Perform Training J. 2002; 1: 8-12. 6. Winckler G. An examination of speed endurance. New
Stud Athlet. 1991; 6: 27-33.
7. Bailey J, Ward B, McLennan A. Sprints and relays instructional manual for coaches. Athletics New Zealand, 2005.
8. Mujika I, Padilla S. Scientific bases for precompetition tapering strategies. Med Sci Sports Exerc. 2003; 35: 1182-1187.
9. Murach K, Greever C, Luden ND. Skeletal muscle architectural adaptations to marathon run training. Appl Physiol Nutr Metab. 2015; 40: 99-102.
What this study adds?
It is the first study to present blood ammonia and lactate levels as a response to exercise during a real speed-endurance workout in highly-trained sprinters. Additionally, the Catapult OptimEye S5 system was shown to be a useful tool to obtain additional characteristics. It allows monitoring training sessions and enables coaches to implement modifications in “live” conditions.
10. Brännström A, Rova A, Yu J-G. Effects and mechanisms of tapering in maximizing muscular power. Int J Hum Mov Sports Sci. 2013; 1: 18-23.
11. Itoh H, Ohkuwa T, Yamazaki Y, Miyamura M. Human blood lactate and ammonia levels after supramaximal uphill and downhill running. Nagoya J Med Sci. 1996; 59: 135-142.
12. Gorostaiaga EM, Asiáin X, Izquierdo M, et al. Vertical jump performance and blood ammonia and lactate levels during typical training sessions in elite 400-m runners. J Strength Cond Res. 2010; 24: 1138-1149.
13. Demura S, Yamada T, Yamaji S, et al. The effect of L-ornithine ingestion on performance during incremental exhaustive ergometer bicycle exercise and ammonia during and after exercise. Eur J Clin Nutr. 2010; 1166- -1171.
14. Finsterer J. Biomarkers of peripheral muscle fatigue during exercise. BMC Musculoskelet Disord. 2012; 13: 218.
15. Palacios G, Pedrero-Chamizo R, Palacios N, et al. Biomarkers of physical activity and exercise. Nutr Hosp. 2015; 31(Supl. 3): 237-244.
16. Terjung RL, Tullson PC. Ammonia metabolism during exercise. In: Lamb DR and Gisolfi CV, eds., Energy metabolism in exercise and sport. Dubuque, IA: Brown & Benchmark; 1992. pp. 235-268.
17. Wilkinson DJ, Smeeton NJ, Watt PW. Ammonia metabolism, the brain and fatigue; revisiting the link. Prog Neurobiol. 2010; 91: 200-219.
18. Gorostiaga EM, Navarro-Amézquet I, Calbet JA, et al. Blood ammonia and lactate as markers of muscle metabolites during leg press exercise. J Strength Cond Res. 2014; 28(10): 2775-2785.
19. Mutch BJ, Banister EW. Ammonia metabolism in exercise and fatigue: a review. Med Sci Sports Exerc. 1983; 15: 41-50.
20. Halson SL, Jeukendrup AE. Does overtraining exist? An analysis of overreaching and overtraining research. Sports Med. 2004; 34: 967-981.
21. White AD, MacFarlane N. Time-on-pitch or full-game GPS analysis procedures for elite field hockey? Int J Sports Physiol Perform. 2013; 8, 549-555.
22. Akenhead R, Hayes PR, Thompson KG, French D. Diminutions of acceleration and deceleration output
during professional football match play. J Sci Med Sport. 2013; 16: 556-561.
23. Montgomery PG, Pyne DB, Minahan CL. The physical and physiological demands of basketball training and competition. Int J Sports Physiol Perform. 2010; 5: 75-86. 24. Boyd LJ, Ball K, Aughey RJ. The reliability of MinimaxX
accelerometers for measuring physical activity in Australian football. Int J Sports Physiol Perform. 2011; 6: 311-321.
25. Jones MR, West DJ, Crewther BT, et al. Quantifying positional and temporal movement patterns in professional rugby union using global positioning system. Eur J Sport Sci. 2015; 15: 488-496.
26. Wheeler TJ, Lowenstein JM. Creatine phosphate inhibition of adenylate deaminase is mainly due to pyrophosphate. J Biol Chem. 1997; 10: 1484-1486.
27. Meyer RA, Terjung RL. AMP deamination and IMP reamination in working skeletal muscle. Am J Physiol. 1980; 239: 32-38.
28. Hirvonen J, Rehunen S, Rusko H, Härkönen M. Break down on the high-energy phosphate compounds and lactate accumulation during short supramaximal exercise. Eur J Appl Physiol. 1987; 56: 253-259.
29. Kusy K, Zarębska E, Ciekot-Sołtysiak M, et al. Cardiorespiratory response and energy system contribution during speed endurance workout in a highly trained sprinter: a preliminary report. Antropomotoryka. J Kinesiol Exerc Sci. 2015; 25: 27-36.
30. Urhausen A, Kindermann W. Blood ammonia and lactate concentrations during endurance exercise of differing intensities. Eur J Appl Physiol. 1992; 65: 209-214. 31. Kanntanista A, Kusy K, Zarębska E, et al. Blood
ammonia and lactate responses to incremental exercise in highly-trained male sprinters and triathletes. Biomed Hum Kinetics. 2016; 8: 32-38.
32. Jennings D, Carmack ST, Coutts AJ, et al. The validity and reliability of GPS units for measuring distance in team sport specific running patterns. Int J Sports Physiol Perform. 2010; 5: 328-341.
33. Maćkała K, Antti M. A kinematics analysis of three best 100 m performances ever. J Hum Kinet. 2013; 36: 149-160.