Poznan University of Physical Education
TRENDS
in
SPORT SCIENCES
(formerly Studies in Physical Culture and Tourism)
Chairman of the publishing board
Jan Celichowski (Poznań, Poland)
Editor-in-chief
Piotr Gronek (Poznań, Poland)
Vice editor-in-chief
Barbara Pospieszna (Poznań, Poland)
Topic Editors
Tomasz Banasiewicz (Poznań, Poland) Jacek Lewandowski (Poznań, Poland)
Miroslava Pridalova (Olomouc, Czech Republic) Jacek Zieliński (Poznań, Poland)
Statistical Editor
Magdalena Lewandowska (Poznań, Poland)
Native Language Editor
Cain C.T. Clark (Coventry, Great Britain)
Editorial board address
Poznan University of Physical Education ul. Królowej Jadwigi 27/39
61-871 Poznań, Poland
tel. +48 61 835 51 96; +48 61 835 50 68
ISSN 2299-9590 Publisher
Poznan University of Physical Education ul. Królowej Jadwigi 27/39
61-871 Poznań, Poland tel. +48 61 835 51 96 e-mail: gronek@awf.poznan.pl e-mail: tss@awf.poznan.pl www.tss.awf.poznan.pl Printed by
ESUS Tomasz Przybylak ul. Południowa 54 62-064 Plewiska, Poland
Editorial board
A. Abreu (Lisbon, Portugal), I. Ahmetov (St. Petersburg, Russian Federation), A. Barinow-Wojewódzki (Poznań, Poland), X. Bigard (Grenoble, France), J. Blecharz (Kraków, Poland), M. Bronikowski (Poznań, Poland), A. Cicchella (Bologna, Italy), P. Cięszczyk (Szczecin, Poland), M. Collins (Cape Town, South Africa), J.M. Cummiskey (Dublin, Ireland), R. Duarte (Lisbon, Portugal), A.C. Hackney (Chapel Hill, USA), A. Hökelmann (Magdeburg, Germany), B. Jošt (Ljubljana, Slovenia), J. Juříková (Brno, Czech Republic), T. Jürimäe (Tartu, Estonia), M. Kalinski (Kent, USA), M. Kaneko (Osaka, Japan), P. Krutki (Poznań, Poland), K. Laparidis (Thrace, Greece), W. Lipoński (Poznań, Poland), R.M. Malina (Austin, USA), A. Maszczyk (Katowice, Poland), I. Mouratidis (Thessaloniki, Greece), A. Nowak (Poznań, Poland), M. Ogurkowska (Poznań, Poland), W. Osiński (Poznań, Poland), M. Pawlak (Würzburg, Germany), M. Posthumus (Cape Town, South Africa), M. Pridalova (Olomouc, Czech Republic), P. Proia (Palermo, Italy), A. Straburzyńska-Lupa (Poznań, Poland), T. Tasiemski (Poznań, Poland), H. Tscham (Vienna, Austria), M. Woźniewski (Wrocław, Poland)
Indexed in
SCOPUS
EBSCO Publishing, Inc. SPORTDiscus
Ulrich’s International Periodical Directory ICI Journals Master List
AGRO database
Index Copernicus (2017): 88.38 points KBN/MNiSW (2019): 20 points
© Copyright by Akademia Wychowania Fizycznego w Poznaniu
No part of this publication may be reproduced in any form without permission from the Publisher, except for the quotation of brief passages in criticism or any form of scientific commentary.
1. The distribution is realized by the Publisher.
2. The price of polish subscription for one year (1-4/2020) equals 120 PLN. Payments with specified period of subscription are accepted at the following account:
Akademia Wychowania Fizycznego w Poznaniu, PKO BP Poznań nr 86 1020 4027 0000 1902 1271 4947
Please indicite the address for correspondence.
3. The price of foreign subscription for one year (1-4/2020) equals 60 euro or equivalent in the other currency. Payments with specified period of subscription are accepted at the following account:
Akademia Wychowania Fizycznego w Poznaniu, PKO BP Poznań nr 86 1020 4027 0000 1902 1271 4947
Please indicite the address for correspondence.
CONTENTS
ORIGINAL ARTICLE
Increasing role of three-point field goals in National Basketball Association ... 5
Maciej Jaguszewski
Effect of drop height on different parameters of drop jump among
soccer players ... 13
Rohit Kumar Thapa, Amar Kumar, Deepak Sharma
SHORT REVIEW
The influence of temperature on function of mammalian skeletal muscles ... 19
Bartosz Malak
Resistance training in football ... 25
Paweł Kalinowski, Wojciech Sysiak, Damian Jerszyński, Piotr Gronek
ORIGINAL ARTICLE
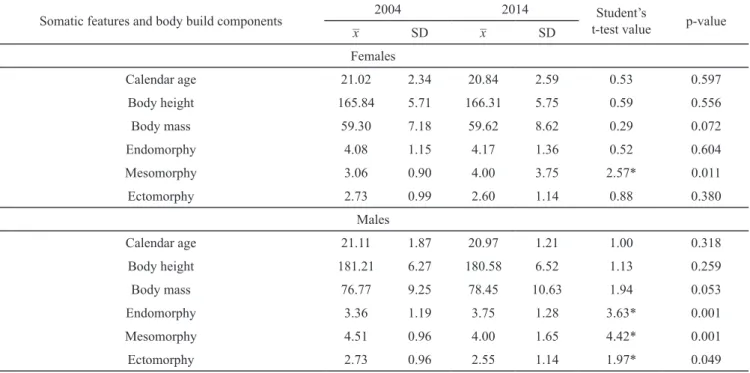
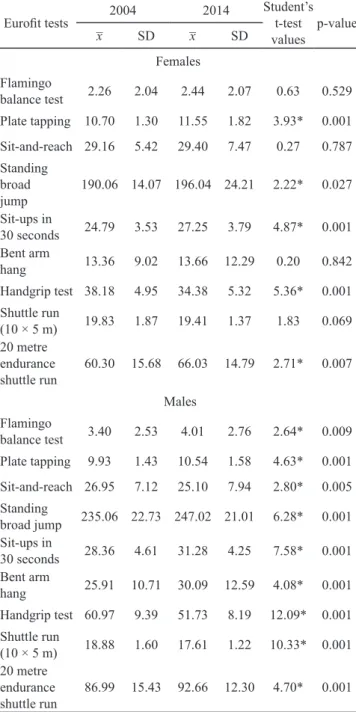
Changes in the somatic build and physical fitness of physical education students
in the years 2004 and 2014 ... 29
Agnieszka Wasiluk, Jerzy Saczuk
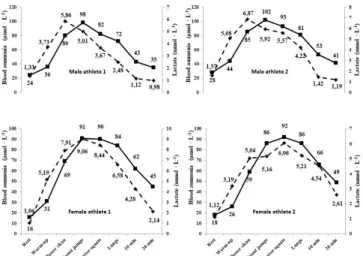
Practical analysis of the metabolic response to a resistance training session
in male and female sprinters ... 35
Michał Włodarczyk, Adam Kantanista, Krzysztof Kusy, Jacek Zieliński,
Barbara Pospieszna
ORIGINAL ARTICLE
TRENDS
in
Sport Sciences
2020; 27(1): 5-11 ISSN 2299-9590 DOI: 10.23829/TSS.2020.27.1-1 Received: 16 November 2019 Accepted: 12 February 2020Corresponding author: maciej.jaguszewski@gmail.com
Adam Mickiewicz University in Poznań, Faculty of Mathematics and Computer Science, Poznań, Poland
MACIEJ JAGUSZEWSKI
Increasing role of three-point field goals
in National Basketball Association
Introduction
I
n basketball, like in the other sports, rules change fromtime to time. Some articles examine the impact of principles adjustments on game-related statistics, mainly in basketball [7, 13, 14], but also in other sports like water polo [16]. The present study shows how much introducing three-point field goal changed the approach to the game of basketball in National Basketball Association (NBA). NBA is a men’s professional basketball league in North America, since 2004 composed of 30 teams (29 from United States and 1 from Canada) and is widely considered to be the best and the most popular men’s professional basketball league in the world. There are many research around the NBA concerning impact of injuries [3, 18] and examining factors leading to wins [1, 12, 15, 19]. Although there are some articles mentioning increasing impact of three-point shots in the NBA [4, 5, 6, 11, 17, 21], they are popular science. In this particular paper this trend was examined scientifically in order to receive significant results useful in understanding recent tendencies in basketball.
In National Basketball Association before 1979 every basket made from the field was worth two points. Since 1979/80 season in the NBA there has been a three-point Abstract
Introduction. Since introduction of three-point field goal NBA teams have used this shot more frequently and nowadays it is inseparable part of teams’ game plan in basketball. The increasing role of three-point shot is recently topic of many conversation around basketball. Aim of Study. The purpose of this study was to examine if the growth of the role of three-point shots in the NBA is statistically significant, to find out the reason for that growth and whether three-point field goal attempts have an impact on result of basketball games. Material and Methods. Statistical data concerning three-point field goal attempts over the course of 15 most recent NBA regular seasons were collected and used in analysis. Increasing role of three-point shot was examined by original method, using 3PA/FGA coefficient which measures the frequency of three-point field goal attempts in all field goal attempts. Statistical calculations were carried out using STATISTICA software package. Results.
Statistically significant differences in frequency of three-point field goal attempts between seasons taken in consideration were revealed by Friedman’s ANOVA. Results also showed that the biggest increase of frequency of three-point shots was between 2015/16 and 2016/17 seasons after the most successful regular season in NBA history by Golden State Warriors. Conclusions.
Three-point field goal became one of the most important part of basketball and its role has increased over the years. Nowadays ability to shoot from beyond the arc is crucial as lack of this ability decreases number of options in offensive tactic by any team. Even though three-point field goal is not the most important factor in determining winner of basketball game, it has significant impact on result of basketball games.
KEYWORDS: three-point field goal, basketball, National Basketball Association, trend in sport.
TRENDS IN SPORT SCIENCES
6 March 2020
JAGUSZEWSKI
line and every shot made from behind that line is worth three points while every other made field goal gives two points [20]. Adding three-point line did not immediately change approach to basketball as three-point shots were not used as often as they are nowadays. At the beginning of three-point era people around NBA were skeptical to new rule and did not think that could change the game of basketball [10] and that was observed as three-pointers were taken occasionally, average less than 3 attempts during whole game by team.
It is worth noting that the number of three-point shot attempts is growing almost every season. This is probably the consequence of coaching staff trying to find the best way to maximize number of points in the same number of possessions which could lead to more wins. It is examined in many analyses what is better for team, for example it is more efficient to attempt a three-point field goal if player makes 35% shots from that area (1.05 points per possession) than a two-point field goal if player shoots 50% from this particular area (1.00 points per possession). Most recently teams use analyses of mapping shots [4] which lead to conclusion three-point field goal attempts are analytically better and make offense more efficient as they give more point per one possession than two point field goals from certain areas.
Even though the result of basketball game consists many factors [8] such as rebounds, free throws and turnovers, in this article only three-point field goal attempts (and their frequency in all field goal attempts) are taken into account to examine increasing role of three-point shots in basketball.
To examine if there is significant growth of role of three-point shots, coefficient 3PA/FGA(%) (three-point field goal attempts/field goal attempts (%)) was used. It is worth mentioning that this is a new idea of examining growth of role of three-point shots by this coefficient and there was no scientific article based on 3PA/ FGA(%). This coefficient measures frequency of three-point field goal attempts among all field goals attempts (two-point and three-point shots) and directly did not depend on pace of the game, rebounds, turnovers, free throws and any other descriptive statistics other than field goal attempts. 3PA/FGA(%) coefficient is count as proportion of team’s three-point field goal attempts and all field goal attempts per game and then result is presented in percentage (multiplied by 100%). In the text the abbreviation 3PA/FGA will be used. This coefficient is better estimate for examining three-point shots’ role than just three-point field goal attempts which could give misleading results. For example if
team A plays fast, attempts 100 field goals per game and attempts 30 three-point field goals on average and team B plays much slower (and draws more fouls or has more turnovers), attempts 80 field goals per game with 28 three-point field goal attempts, only three-point shot attempts give advantage to team A (30 to 28), but if 3PA/ FGA is taken, team B has higher score (35% to 30%) and that is more reliable result because team B is attempting three-point shots more frequently than team A.
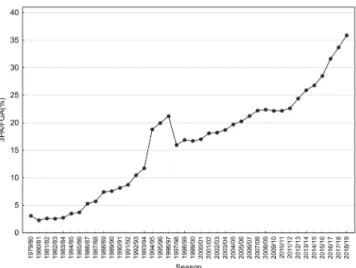
Figure 1. Changes of 3PA/FGA(%) coefficient in the NBA since introduction of three-point field goal
Since the beginning of three-point era (1979/80 NBA season) the growth of three-point shot role is observed. The differences of 3PA/FGA(%) through 40 regular seasons in NBA are presented on Figure 1. It is worth noticing that in first 15 seasons of three-point era on average in every season 3PA/FGA coefficient was 0.62 percentage points (abbreviation p.p. will be used) higher than season before. Then there were three seasons with three-point line shorter, which led to massive increase of 3PA/FGA (by 7 p.p. between 1993/94 and 1994/95 seasons) and then over 5 p.p. decrease after going back to distance of line 7.24 meters away from the rim in 1997/98. Next, there were another 15 seasons in which the average growth of 3PA/FGA in between consecutive seasons was 0.48 p.p., similarly to the start of three-point era. However, since 2011/12 season larger increase of number of shots from distance has been observed as 3PA/FGA coefficient has grown on average by 1.9 p.p. in between consecutive seasons, reaching more than 35% in most recent season. 3PA/FGA coefficient on this level means that over one third of field goal attempts come from behind the three-point line.
In this particular paper, the growth of three-point shot in the NBA in a span of 15 years (between 2004/05
INCREASING ROLE OF THREE-POINT FIELD GOALS IN NATIONAL BASKETBALL ASSOCIATION
and 2018/19 seasons) is examined and its impact on basketball teams’ wins is discussed.
Aim of Study
The purpose of the study is to show the growth of the role of three-point field goals in regular seasons in the NBA last 15 years and check if it is statistically significant. This fact should be useful for coaches to think about how important three-point shot is in their teams’ tactics. This should also be important for coaches responsible for development of young players to lay emphasis on three-point shots as a preparation for them to enter professional league with ability to consistently make three-point field goals. This could also encourage coaches to invent new drills in practice to improve the efficiency of shots from behind the three-point line. Moreover, gaining information on the development of tendencies in basketball can constitute a basis for programming the future evolution of sports results in this particular sport.
Material and Methods
Sample and procedure
Taking into account lack of full statistical data up to 1996, the increasing number of teams in the NBA until 2004 and other rules changes (for example hand checking), it seemed rational to look at latest trends in three-point shots, in most recent 15 years, especially with observation of the biggest improvement last couple of seasons. In this analysis only regular seasons were taken in consideration as there are games between every pair of teams by contrast to playoffs where only some teams participate and they play multiple times against their particular opponent in given round.
Statistical data from the NBA from 2004/05 to 2018/19 season (15 seasons) was collected from https://stats.nba. com, the official page of statistics from NBA games. From every single one of those 15 seasons the average number of each team’s three-point shot attempts and field goal attempts per game were taken and the proportion (in percentage) of those factors was counted. This gave aforementioned coefficient 3PA/FGA which shows the frequency of three-pointers for every team each season. So basically database consisted of 15 seasons (terms) and for every season there were 30 sorted out results of every team’s 3PA/FGA coefficient.
Statistical analysis
Initially, 3PA/FGA coefficient each season was presented by mean, standard deviation, coefficient of variance,
minimum and maximum. Then, the normality of data distribution each season was examined by Shapiro– Wilk’s test. It was found out that not every season has normal distribution of coefficient 3PA/FGA. That led to conclusion the Friedman’s one-way ANOVA should be used to check if there are statistically significant differences between seasons (dependent variables). Also the Friedman’s post-hoc test for multiple comparisons was used to examine in between which seasons statistically significant differences are observed.
All statistical analyses were conducted using Dell Inc. (2016). Dell Statistica (data analysis software system), version 13. software.dell.com. The level of significance for all statistical tests was set at p ≤ 0.05.
Results
It is observed that mean usually grows between seasons. Although average growth between 2004/05 and 2011/12 was only 3 p.p. (0.43 p.p. on average between any two seasons in a row), 7 years later (in 2018/19 season) 3PA/FGA coefficient was higher over 13 p.p. (growth between two consecutive seasons since then was 1.9 p.p. on average). Standard deviation has been changing between seasons, but it is relatively settled around 4.5. Combining that with the growth of the mean of 3PA/FGA, coefficient of variation is decreasing (by 50% between 2004/05 and 2018/19 seasons). This means that the differences between teams in 3PA/FGA are becoming smaller (Table 1).
Examining changes at the span of 15 most recent seasons, the increase of 3PA/FGA coefficient was 16.3 p.p. for average team and statistically significant
differences (χ2 (N = 30, df =14) = 395.85, p ≤ 0.0001)
were revealed (Table 1).
It is worth noting that team with highest 3PA/FGA in 2004/05 season has 23 p.p. smaller coefficient than a team with the highest 3PA/FGA in 2018/19 season, 7 p.p. smaller 3PA/FGA than average team from 2018/19 season and similar 3PA/FGA (just 0.3 p.p. higher) to team with the lowest value of 3PA/FGA from most recent season. Also, there are statistically significant differences (p ≤ 0.001) between 2004/05 season and seasons in between 2011/12 and 2018/19. Slightly smaller, but also statistically significant differences (p < 0.05) are between 2004/05 season and every season in between 2007/08 and 2010/11 (Table 1, Figure 2).
Similarly to 2004/05 season, there are statistically significant differences (p ≤ 0.001) between each of two following seasons (2005/06 and 2006/07) and every season in between 2012/13 and 2018/19 (Table 1).
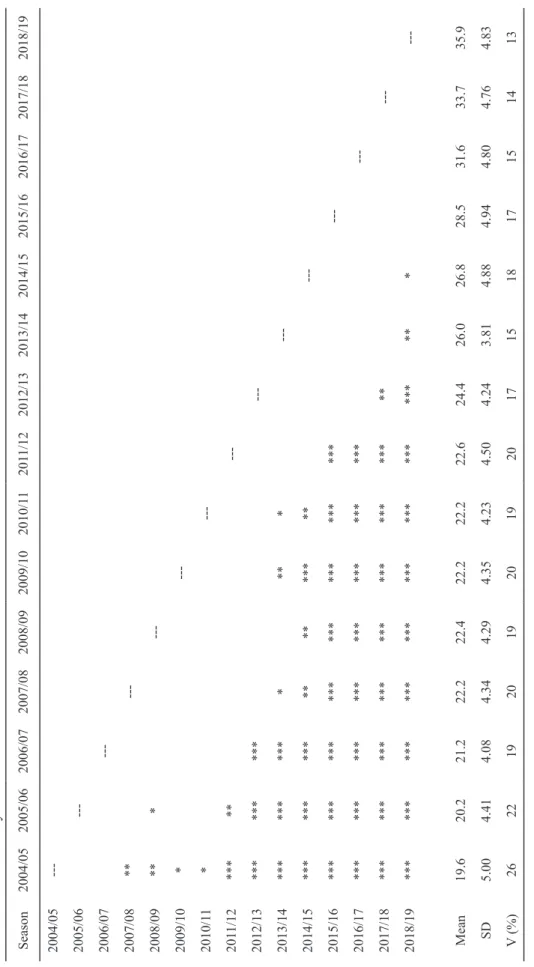
TRENDS IN SPORT SCIENCES 8 March 2020 JAGUSZEWSKI Table 1. Post-hoc for Friedman’ s ANOV A for 3P A/FGA(%) in between all seasons from 2004/05 to 2018/19 and descriptive statistics for every season taken
in consideration in analysis Season
2004/05 2005/06 2006/07 2007/08 2008/09 2009/10 2010/1 1 201 1/12 2012/13 2013/14 2014/15 2015/16 2016/17 2017/18 2018/19 2004/05 ---2005/06 ---2006/07 ---2007/08 ** ---2008/09 ** * ---2009/10 * ---2010/1 1 * ---201 1/12 *** ** ---2012/13 *** *** *** ---2013/14 *** *** *** * ** * ---2014/15 *** *** *** ** ** *** ** ---2015/16 *** *** *** *** *** *** *** *** ---2016/17 *** *** *** *** *** *** *** *** ---2017/18 *** *** *** *** *** *** *** *** ** ---2018/19 *** *** *** *** *** *** *** *** *** ** * ---Mean 19.6 20.2 21.2 22.2 22.4 22.2 22.2 22.6 24.4 26.0 26.8 28.5 31.6 33.7 35.9 SD 5.00 4.41 4.08 4.34 4.29 4.35 4.23 4.50 4.24 3.81 4.88 4.94 4.80 4.76 4.83 V (%) 26 22 19 20 19 20 19 20 17 15 18 17 15 14 13 * p < 0.05, ** p < 0.01, *** p ≤ 0.001
INCREASING ROLE OF THREE-POINT FIELD GOALS IN NATIONAL BASKETBALL ASSOCIATION
The biggest growth of 3PA/FGA (just over 3 p.p.) was between 2015/16 and 2016/17 seasons. Also between those two seasons results of teams with the highest and the lowest coefficients increased by respectively 9 p.p. and 6 p.p. (25% and 31%) (Figure 2).
Furthermore, there are statistically significant differences (p < 0.05) in between every pair of seasons taken into account if they varies from each other by at least 6 seasons. Moreover, there are statistically significant differences (p ≤ 0.001) in between every season from 2015/16 to 2018/19 and every season in between 2004/05 and 2011/12 (Table 1).
It is worth noticing that there are statistically significant differences (p ≤ 0.001) between 2018/19 season and all seasons between 2004/05 and 2012/13, then slightly smaller statistically significant differences (p < 0.01) between 2018/19 and 2013/14 seasons and the smallest possible statistical significance (p < 0.05) in between 2018/19 and 2014/15 seasons. Moreover, the average team from 2018/19 season has higher coefficient than every team with the highest 3PA/FGA until 2013/14 season. That shows how big the growth of role of three-point shot is over the course of recent years (Table 1, Figure 2).
Discussion
One aspect of this study is to show that there are significant differences in 3PA/FGA between seasons and that role of the three-point shot is increasing. That
was examined and presented results give clear statement that is fact. The other topic are reasons for growth of frequency of three-point field goals and impact of 3PA/ FGA on the result of basketball games.
It is worth mentioning that since 2004/05 season every team with the highest 3PA/FGA coefficient in particular season has won at least as many games as lost, with average winning rate of 66% (almost two third games won by that team). Teams with the highest 3PA/FGA who were at the top of this coefficient’s classification for two or more consecutive seasons were examined more precisely to find out impact of 3PA/FGA on results of basketball games.
First of all, there was Phoenix Suns (2004-2006) who won respectively 62 and 54 games (from 82) in those two seasons and was coached by Mike D’Antoni [2]. That Suns’ team played with the fastest pace in league in that particular seasons and combining that with many three-point specialists on the team they were pioneers in attempting many more three-point shots than other teams. It is worth noticing that in 2018/19 season 29 of 30 teams had higher 3PA/FGA coefficient than Suns’ team from 2004/05 season. Then there was Orlando Magic (2007-2012) who had many specialists in shooting three-point field goals. They won at least 52 games (from 82-game seasons) in every season they led the league in 3PA/FGA(%), but their highest result (35%) is still smaller than value of 3PA/FGA for average team from 2018/19 season. Comparing those two teams who had the highest 3PA/FGA before with result of teams in most recent season shows how massive the growth of role of three-point field goal was in a span of 15 years. Most recently there is Houston Rockets (2013-2019) with Daryl Morey as general manager. Morey trusts analytical methods and tries to build a team relying on three-point shots because that should give more points to his team [9]. Furthermore, since 2016 Rockets are coached by Mike D’Antoni who was mentioned earlier as Suns’ coach from 2004 to 2006. Since then 3PA/FGA coefficient has grown rapidly for Rockets – starting from 9 p.p. jump (from 37% to 46%) when D’Antoni took over the team, to 3PA/FGA equals to a little over 50% and almost 52% respectively in two most recent seasons (Figure 2). Moreover, Rockets had almost 10 p.p. higher 3PA/FGA coefficient than team with the second highest result in that coefficient during 2018/19 season.
What is worth noticing, in 2015/16 season Rockets, who won 41 games that season, were a team with the highest 3PA/FGA, but close behind them there were Golden State Warriors who made the most three-point field goals in the NBA that season, were second in 3PA/FGA and had the
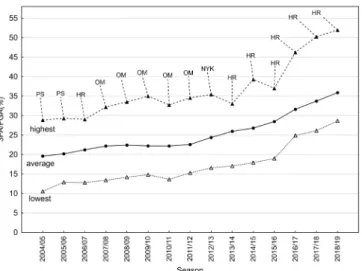
Note: PS – Phoenix Suns, HR – Houston Rockets, OM – Orlando Magic, NYK – New York Knicks
Figure 2. Changes of 3PA/FGA(%) coefficient in the NBA in between 2004/05 and 2018/19 seasons for teams with the highest, average and the lowest 3PA/FGA(%) every given season
TRENDS IN SPORT SCIENCES
10 March 2020
JAGUSZEWSKI
best regular season’s record 73-9 (73 wins, 9 loses) in NBA history. Warriors were led by Stephen Curry, who had himself the best shooting season in NBA history as he made 402 three-point shots in that particular regular season. It is worth mentioning that the biggest growth of 3PA/FGA coefficient in span of 15 years taken in consideration happened after this spectacular season by Warriors as their result in that season was example of successful application of offense heavily relying on three-point shots and inspired others to build team in similar style of play to their team.
However, it is observed that teams with second highest result of 3PA/FGA won 54% of games, much less than teams with the highest result (66%) and even less than ninth and fifteenth highest result of 3PA/FGA (respectively 60% and 56% winning rate). It is also worth mentioning that there are examples of teams who won many games in regular season despite not being at top of 3PA/FGA. One of that team were San Antonio Spurs in 2015/16 season who had 67 wins and sixth lowest 3PA/FGA in the league this particular season. It shows that teams can win many games despite not relying on three-point shots as much as other teams and 3PA/FGA is not always decisive factor when it comes to result of basketball games.
It is worth noting that when three-point field goal attempts are used more often, their impact on results of game is bigger. Impact on results of game by 3PA/ FGA was examined in between 2015/16 and 2017/18 NBA seasons [21] and results showed that teams having a value of 3PA/FGA more than 55% given game won over 78% of those games and teams who had 3PA/FGA in between 50% and 55% attempts coming from three-point shots in particular game, won over 58% of games. It suggests that bigger number of three-point field goal attempts increases a chance to win basketball game. Although the number of three-point field goal attempts have significant impact on results of basketball games, it is important to point out that they are not the most important factor to determinate winning team in basketball game according to study by Ibañez [8]. It is worth noting that this study only concerns three-point attempts and makes, but not 3PA/FGA coefficient, which could give different results. Moreover, this study based on junior championship in 1999, so it was not examined for professional league and it was before years taken in consideration in analysis which examined this trend in this particular paper. It is interesting how it looks with 3PA/FGA coefficient during different period of times (in between 2004/05 and 2018/19 seasons) and in the NBA (or at least in professional league), but
such studies were not found. That type of study would be helpful to confirm three-point field goals’ impact on result of basketball games in recent years.
Even though three-point field goals are not yet the most important factor in determining winner of basketball game, players’ ability to make three-point shots has an impact on offense not seen in the descriptive statistics. This becomes crucial in creating good offense in basketball as ability to consistently making three-point shots makes two-point shots easier and more efficient because defenders are not willing to help when players they defend are good three-point shooters and help would mean they allow open three-point field goal attempts for them.
This study was made based on NBA regular season games which might not be fully representative for all kind of basketball leagues, especially taking in consideration some differences in rules between NBA and other basketball leagues. Moreover, different results could be observed if playoff games were taken into account. That can be interesting topic to examine in another study.
Conclusions
In conclusion, this study shows that there is statistically significant growth of frequency of attempting three-point field goals in the NBA. It was also presented that many successful teams in recent years used three-point shots as important part of their game plan and three-point shot has an impact on result of basketball games. Observation of how other successful teams are built and using more analytics tools are probably the reason for increasing role of three-point shots in whole NBA league. Basketball fans and experts since more than a decade can see how big is difference between approach to the game back then and now. The question is how role of three-point field goals will look in the future – is increase going to stop and if so, when and why? Also the question is – will rules concerning three-point shots change? There are many suggestions like moving three-point line further or maybe even create four-three-point field goals. Thinking about changing basketball rules due to increasing number of three-pointers just confirms that three-point shot became very important part of basketball despite the fact that at the beginning it wasn’t considered as a thing that could change approach to the basketball.
References
1. Belk JW, Marshall HA, McCarty EC, Kraeutler MJ. The effect of regular-season rest on playoff performance
INCREASING ROLE OF THREE-POINT FIELD GOALS IN NATIONAL BASKETBALL ASSOCIATION
among players in the National Basketball Association. Orthop J Sports Med. 2017; 5(10).
2. Davis S. The coach who designed the offense that changed the NBA nearly failed before he started. Business Insider. 2017 Dec 3. Retrieved Nov 18, 2019, from: https://www. businessinsider.com/mike-dantoni-offense-shaped-nba-2017-11.
3. Drakos MC, Domb B, Starkey C, Callahan L, Allen AA. Injury in the National Basketball Association: a 17-year overview. Sports Health. 2010; 2(4): 284-290.
4. Goldsberry K. How mapping shots in the NBA changed it forever. FiveThirtyEight. 2019 May 2. Retrieved Nov 18, 2019, from: https://fivethirtyeight.com/features/ how-mapping-shots-in-the-nba-changed-it-forever/. 5. Goldsberry K. The NBA is obsessed with 3s, so let’s
finally fix the thing. ESPN. 2019 Apr 30. Retrived Nov 18, 2019, from: https://www.espn.com/nba/story/_/ id/26633540/the-nba-obsessed-3s-let-fix-thing.
6. Haberstroh T. Lies, damned lies and statistics: the confusing analytics of the NBA’s 3-point obsession. NBC Sports. 2019 Dec 6. Retrieved Nov 18, 2019, from https://www.nbcsports.com/philadelphia/nba-insider-tom- haberstroh/lies-damned-lies-and-statistics-confusing-analytics-nbas-3-point.
7. Ibañez SJ, Garcia-Rubio J, Gomez MA, Gonzalez-Espinoza S. The impact of rule modifications on elite basketball teams’ performance. J Hum Kinet. 2018; 64: 181-193.
8. Ibañez SJ, Sampaio J, Buñuel P, Giménez Fuentes-Guerra J, Janeira M. Game statistics discriminating the final outcome of Junior World Basketball Championship matches (Portugal 1999). J Hum Mov Stud. 2003; 45: 001-019.
9. Kram Z. The 3-point boom is far from over. The Ringer. 2019 Feb 27. Retrieved Nov 18, 2019, from: https:// www.theringer.com/nba/2019/2/27/18240583/3-point-boom-nba-daryl-morey.
10. Mather V. How the N.B.A. 3-point shot went from gimmick to game changer. NYTimes. 2016 Jan 20, B: 15.
11. Meng A. How the three-point line changed the NBA and the game of basketball. NYC Data Science Academy. 2018 Nov 5. Retrieved Nov 18, 2019, from: https:// nycdatascience.com/blog/r/how-has-the-three-point-line-changed-the-nba-and-the-game-of-basketball/. 12. Moxley JH, Towne TJ. Predicting success in the National
Basketball Association: stability & potential. Psychol Sport Exerc. 2015 Jan; 16(1): 128-136.
13. Pluta B, Andrzejewski M. Analysis of team sports results based on the European basketball men’s championships. Trends Sport Sci. 2018; 1(25): 21-27.
14. Pluta B, Andrzejewski M, Lira J. The effects of rule changes on basketball game results in the men’s European Basketball Championships. Hum Mov Sci. 2014; 15(4): 204-208.
15. Pollard R, Pollard G. Long-term trends in home advantage in professional team sports in North America and England (1876-2003). J Sports Sci. 2005; 23: 337- -350.
16. Sahrom S, Chen S, Tan F, Kong PW, Lee M. Short-term influence of rule changes on match characteristics in water polo. JPES. 2018; 72(1): 503-511.
17. Shea S. The 3-point revolution. ShotTracker. 2018. Retrieved Nov 18, 2019, from: https://shottracker.com/ articles/the-3-point-revolution.
18. Starkey C. Injuries and illnesses in the National Basketball Association: a 10-year perspective. J Athl Train. 2000; 35(2): 161-167.
19. Teramoto M, Cross CL. Importance of team height to winning games in the National Basketball Association. Int J Sports Sci Coa. 2017; 13(4): 559-568.
20. Wood R. The history of 3-pointer. USA Basketball. 2011 Jun 15. Retrieved Nov 18, 2019, from: https://www.usab. com/youth/news/2011/06/the-history-of-the-3-pointer. aspx.
21. Zhu A. Three is greater than two. Sports Analytics Group Berkeley. 2019 Jan 7. Retrieved Nov 18, 2019, from: https://sportsanalytics.berkeley.edu/articles/nba-threes. html.
ORIGINAL ARTICLE
Received: 6 January 2020 Accepted: 24 February 2020
Corresponding author: rohitthapa04@gmail.com
1 Lakshmibai National Institute of Physical Education,
Department of Sports Biomechanics, Gwalior, India
2 Lakshmibai National Institute of Physical Education,
Department of Exercise Physiology, Gwalior, India
ROHIT KUMAR THAPA1, AMAR KUMAR1, DEEPAK SHARMA2
Effect of drop height on different parameters of drop
jump among soccer players
TRENDS
in
Sport Sciences
2020; 27(1): 13-18 ISSN 2299-9590 DOI: 10.23829/TSS.2020.27.1-2 IntroductionS
occer is among the most popular sports and is beingplayed by many countries across the globe. Now and then, the teams want to perform better than their opponents. Moreover, thus, changes in training methodology to improve the performance of soccer players are very much accepted by teams all around the world [22]. This has led to more researches being conducted in soccer, and one such widely researched area is plyometric training for soccer players [22, 28]. Even if soccer player’s aerobic capacity is critical in a soccer game [25], high-intensity player’s efforts cannot be overlooked as they play a vital role in a soccer match [1, 8]. These high-intensity bouts include repeated kicking actions, changing directions, explosive sprinting, and jumping, all making significant contributions to the soccer player’s performance [25, 26, 29]. Developing a soccer player’s ability to generate power quickly would be an advantage to the soccer player during a match [20].
The successful transition of plyometric training to soccer performance is probably because many soccer activities need Abstract
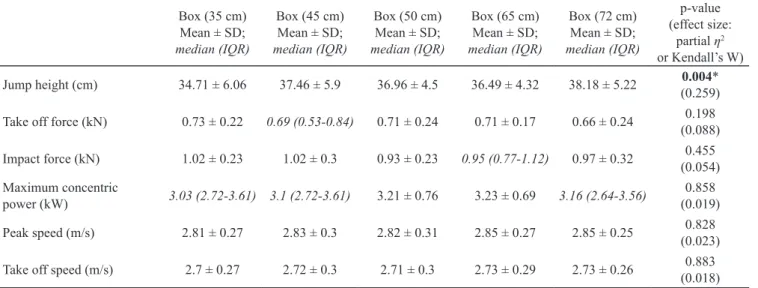
Introduction. Drop jump is one of the most researched plyometric exercises. Different drop heights were earlier investigated for ground reaction forces, biomechanical analysis, and other parameters. There has been no research into the influence of drop height on maximum jump height during drop jump among soccer players. Aim of Study. This study aimed to find out the optimal drop height for maximum vertical jump height in drop jumps. Material and Methods. The researchers selected 17 male soccer players (mean ± SD; age 21 ± 2 years, height 174 ± 8 cm, body mass 63 ± 5 kg, isometric leg strength 122 ± ± 18 kg) for the study. Drop jump from different heights (35 cm, 45 cm, 50 cm, 65 cm, and 72 cm) was investigated for jump height, take-off force, take-off speed, impact force, maximum concentric power, and peak speed. Results. Repeated measures ANOVA revealed significant difference in jump height from different drop height (F2.54,40.59 = 5.605, p = 0.004, partial η2 = 0.259).
Post-hoc analyses through Bonferroni adjustment showed significant differences between jump height from 35 cm box and 45 cm box (t16 = 4.31, p = 0.001, d = 0.47) and 35 cm box to 72 cm box
(t16 = 3.52, p = 0.003, d = 0.60). However, no significant differences could be observed in take-off force, impact force, maximum concentric power, peak speed, and take-off speed from different drop heights. Isometric leg strength were significantly correlated with jump height from 35 cm (p = 0.014), 45 cm (p = 0.021) and 50 cm (p = 0.022) drop height. Conclusions. The study concludes that to improve maximum jump ability of soccer players, box height ranging around 65 cm to 72 cm may be selected for training purposes and thus may help improve the body’s ability to convert the momentum generated by a run to maximum vertical height. KEYWORDS: drop jump, drop height, jump height, soccer players.
TRENDS IN SPORT SCIENCES
14 March 2020
THAPA, KUMAR, SHARMA
movements with rapid stretch-shortening sequence, with players having to bounce against the surface with minimal surface contact phases [2, 17, 20]. Soccer coaches widely use plyometric exercises in their training periodization as it
may increase the VO2 peak percentage in soccer players [9],
increase endurance and power generation in muscles [23], and also improve the ball velocity during soccer kick [6]. Drop jump is one of the most commonly used plyometric exercises to develop and evaluate jumping performance [15, 19]. Due to its proper metrics, such as reliability, validity, and sensitivity, the implementation of drop jump as a standard test has also been widely used and well supported in the literature [3, 12, 15, 27]. Thus, drop jump has been a choice of soccer coaches in developing muscle power of lower limbs for a long time [3, 15]. Also, numerous studies on drop jump revealed positive effects on jumping performance after the inclusion of drop jump in training or rehabilitation program [13, 14].
A drop jump is attempted by dropping from an elevated surface and attempting to make a vertical jump for maximum height after landing on the ground. A characteristic pattern is observed while the muscle elastic energy is retained and used during a drop jump. The gravitational force causes the body to move down, and energy is retained in the elastic components of the stretched muscles during the eccentric process. Furthermore, when the body moves up during the concentric process, it uses the muscle’s stored energy [5, 10].
Many types of research were carried out to see the impact of the technique, optimum drop height, ground reaction force, body mass on peak power output, and drop jump intensity [11, 15, 19]. Our study was being conducted to find out the best possible drop height (from 35 cm to 72 cm) for maximizing the vertical jump of soccer players.
Aim of Study
The aim of the present study was to (a) to compare drop jump parameters shown by soccer players from different drop height, and (b) investigate the relationship of isometric leg strength with jump height from different drop height. It was hypothesized that soccer players would exhibit significant differences in drop jump parameters from different heights and a significant correlation between isometric leg strength and jump height from different drop heights.
Material and Methods
Subjects
Seventeen male subjects who were a part of the university soccer team which participated in national university
games were selected for the study (mean ± SD; age 21 ± ± 2 years, height 174 ± 8 cm, body mass 63 ± 5 kg, isometric leg strength 122 ± 18 kg). The subjects had a minimum playing experience of 6 years during the collection of data. Plyometrics had been included and been a part of the training sessions of soccer players for 3 or more years. The subjects who participated in this study were physically active and training for national competitions. The inclusion criteria in this investigation were the absence of recent lower limb injury, lower back injury, or any musculoskeletal dysfunction within 6 months, which could hinder the execution of a proper drop jump. The execution of the study was in line with the Helsinki declaration’s ethical principles for human research. Subjects were asked to fill out forms of informed consent. The research was approved by the institution’s Sports Biomechanics department’s research committee.
Procedure
All the subjects performed 10-minutes warm-up, which included dynamic stretching, plyometric exercises, and mobility exercises for the joints before the conduct of the test [26]. The subjects had to perform drop jump from varying heights (35 cm, 45 cm, 50 cm, 65 cm, 72 cm) with an instantaneous vertical jump intended for maximum height [11]. Participants were instructed to jump right after landing and cover the maximum vertical height possible. Each subject was allowed three trials in each box height. The order of the box height for drop jump was randomly assigned. The subject performed a total of 15 jumps. A rest interval of 30-seconds was allowed in between each trial [11].
BTS G-Sensor (S.P.A., Italy) which has tri-axial accelerometer with multiple sensitivity (±1.5 g, ±6 g), tri-axial magnetometer and tri-axial gyroscope with multiple sensitivity (±300 gps, ±1200 gps) was used to measure the outcomes of the drop jump. The protocol was set to drop jump in G Studio’s (ver. 3.3.22.0) jump protocol section. Jump height, take-off force, impact force, maximum concentric power, peak speed, and take-off speed were the outcome variables of drop jump using the G-sensor and G-studio software. The drop jump with the maximum jump height among three trials was selected for analysis [26].
To measure the isometric leg strength, a leg and back dynamometer (T.K.K. 5402, Takei Scientific Instrument CO., LTD, Japan) was used. The subjects were asked to stand upright on the base of the dynamometer with the feet shoulder-width apart. Arms were hanged straight down to hold the bar at the centre with both hands, and
EFFECT OF DROP HEIGHT ON DIFFERENT PARAMETERS OF DROP JUMP AMONG SOCCER PLAYERS
palms facing towards the body. The knee was allowed to flex approximately 110 degrees, and then the chain was adjusted. The subjects were then asked to pull as hard as possible and asked to straighten the legs without bending the back [30].
Statistical analysis
Statistical analysis of the acquired data was performed using IBM SPSS (version 20.0.0). Shapiro–Wilk test was conducted to check the violations of the assumptions of
0.06 medium, and 0.14 large effect. While for Friedman’s test, Kendall’s W was calculated with 0.1 defining small, 0.3 moderate, and 0.5 large effects [7]. For Pearson correlation r = 0.10 specifies a low, r = 0.30 a moderate, and r = 0.50 a high association [7]. Cohen’s d was calculated to determine the effect size for the student’s t-test for paired sample, with d = 0.20 defining a small, d = 0.50 defining a medium and d = 0.80 defining a large effect size. The level of significance for all tests was set at 0.05.
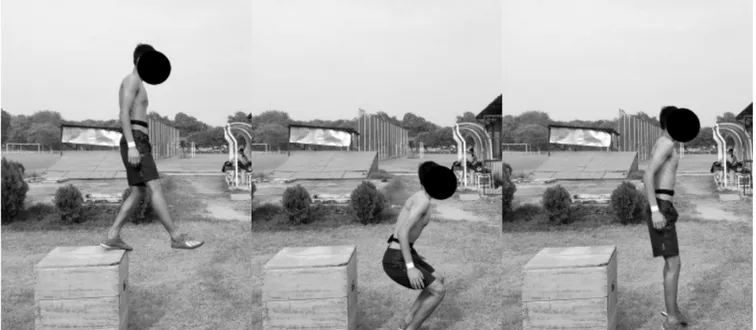
Figure 1. Subject performing drop jump with the BTS G-sensor tied on the waist of the subject
normality. Non-parametric tests equivalent to its parametric counterpart were used for the analysis of non-normal data. Single-factor repeated measures ANOVA with five levels (box heights) were used separately for jump height, peak speed, and take-off speed. Greenhouse-Geisser corrections were used in cases where we found violations of assumptions of sphericity using the Mauchly’s sphericity test. Post-hoc paired t-test with a Bonferroni adjustment (p = 0.01) was used to find any significant differences between the levels. Friedman’s test (non-parametric) was used to analyze take-off force, impact force, and maximum concentric power, since one or more variables failed the test of normality and violated the assumptions of RMA. The relationship between isometric leg strength and output variables from various drop heights was evaluated with the Pearson product-moment correlation.
The effect sizes were calculated using partial η2 for
repeated measures ANOVA, with 0.01 defining small,
Results
Table 1 shows the values of all the measured variables. The outcome of the repeated measures ANOVA was significant in jump height from different box height,
F2.54,40.59 = 5.605, p = 0.004, partial η2 = 0.259.
Post-hoc analyses by means of Bonferroni adjustment discovered significant differences between jump height
from 35 cm box and 45 cm box (t16 = 4.31, p = 0.001,
d = 0.47) and 35 cm box to 72 cm box (t16 = 3.52,
p = 0.003, d = 0.60).
There were no significant differences in take-off force (p = 0.198), impact force (p = 0.455), maximum concentric power (p = 0.858), peak speed (p = 0.828), and take-off speed (p = 0.883) from different drop heights.
There was a statistically significant correlation between the isometric strength of the leg and the height of the jump from 35 cm (p = 0.014), 45 cm (p = 0.021), and 50 cm (p = 0.022) drop heights.
TRENDS IN SPORT SCIENCES
16 March 2020
THAPA, KUMAR, SHARMA
Figure 2. Bar diagram of maximum jump height from different box height
Table 2. Correlation of isometric leg strength with jump height from different drop heights
Box
(35 cm) (45 cm)Box (50 cm)Box (65 cm)Box (72 cm)Box Isometric leg
strength (r) 0.585* 0.556* 0.550* 0.328 0.478 p-value 0.014 0.021 0.022 0.199 0.052 * denotes significant correlation at 0.05 level
Discussion
In this present study, the assumption was that different drop heights would contribute to different vertical jump height for drop jump amongst soccer players. When
the drop height rose from 35 cm to 45 cm, there was a significant increase in the height of the jump with a medium effect size. While the height of the jump did not differ significantly between 45 cm, 50 cm, and 65 cm drop height. A significant difference could also be seen in jump height when drop height increased from 35 cm to 72 cm with a medium effect size. A similar finding was observed in a study conducted by Ramirez-Campillo et al. [22], where the transference effect coefficient (TEC) was found higher for drop jump training from 40 cm than 20 cm height. The results of this study suggest that, with the increase in drop height, the height of the jump increases. A study conducted by Ramirez-Campillo et al. reported an increase in ground reaction force when the height of drop was increased from 20 cm to 40 cm and 60 cm when the toes and heels were in contact with the ground. A similar study by Caster found an increase in the maximum GRF when drop height was increased by 15 cm, 30 cm, 45 cm, and 60 cm. Some other studies were also conducted with different heights, like McKay et al. [16] who investigated 10 cm, 30 cm, and
50 cm, while Seegmiller and McCaw [24] investigated
30 cm, 60 cm, and 90 cm. All these experiments showed that there were higher ground reaction forces with a drop height increase. Also, our finding suggests that a height of 45 cm, 50 cm, and 65 cm used for drop jump yield similar jump height, and thus using any drop height between 45 and 65 cm would have the same effect on the jump height of soccer players.
No significant differences in take-off force, impact force, maximum concentric power, peak speed, and take-off speed between different drop heights were observed.
Table 1. Drop jump parameters using G-sensor from the different drop heights
Box (35 cm) Mean ± SD; median (IQR) Box (45 cm) Mean ± SD; median (IQR) Box (50 cm) Mean ± SD; median (IQR) Box (65 cm) Mean ± SD; median (IQR) Box (72 cm) Mean ± SD; median (IQR) p-value (effect size: partial η2 or Kendall’s W) Jump height (cm) 34.71 ± 6.06 37.46 ± 5.9 36.96 ± 4.5 36.49 ± 4.32 38.18 ± 5.22 (0.259)0.004* Take off force (kN) 0.73 ± 0.22 0.69 (0.53-0.84) 0.71 ± 0.24 0.71 ± 0.17 0.66 ± 0.24 (0.088)0.198 Impact force (kN) 1.02 ± 0.23 1.02 ± 0.3 0.93 ± 0.23 0.95 (0.77-1.12) 0.97 ± 0.32 (0.054)0.455 Maximum concentric
power (kW) 3.03 (2.72-3.61) 3.1 (2.72-3.61) 3.21 ± 0.76 3.23 ± 0.69 3.16 (2.64-3.56) (0.019)0.858 Peak speed (m/s) 2.81 ± 0.27 2.83 ± 0.3 2.82 ± 0.31 2.85 ± 0.27 2.85 ± 0.25 (0.023)0.828 Take off speed (m/s) 2.7 ± 0.27 2.72 ± 0.3 2.71 ± 0.3 2.73 ± 0.29 2.73 ± 0.26 (0.018)0.883 Note: IQR = interquartile range, SD = standard deviation
EFFECT OF DROP HEIGHT ON DIFFERENT PARAMETERS OF DROP JUMP AMONG SOCCER PLAYERS
Soccer is a body contact sports [31], which includes jumps ranging from 1 to 36 during a top-level game [18]. A soccer player, thus, is accustomed to numerous jumps and landing during his entire career, including games and training. This might have led the soccer players capable of maintaining a similar impact force, take-off force, maximum concentric power, peak speed, and take-off speed throughout the jumps from different heights.
Further analysis of the relationship of isometric leg strength with jump height from different drop height revealed that a significant correlation was established among isometric leg strength and 35 cm, 45 cm, and 50 cm drop height while the relationship could not be established with the higher end of drop height. Pedersen et al. [21] conducted a study, where improved maximal strength was found not to be associated with jump height in countermovement jump in high-level female soccer players. This study partially supports our study. The jump height in the lower end of drop height may be contributed more by isometric leg strength. This might mean that the higher the isometric strength of the leg, the higher the jump height will be in drop heights from 50 cm and below. The results also reveal that the isometric strength of the leg does not contribute significantly to drop heights above 50 cm. The reason for this may be more flight time allowed during a drop from heights above 50 cm, which allows the body to generate more momentum, which then is utilized by the body to gain maximum vertical heights [4].
Conclusions
From the results and findings of the study, it can be concluded that soccer coaches may utilize different box height ranging from 35 cm to 72 cm to improve maximum concentric power, take-off speed and force ability, and ability to minimize the impact force while landing since all drop heights had shown a similar contribution to all those parameters. To improve maximum jump ability of soccer players, box height ranging around 65 cm to 72 cm may be selected for training purposes since these two drop heights exhibited maximum jump height, and thus may help improve the body’s ability to convert the momentum generated by a run to maximum vertical height. Further, more studies are required in this area to investigate the effects of drop heights on other sports athletes, who require improvement in jump ability.
References
1. Barnes C, Archer D, Hogg B, Bush M, Bradley P. The evolution of physical and technical performance parameters in the English Premier League. Int J Sports
Med. 2014; 35(13): 1095-1100. DOI: 10.1055/s-0034-1375695.
2. Bates NA, Ford KR, Myer GD, Hewett TE. Timing differences in the generation of ground reaction forces between the initial and secondary landing phases of the drop vertical jump. Clin Biomech. 2013; 28(7): 796-799. DOI: 10.1016/j.clinbiomech.2013.07.004.
3. Bobbert MF. Drop jumping as a training method for jumping ability. Sports Med. 1990; 9(1): 7-22. DOI: 10.2165/00007256-199009010-00002.
4. Bompa TO. Power training for sport: plyometrics for maximum power development. Oakville, New York, London: Mosaic Press; 1996.
5. Bosco C, Tihanyi J, Komi PV, Fekete G, Apor P. Store and recoil of elastic energy in slow and fast types of human skeletal muscles. Acta Physiol Scand. 1982; 116(4): 343- -349. DOI: 10.1111/j.1748-1716.1982.tb07152.x. 6. Campo SS, Vaeyens R, Philippaerts RM, Redondo JC,
de Benito AM, Cuadrado G. Effects of lower-limb plyometric training on body composition, explosive strength, and kicking speed in female soccer players. J Strength Cond Res. 2009; 23(6): 1714-1722. DOI: 10.1519/JSC.0b013e3181b3f537.
7. Cohen J. Statistical power analysis for the behavioural sciences. Hillsdale: Lawrence Erlbaum Associates; 1988. 8. Faude O, Koch T, Meyer T. Straight sprinting is the
most frequent action in goal situations in professional football. J Sports Sci. 2012; 30(7): 625-631. DOI: 10.1080/02640414.2012.665940.
9. Grieco CR, Cortes N, Greska EK, Lucci S, Onate JA. Effects of a combined resistance-plyometric training program on muscular strength, running economy, and VO2peak in division I female soccer players. J Strength Cond Res. 2012; 26(9): 2570-2576. DOI: 10.1519/ JSC.0b013e31823db1cf.
10. Kollias I, Panoutsakopoulos V, Papaiakovou G. Comparing jumping ability among athletes of various sports: vertical drop jumping from 60 centimeters. J Strength Cond Res. 2004; 18(3): 546-550. DOI: 10.1519/1533-4287(2004)18<546:CJAAAO>2.0.CO;2. 11. Makaruk H, Sacewicz T. The effect of drop height and
body mass on drop jump intensity. Biol Sport. 2011; 28(1): 63-67. DOI: 10.5604/935873.
12. Malfait B, Sankey S, Firhad Raja Azidin RM, Deschamps K, Vanrenterghem J, Robinson MA, et al. How reliable are lower-limb kinematics and kinetics during a drop vertical jump? Med Sci Sports Exerc. 2014; 46(4): 678- -685. DOI: 10.1249/MSS.0000000000000170.
13. Markovic G. Does plyometric training improve vertical jump height? A meta-analytical review. Br J Sports Med. 2007; 41: 349-355. DOI: 10.1136/bjsm.2007.035113.
TRENDS IN SPORT SCIENCES
18 March 2020
THAPA, KUMAR, SHARMA
14. Markovic G, Mikulic P. Neuro-musculoskeletal and performance adaptations to lower-extremity plyometric training. Sports Med. 2010; 40(10): 859-895. DOI: 10.2165/11318370-000000000-00000.
15. Matic MS, Pazin NR, Mrdakovic VD, Jankovic NN, Ilic DB, Stefanovic DLJ. Optimum drop height for maximizing power output in drop jump. J Strength Cond Res. 2015; 29(12): 3300-3310. DOI: 10.1519/ JSC.0000000000001018.
16. McKay H, Tsang G, Heinonen A, MacKelvie K, Sanderson D, Khan KM. Ground reaction forces associated with an effective elementary school based jumping intervention. Br J Sports Med. 2005; 39(1): 10-14. DOI: 10.1136/bjsm.2003.008615.
17. Michailidis Y. Effect of plyometric training on athletic performance in preadolescent soccer players. J Hum Sport Exerc. 2015; 10(1): 15-23. DOI: 10.14198/jhse. 2015.101.02.
18. Mohr M, Krustrup P, Bangsbo J. Match performance of high-standard soccer players with special reference to development of fatigue. J Sports Sci. 2003; 21(7): 519- -528. DOI: 10.1080/0264041031000071182.
19. Newton RU, Young WB, Kraemer WJ, Byrne C. Effects of drop jump height and technique on ground reaction force with possible implication for injury. Sports Med Train Rehab. 2001; 10(2): 83-93. DOI: 10.1080/15438620109512099.
20. Oliver JL, Barillas SR, Lloyd RS, Moore I, Pedley J. External cueing influences drop jump performance in trained young soccer players. J Strength Cond Res. 2019; 1. Epub Jan 22, 2019. DOI: 10.1519/jsc.0000000000002935. 21. Pedersen S, Heitmann KA, Sagelv EH, Johansen D,
Pettersen SA. Improved maximal strength is not associated with improvements in sprint time or jump height in high-level female football players: a cluster-randomized controlled trial. BMC Sports Sci Med Rehabil. 2019; 11(1). DOI: 10.1186/s13102-019-0133-9.
22. Ramírez-Campillo R, Alvarez C, García-Pinillos F, Gentil P, Moran J, Pereira LA, Loturco I. Effects of
plyometric training on physical performance of young male soccer players: potential effects of different drop jump heights. Pediatr Exerc Sci. 2019; 31(3), 306-313. DOI: 10.1123/pes.2018-0207.
23. Ramírez-Campillo R, Burgos CH, Henríquez-Olguín C, Andrade DC, Martínez C, Álvarez C, et al. Effect of unilateral, bilateral, and combined plyometric training on explosive and endurance performance of young soccer players. J Strength Cond Res. 2015; 29(5): 1317-1328. DOI: 10.1519/JSC.0000000000000762.
24. Seegmiller JG, McCaw ST. Ground reaction forces among gymnasts and recreational athletes in drop landings. J Athl Train. 2003; 38(4): 311-314.
25. Stølen T, Chamari K, Castagna C, Wisløff U. Physiology of soccer: an update. Sports Med. 2005; 35(6): 501-536. DOI: 10.2165/00007256-200535060-00004.
26. Thapa RK, Kumar A, Sharma D, Rawat JS, Narvariya P. Lower limb muscle activation during instep kick from different approach angles and relationship of squat jump with 10-m sprint, 30-m sprint, static balance, change of direction speed and ball velocity among soccer players. JPES. 2019; 19. DOI: 10.7752/jpes.2019.s6341.
27. Viitasalo JT, Salo A, Lahtinen J. Neuromuscular functioning of athletes and non-athletes in the drop jump. Eur J Appl Physiol. 1998; 78(5): 432-440. DOI: 10.1007/ s004210050442.
28. Wang Y-C, Zhang N. Effects of plyometric training on soccer players. Exp Ther Med. 2016; 12(2): 550-554. DOI: 10.3892/etm.2016.3419.
29. Wisløff U, Castagna C, Helgerud J, Jones R, Hoff J. Strong correlation of maximal squat strength with sprint performance and vertical jump height in elite soccer players. Br J Sports Med. 2004; 38(3): 285-288. DOI: 10.1136/bjsm.2002.002071.
30. Wood R. Isometric Leg Strength Test. Retrieved from: https://www.topendsports.com/testing/tests/isometric-strength.htm.
31. Woods RB. Social issues in sports. Third edition. Champaign: Human Kinetics; 2015.
Received: 16 February 2020 Accepted: 15 March 2020
Corresponding author: malak@awf.poznan.pl
Poznan University of Physical Education, Department of Physiology and Biochemistry, Poznań, Poland
The influence of temperature on function of mammalian
skeletal muscles
BARTOSZ MALAKTRENDS
in
Sport Sciences
2020; 27(1): 19-24 ISSN 2299-9590 DOI: 10.23829/TSS.2020.27.1-3SHORT REVIEW
IntroductionI
n the mid-1950s, Huxley detailed the sliding filamenttheory, which described muscle structure and proposed theories of contraction. Active muscle contraction involves the relative sliding between two sets of filaments in Abstract
The influence of the thermal environment on physiological processes and body temperature have been widely studied. Skeletal muscles are one of the tissues that are very sensitive to different thermal conditions. The temperature of muscle, especially in limbs, is frequently different than core temperature and fluctuates daily. For example, the resting muscle temperature of humans (core temperature 37°C) may vary from 29.4 to 34°C but may be increased to 40°C in the same muscle during activity [3]. The change in temperature between resting and working muscle has the potential to considerably alter the rate of contractile muscle properties and power outcomes. This review presents the current state of knowledge regarding the effect of temperature on properties of mammalian skeletal muscle contractions, specifically the biomechanical, metabolic, and neuromuscular aspects.
KEYWORDS: skeletal muscle, physiology, contraction, hypothermia, hyperthermia, metabolism.
a sarcomere (the thin, actin filaments and the thick, myosin filaments). The repetitive mechanical interaction of cross-bridges (myosin heads) on actin filaments are the biomechanical basics underlying muscle force generation. The cross-bridge attaches to the actin, changing the conformation and starting the muscle contraction, before they detach. This mechanical cycle is combined with an enzymatic reaction: hydrolysis of ATP by actomyosin and ATPase, release of phosphate
(Pi) and adenosine diphosphate (ADP), and liberation
of energy, which is converted into work and heat [14]. This mechanism is responsible for changes in muscle temperature during activity. The potential muscle elements featured in temperature changes are the biomechanical properties of soft tissue, biochemical properties of metabolism, and neuromuscular components. It is hard to divide all these components in independent research; however, some studies shed a light on these processes. Bits of knowledge about biomechanical properties of muscle tissue come from in vitro muscle experiments.
Non-contractile muscle fiber structures
For the most part, muscle experiments have been done in three functional and mechanical states: relaxed (or resting), rigor, and active state. The tension of a relaxed muscle is largely insensitive to temperature. In the relaxed state, the cross-bridges remain detached and force develops when stretching beyond the rest length. This tensile-resistance results from the stretch of non-cross-bridge structures in the sarcomere. However, stretched, relaxed muscle can develop a type of “elastic” force due to heat-contracture at higher temperatures
TRENDS IN SPORT SCIENCES
20 March 2020
MALAK
(30-40°C) [25]. In the rigor state, there is no ATP, all bridges are attached to actin (there is no cross-bridge cycle), and the muscle is stiff (after death, the muscle stays in the rigor state). As the temperature rises, force decreases slightly and linearly (exothermic process). In active muscle, cross-bridges attach to actin, develop force, and detach. The development of force, in this case, is very sensitive to temperature and increases with the absorption of heat (endothermic process) [24].
Muscle fibers are composed of two primary components, which are biomechanically distinct but structurally interconnected, called exo- and endosarcomeric lattices. Exosarcomeric lattices are a network of intermediate filaments that surround and interconnect myocyte organelles and sarcomeres with costamere and sarcolemma. The sarcomere, a basic unit of the contractile apparatus of striated muscle, are linked longitudinally to adjacent sarcomeres of the same myofibril by Z and M lines and radially to parallel myofibrils. On the other hand, an endosarcomeric lattice refers to extensible titin filaments, which attach between the M line region and the Z line, and inextensible nebulin, which runs along the thin actin filament [32, 33].
Previous findings have shown that elasticity characteristics of muscle fibers are more dependent on myofibrils than connective tissue [16]. Titin (connectin)-containing cap filaments were identified as a component of muscle fibers and are largely borne to resting tension [11, 13]. Titin is a protein connecting the myosin thick filament to the Z-disc in a sarcomere [19]. Maruyama et al. [18] showed that the isometric tension of isolated titin has a positive temperature coefficient. Furthermore, the resting tension of skinned fibers from a rat’s extensor digitorum longus muscle increased with warming, from 20°C to the highest physiological temperature (30- -40°C), and decreased with cooling, lowering back to the initial temperature. The reversibility of warming-cooling procedures was repeated until the temperature reached an upper limit of 43-45°C [25]. Summarizing the available evidence shows that the non-contractile endosarcomaric components, which build muscle cells, are temperature sensitive.
Relationship between length and resting tension
In general, mammalian muscles consist of two main types of muscle fibers: slow- and fast-twitch fibers. A rat’s soleus muscle is often used as an example of a slow-twitch muscle and the extensor digitorum longus is used as an example of a fast-twitch muscle for studies of muscle properties [7]. In one of the first studies of mammalian
muscle, Hill observed, in temperatures below 15°C, that rat muscle showed different characteristics than frog muscle [12]. The resting tension of the rat’s slow soleus muscle, at the optimal length, started to rise when temperatures decreased from 15°C to 10-8°C. At the lowest temperature, the resting tension was increased roughly four fold. The “cold tension” effect was very unpredictable and not reproducible below 2°C. The opposite effect was observed in the fast-twitch extensor digitorum longus muscle. Below 15°C, resting tension decreased and near 0°C resting tension was slightly increased. As a function of time (in 5-8 hour experiments), developed resting tension was always higher than at the beginning of experiments (20 g vs 100 g) [12]. These experiments revealed that fast and slow-twitch muscles have different passive effects during temperature changes.
Relationship between length and tetanic tension
One of the classical physiological properties of muscle is the length/tetanic tension relationship, which is another feature sensitive to changes in muscle temperature. This relationship describes the force produced by progressively increasing muscle or sarcomere length and has a characteristic reversed U-shape. In a rat’s short head of biceps brachii muscle (fast-twitch muscle), the largest force was developed when sarcomere length reached 2.2-2.5 µm and by 4.0 µm the tetanic tension was predicted to be 0. Interestingly, the U-shape of the length/tetanic tension curve was similar at both examined temperatures (27 and 15°C) [10]. Moreover, Elmubarak and Ranatunga [10] showed that cooling sensitivity (measured as a rate of change in muscle tension rise under change in temperature) for a short head of biceps brachii muscle increased below 23°C. A similar observation was noted in extensor digitorum longus and soleus muscles, where the temperature sensitivity rose below 25°C [26]. In conclusion, the experimental data demonstrated that the relationship between sarcomere length and tetanic tension does not change based on temperature.
Isometric twitch and tetanic contraction
The twitch is a single contraction of muscle in response to a single command (stimulus) from the nervous system. In physiological experiments, twitch contractions could be evoked by electrical stimulation delivered directly to muscle fibers, via a cut axon in the supplying nerve, or by the filament of the ventral roots containing axons of motoneurons. Furthermore, the isometric tetanic contraction (also called tetanus) is a sustained muscle
THE INFLUENCE OF TEMPERATURE ON FUNCTION OF MAMMALIAN SKELETAL MUSCLES
contraction evoked by a train of stimuli delivered at a high rate. Using these two kinds of muscle contractions researchers can describe basic characteristics of twitch (twitch force, contraction time, half relaxation time) and tetanus (plateau tension, maximum tetanic force, rate of tension development), as well as, a possible range of changes in the force, including the minimum and the maximum force, which can be modulated by changes in motoneuronal firing rate.
In female rats, the peak twitch tension and the isometric tetanic tension of intact soleus muscle decreased when the temperature dropped from 35 to 20°C, whereas in the extensor digitorum longus muscle the isometric tetanic tension decreased, but the maximum twitch tension increased 1.7 fold [8, 23]. Surprisingly, in the other fast-twitch muscle, short head of biceps brachii, the peak twitch tension rose 1.65 fold with cooling at the same temperatures [10]. The peak twitch tension for soleus muscle at 12, 8, and 4°C (compared to that at 22°C) was 74, 61, and 47%, respectively. This tension didn’t drop when exposure to cooling was prolonged, except when the temperature was decreased to 3°C. For example, cooling the soleus muscle from 21 to 3.8°C reduced tension to 29.5% after 1 minute, and 27.1, 24.8, and 23.2% after 2, 6, and 20 minutes, respectively. At 0.3°C, the peak twitch tension was reduced to 31.0, 17.1, and 6.2% after 1, 3, and 10 minutes, respectively [12]. The twitch time-to-peak, also called the twitch contraction time, was prolonged during cooling in both types of muscles, but consistent results could only be obtained above 3°C. It is worth it to mention that in the soleus muscles, twitches after cooling to 0.5°C could last up to 60 seconds. At physiological temperatures, the contraction time is 0.15 seconds in the soleus muscle and about 0.095 seconds in the short head of biceps brachii muscle [10, 12]. The prolonging of twitch contraction time was not associated with a delay in restoration of the normal membrane potential. In such a case, a second pulse applied during the twitch would produce a multiple mechanical response, which was observed [12].
The course of twitch relaxation is very important from a physiological point of view as it considerably influences summations of individual twitches into tetanic contractions. This process is crucial to produce force in unfused tetanic contractions, which are generated by muscle fibers during voluntary activity. Experimental data indicate that with cooling, retardation of the to-half relaxation was even longer than that of the
time-to-peak. The Q10 (temperature coefficient for the rate of
relaxation) was estimated to be 10, at a length of l0 +
1 mm (l0 is the length of the muscle during a maximal
isometric twitch – 1 mm), for twitches in soleus and extensor digitorum longus muscles at 4-14°C; whereas,
at length l0 + 3 mm, this coefficient was lower, 5.4 and
6.5 for soleus and extensor digitorum longus muscles, respectively [12]. Segal and Faulkner [29] investigated changes in peak twitch tension, time-to-peak twitch tension, twitch half relaxation time, the maximum rate of twitch tension development, and maximum tetanic tension at 20-40°C. In both muscles (soleus and extensor digitorum longus), there was a shorter time-to-peak twitch tension at higher temperatures. In comparison to the soleus muscle, the extensor digitorum longus muscle had a faster time-to-peak twitch tension at each temperature. The peak twitch tension for the soleus muscle did not vary with a range in temperature, but tension in the extensor digitorum longus muscle rose when the temperature increased [29].
Experimental data from skinned muscle fibers and intact muscle models showed with plateau tension (tetanic force), maximum rate of tension development, time to half-rise of tension, and time to half-relaxation of tension in isometric tetanus, that mammalian skeletal muscle’s temperature dependence was biphasic in nature between 10 and 36°C. There was an increase in cooling sensitivity for the rate of muscle tension rise at temperatures below the border temperature level (23-25°C) [26, 31]. When the extensor digitorum longus muscle was cooled from 35 to 10°C, a nearly 40% depression of tetanic tension occurred and after rewarming the tetanic tension was 10% less than tension was prior to cooling. Relative to the initial values, tetanic tension after rewarming was higher in the soleus muscle (104.0 ± 2.3%) than in the extensor digitorum longus muscle (91.2 ± 3.9%). This disparity in tension may have resulted from differences in fatigue resistance of muscle fibers. Most of the tetanic tension was recovered between 10 and 25°C in both muscles [22, 26]. The rate of tetanic tension development and time to half-relaxation of tetanic tension was also biphasic with cooling. The temperature sensitivity of the rate of tetanic tension development and half-relaxation of tetanic tension was more pronounced below 22°C in both muscles. However, at higher temperatures (24- -36°C), the rate of tetanic tension development was more temperature-sensitive in the soleus than extensor digitorum longus muscle [26].
Force-frequency curve
Two studies examined the dependence of force on the frequency of stimulation at a physiological (35°C) and reduced (25°C) temperature. Ranatunga [23] found that cooling shifted the steep part of the force-frequency