STUDIES IN PHYSICAL CULTURE AND TOURISM Vol. 17, No. 4, 2010
MARIUSZ NACZK, ALICJA NACZK, WIOLETTA BRZENCZEK-OWCZARZAK, JAROSŁAW ARLET, ZDZISŁAW ADACH
University School of Physical Education in Poznan, Branch Faculty of Physical Culture, Gorzów Wielkopolski, Poland
RELATIONSHIP BETWEEN MAXIMAL RATE OF FORCE DEVELOPMENT
AND MAXIMAL VOLUNTARY CONTRACTION
Key words: voluntary contraction, rate of force development.
ABSTRACT
The aim of this research was to examine relationships between the maximal rate of force development (MRFD) expressed in absolute and relative values and the maximal voluntary contraction (MVC) in the knee and elbow flexors and extensors. The sample consisted of thirty male PE students. Eight measuring sessions were performed using the BIODYNA dynamometer. During maximal isometric contraction of the knee and elbow flexors and extensors MVC and MRFD were recorded. The results showed that the relationship between MVC and MRFD is dependent on the expression of the MRFD. Regardless of the studied muscle group, there were significant correlations between MVC and MRFD [Nm/s]. When MRFD was expressed in relative values [%MVC/s] the relationships between its parameters were not significant. Due to the significant influence of the MVC level on MRFD expressed in absolute values, it may be more appropriate to use MRFD expressed in relative values for the assessment of muscle contractile properties.
INTRODUCTION
The rate of force development (RFD) and the level of maximal voluntary contraction (MVC) are highly significant in everyday life. Effective execution of rapid movements such as sudden stabilization of the body and protection against falls (particularly in the elderly) depends on the rate of force development [7]. The increase in the RFD as well as the level of MVC also play an important role in sports in which the time of movement performance is considerably shorter than the time needed to attain the MVC [11, 21, 23]. Aagaard et al. [3] claim that during sprint running, karate fighting or boxing the contraction time falls between 50 and 250 ms. Therefore, a high rate of force development may affect the sport result to
a greater extent than the MVC level. Nonetheless, both muscle strength and rate of force development are to some extent dependent on the same factors. Andersen and Aagaard [4], Demura et al. [9] and Izquierdo et al. [14] show that regardless of age, a significant correlation can be found between the RFD and MVC. Thus, it can be assumed that there is a high concurrency of the two parameters: achieving high values of MVC is associated with higher RFD values. However, Jaskólska et al. [17] showed that two groups of subjects who achieved significantly different maximal rates of force development (MRFD) can reach a similar level of MVC. Additionally, Mirkov et al. [19] noted that the muscle size and MVC [Nm] can be related to the RFD level [N/s]. These researchers also underline that the existence of this relationship may
Correspondence should be addressed to: Mariusz Naczk, Department of Physiology, Faculty of Physical Culture, Estkowskiego 13, 66-400 Gorzów Wlkp., Poland, tel: +48 957279173, e-mail: m.naczk@awf-gorzow.edu.pl
be dependent on the expression of RFD (in absolute or relative units). Besides, various authors have studied the relationship between RFD and MVC using a single muscle group. Moreover, the maximal rate of force development (MRFD) has been also used in many publications as an indicator of muscle contractile properties. Some authors express the maximal rate of force development in absolute terms, e.g. Andersen & Aagaard [4], De Ruiter et al. [8] and Bazett-Jones [5]; whereas others in relative terms, e.g. Aagaard et al. [3], Jaskólska et al. [16] and Naczk et al. [20].
The aim of the present study was to examine relationships between the maximal rate of force development expressed in absolute and relative values and the MVC level in the knee and elbow flexors and extensors.
METHODS
Subjects
Thirty male physical education students took part in the study. The subjects were physically active, which was connected with the specificity of their studies; however, none of them practised high-performance sports. The participants were healthy, and their health status was confirmed by a physician. All of them became acquainted with the methods and purpose of the experiment and expressed their written consent to participate in the research. The experiment had been approved by the Local Bioethics Board in Poznan (certificate 1744/03). During the study period the subjects were obliged to avoid stimulants, pharmaceutics and alcohol. The profile of the research sample is presented in Table 1.
Measuring device
The measurements were taken using the Biodyna dynamometer designed by the Institute of Aeronautics and Applied Mechanics of Warsaw University of Technology [18]. Force was measured in static conditions using tensometers connected to a computer allowing electronic analysis of force-time relationship. A force signal was analyzed at 1000 Hz, using an analog-to-digital converter (A-D77JE). The F-t curve was examined in 5-ms intervals. The dynamometer was calibrated at two lengths of lever arm with known weights (5, 10, 25, 50 and 100 kg). In a given range calibration was linear.
Measurement of the maximal voluntary contraction (MVC) and maximal rate of force development (MRFD)
The subjects were tested in a sitting position. Before each measurement the trunk and limbs were stabilized in order to prevent action of undesired muscle groups. During upper limb tests the arm was abducted at 90º from the trunk. The forearm, positioned in the transverse plane, was bent at a 90º angle in relation to the arm. In the case of the lower limb, the thigh was bent at 90º in relation to the trunk, and the shin also at 90º in the sagittal plane in relation to the thigh. Before the study the subjects participated in two pilot sessions, during which they learnt how to react properly to the examiner’s command and contract and relax muscles quickly. The command was: “Attention, after you hear the first beep, press against the lever using the highest possible force as quickly as possible and relax the muscles after the second beep”. After the pilot sessions, each student took part in eight measuring sessions, out of which two
Table 1. Characteristic of the students (n = 30)
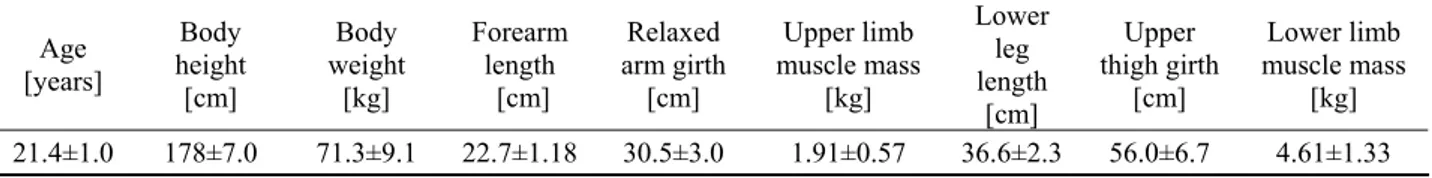
Age [years] Body height [cm] Body weight [kg] Forearm length [cm] Relaxed arm girth [cm] Upper limb muscle mass [kg] Lower leg length [cm] Upper thigh girth [cm] Lower limb muscle mass [kg] 21.4±1.0 178±7.0 71.3±9.1 22.7±1.18 30.5±3.0 1.91±0.57 36.6±2.3 56.0±6.7 4.61±1.33 302
measured the isometric contraction of the elbow flexors (EF), two elbow extensors (EE) two knee flexors (KF) and two knee extensors (KE). During each session, each subject developed and maintained the maximal isometric force five times for 2-3 sec. The intervals between the sessions lasted at least 48 hours, and 2 minutes between the consecutive measurements during a single session. The maximal voluntary contraction (MVC) and the maximal rate of the force development (MRFD) were recorded during each test. The average value from 10 results for each parameter of each muscle group was used for further analysis. MVC was expressed in absolute values [Nm], while MRFD in absolute [Nm/s] and relative values [%MVC/s].
Statistical methods
The results were subject to statistical analysis; mean values and standard deviations were calculated. A nonparametric Friedman test was used to calculate the significance of differences in MCV values, achieved by different muscle groups. The same methods were used for MRFD comparisons. To evaluate the strength of correlations between the analyzed parameters Spearman's rank correlation coefficients were calculated. The levels of statistical significance was set at p ≤ 0.05.
RESULTS
Table 2 shows all the obtained results. As expected, the MVC values attained by different muscle groups differed significantly. The highest MRFD value was achieved for the KE and much lower for the KF, EF and EE.
Table 2. Results obtained by tested muscle groups during maximal voluntary contraction
Muscle group MVC [Nm] [%MVC/s] MRFD MRFD [Nm/s]
EF 77.8 ± 15.4 1365 ± 536 1036 ± 395
EE 51.2 ± 12.9 1487 ± 677 754 ± 404
KF 114.9 ± 34.5 1013 ± 354 1218 ± 576
KE 193.6 ± 53.2 1083 ± 412 2050 ± 832
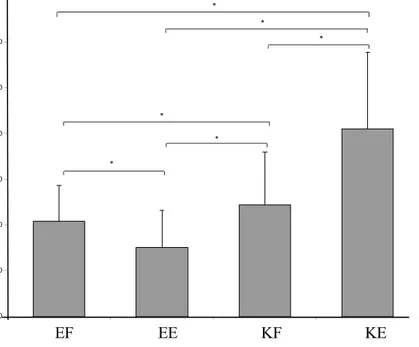
The maximal rate of force development expressed in absolute values was proportional to the size of the tested muscle groups. The highest rate of force development was recorded for the knee extensors, and the lowest for the elbow extensors. The MRFD levels reached during contractions of different muscle groups differed significantly (Fig. 1). However, the MRFD expressed in relative
0 500 1000 1500 2000 2500 3000 3500 MR F D [ N m] * * * * * * EF EE KF KE
Figure 1. MRFD level expressed in absolute values obtained during maximal voluntary contractions in studied muscle groups; * – p≤0.05
1 2 3 4 0 500 1000 1500 2000 2500 3000 MR F D [ % MV C /s ] EF EE KF KE * * * *
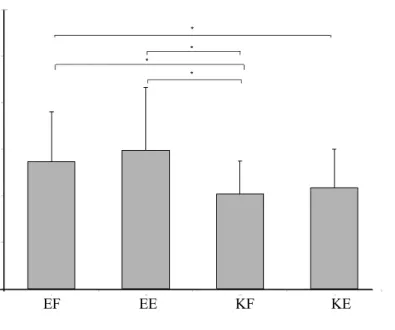
terms (%MVC/s) in the upper limb muscles was significantly higher as compared with the lower extremity (p ≤ 0.05) (Fig. 2).
In order to find the possible relationships between MVC and MRFD, correlation coefficients were calculated. In each of the tested muscle groups a significant correlation was revealed between MVC and MRFD expressed in absolute values. However, when the rate of force development was expressed in relative values the relationships between MVC and MRFD were statistically non-significant (Tab. 3).
DISCUSSION
Figure 2. MRFD level expressed in relative values obtained during maximal voluntary contractions in studied muscle groups;* – p ≤ 0.05
The results revealed non-significant correlations between MVC and MRFD [% MVC/s], regardless of the studied muscle group. This is surprising, especially that many factors determining the level of the maximal force also affect the rate of force development. One of these factors is the muscle fibers composition. Significant differences in the rate of force development in slow and fast twitch fibers have been shown during a single contraction, which may even vary two- or four-fold [6]. It was also noted that the cross-section muscle area not only had an influence on the MVC, but also on MRFD [2]. In addition, Aagaard et al. [1] and Harridge [13] observed that the greater content of heavy myosin chains positively influenced the level of maximal muscle strength, as well as the rate of force development. Both, the MVC level and the rate of force development also depend on the neural drive to the muscle [3, 10, 12].
Therefore, no relationship between the MVC and MRFD [% MVC/s] was found to be statisti-cally significant. However, when the MRFD obtained in this study was expressed in absolute values [Nm/s], the correlation between MRFD and MVC in each of the tested muscle groups was significant (r = 0.38-0.63). A significant relation-ship (r = 0.89) between the MVC [Nm] and the rate Table 3. Coefficients of correlation between the MVC
and MRFD in studied muscle groups
MVC [Nm] Parameter EF EF KF KE MRFD [%MVC/s] –0.32 –0.10 0.04 –0.23 MRFD [Nm/s] 0.48* 0.38* 0.63* 0.40* * – p ≤ 0.05 304
of force development (between 0 and 200 ms) [Nm/s] obtained during the isometric contraction of knee extensor muscles was also shown by Andersen and Aagaard [4]. Similar relationships between the MVC and MRFD were noted by Jaskólska [15] in her examination of finger flexors (r = 0.57). Thus, the occurrence of the relationship between the MRFD and MVC can be conditioned by the way the MRFD is expressed. Mirkov et al. [19] argue that the changes of RFD due to training, muscle fatigue or age (adolescence, old age), often accompany proportional changes in the level of muscle strength. Therefore, the increase/decrease of the RFD in absolute values may be due to the increase/decrease in the level of maximal strength. In addition, Aagaard et al. [3] showed that with strength training, the RFD expressed in absolute values increased in each of four time intervals described by the authors (0-30 ms, 0-50 ms, 0-100 ms and 0-200 ms); and when the RFD was expressed in relative values, its increase occurred only in the earliest interval. Indirectly, this may indicate that the increasing rate of force development [Nm/s] in the other time intervals was mainly affected by increasing levels of MVC. Moreover, Runnels et al. [22] showed that the MVC development time in muscles with different mass and MVC level was similar. If, during maximal voluntary contraction, recruitment of more fibers in large muscles and fewer fibers in smaller muscles occurs more or less simultaneously, the MVC level will determine the slope force, i.e. the time curve and MRFD level expressed in absolute values. Considering the above it should be remembered that the MVC level (especially in large muscles) can significantly influence the rate of force development expressed in N/s or Nm/s. If the MVC level is one of the main factors influencing the value of MRFD the significant correlations found between these parameters expressed in absolute units are hardly surprising.
The above correlations suggest that a MRFD analysis of the contractile properties of muscles with different cross-section area and weight is justified with the use of relative units. This may be important in sports selection of children and adolescents as well as in training control. Often, environmental conditions, lifestyle, physical activity, etc., may affect both the MVC and MRFD [N/s] of different muscle groups, which does not necessarily translate into the force-velocity capacity of tested subjects.
Expressing the rate of force development in relative values may prevent drawing misleading conclusions. It definitely requires further research; however, it can be a useful tool in sport practice. The following conclusions can be therefore drawn: 1. The relationship between MVC and MRFD
depends on the expression of the RFD. Regardless of the studied muscle group, significant relationships between MVC and MRFD [Nm/s] can be observed. When the rate of force development was expressed in relative values [%MVC/s] the relationship between its parameters was not significant.
2. Due to the significant influence of the MVC level on MRFD expressed in absolute values, it may be more appropriate to use MRFD expressed in relative values in the assessment of muscle contractile properties.
REFERENCES
[1] Aagaard P., Andersen J.L., Correlation between contractile strength and myosin heavy chain isoform composition in human skeletal muscle, Medicine & Science in Sports & Exercise, 1998, 30, 8: 1217-1222.
[2] Aagaard P., Thorstensson A., Neuromuscular aspects of exercise adaptive responses evoked by strength training, (in:) M. Kjær eds., Textbook of sport medicine. Blackwell, London, 2003, 70-106. [3] Aagaard P., Simonsen E.B., Andersen J.L.,
Magnusson P., Dyhre-Poulsen P., Increased rate of force development and neural drive of human skeletal muscle following resistance training, Journal of Applied Physiology, 2002, 93, 4: 1318--1326.
[4] Andersen L.L., Aagaard P., Influence of maximal muscle strength and intrinsic muscle contractile properties on contractile rate of force development, European Journal of Applied Physiology, 2006, 96: 46-52.
[5] Bazett-Jones D.M., Effect of Potentiation and Stretching on Maximal Force, Rate of Force Development, and Range of Motion, Journal of Undergraduate Research, 2003, 6: 1-7.
[6] Burke R.E., Motor units anatomy, physiology, and functional organization, (in:) L.D. Peachy ed., Handbook of Physiology. Sec. 10. Skeletal muscle, The American Physiological Society, Bethesda 1983, 345-422.
[7] Chang S.H., Mercer V.S., Giuliani C.A., Sloane P.D., Relationship between hip abductor rate of force
development and mediolateral stability in older adults, Archives of Physical Medicine and Rehabilitation, 2005, 86, 9: 1843-1850.
[8] De Ruiter C.J., Kooistra R.D., Paalman M.I., de Haan A., Initial phase of maximal voluntary and electrically stimulated knee extension torque development at different knee angles, Journal of Applied Physiology, 2004, 97, 5: 1693-1701. [9] Demura S., Yamaji S., Nagasawa Y., Minami M.,
Kita I., Examination of force-production properties during static explosive grip based on force-time curve parameters, Perceptual and Motor Skills, 2000, 91, 3 Pt 2: 1209-1220.
[10] Grimby L., Hannerz J., Hedman B., The fatigue and voluntary discharge properties of single motor units in man, The Journal of Physiology, 1981, 316: 545-554.
[11] Haff G.G., Carlock J.M., Hartman M.J., Kilgore J.L., Kawamori N., Jackson J.R., et al, Force-time curve characteristics of dynamic and isometric muscle actions of elite women Olympic weightlifters, The Journal of Strength & Conditioning Research, 2005, 4: 741-748.
[12] Häkkinen K., Alen M., Komi P.V., Changes in isometric force- and relaxation-time, electro-myographic and muscle fibre characteristics of human skeletal muscle during strength training and detraining, Acta Physiologica Scandinavica, 1985, 125: 573-585.
[13] Harridge S.D.R., The muscle contractile system and its adaptation to training. Medicine and Sport Science, 1996, 41: 82-94.
[14] Izquierdo M., Ibanez J., Gorostiaga E., Garrues M., Zuniga A., Anton A., et al., Maximal strength and power characteristics in isometric and dynamic actions of the upper and lower extremities in middle-aged and older men. Acta Physiologica Scandinavica, 1999, 167: 57-68.
[15] Jaskólska A. (1998) Przebieg zmian narastania siły i relaksacji u ludzi po wysiłkach o różnej cha-rakterystyce (Changes of force development and relaxation in humans after exercise of different characteristics). Monografia nr 326, AWF Poznań.
[16] Jaskólska A., Kisiel-Sajewicz K., Brzenczek W., Marusiak J., Kawczyński A., Jaskólski A., Speed of force development of knee flexors and extensors in the ovulatory and luteal phases of the menstrual cycle. Human Movement, 2004, 5, 135-141.
[17] Jaskólska A., Naczk M., Adach Z., Kisiel K., Brzenczek W., Jaskólski A. The influence of muscle contractile properties on force development and relaxation during maximal voluntary contraction. Physical Education and Sport, 2003, 1: 45-56.
[18] Kędzior K., Kotwicki E., Niwiński W. Testing module for static and dynamic measurements of muscle group characteristic, (in:) B. Jonsson, ed., Biomechanics X-B, Human Kinetics, 1987 Champaign, pp. 1127-1130.
[19] Mirkov D.M., Nedeljkovic A., Milanovic S., Jaric S., Muscle strength testing: evaluation of tests of explosive force production, European Journal of Applied Physiology, 2004, 91, 2-3: 147-154. [20] Naczk M., Adach Z., Brzenczek-Owczarzak W.,
Comparison of rate of force development of elbow and knee flexors, Human Movement, 2007 8, 2: 120-123.
[21] Paasuke M., Ereline J., Gapeyeva H., Knee extension strength and vertical jumping performance in Nordic combined athletes. Journal of Sports Medicine and Physical Fitness, 2001, 41, 3: 354-361.
[22] Runnels E.D., Bemben D.A., Anderson M.A., Bemben M.G., Influence of age on isometric, isotonic, and isokinetic force production characteristics in men, Journal of Geriatric Physical Therapy, 2005, 28, 3: 74-84.
[23] Stone M.H., Sands W.A., Carlock J., Callan S., Dickie D., Daigle K., Cotton J., Smith S.L., Hartman M., The importance of isometric maximum strength and peak rate-of-force development in sprint cycling, Journal of Strength and Conditioning Research, 2004, 18, 4: 878-884.