Comparative analysis of fitness level of 13-15-year-old training girls from Poznań
8
0
0
Pełen tekst
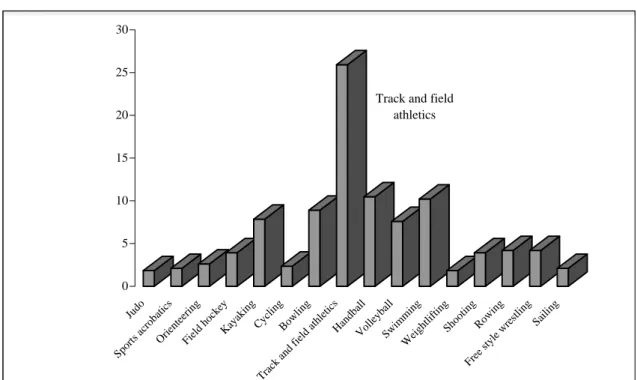
(2) Beata Pluta, Iwona Kiełbasiewicz-Drozdowska. both the somatic build and the results achieved in all eight tests. Consequently, it can be stated that the training girls from Poznań feature a significantly higher level of physical fitness with reference to the so-called empirical norm of physical fitness of Polish adolescents in the same age bracket. The results of the study allowed a hierarchical ordering of the examined sports in terms of their influence on the general motor development of adolescents.. METHODS The study with the use of the International Physical Fitness Test was performed between July and September 2005. It was performed on the sample middle-school girls, members of regional sports teams, practicing 16 sports: judo, sports acrobatics, orienteering race, field hockey, kayaking, cycling, bowling, track and field, handball, volleyball, swimming, weightlifting, shooting, rowing, free style wrestling and sailing. 382 girls aged 13-15 years were examined in total. The study results show (Fig. 1) that the quantitative distribution of subjects according to their age was fairly homogeneous; most of them were at the age of 14 (38.74%).. While analyzing the quantitative representation of female athletes in particular sports (Fig. 2), it should be noticed that the most numerous was the group of track and field athletes (25.92%), followed by volleyball players (10.47%) and swimmers (10.21%). The least numerous were the groups of judokas and weightlifters (1.83% in each group, respectively). The International Physical Fitness Test is a collection of tasks allowing the quantitative assessment of the general fitness level of adolescents. It evaluates fitness on the basis of the level of development of particular skills and merit-. 13 years 29.32%. 15 years 31.94% 14 years 38.74%. Figure 1. Subjects’ age range distribution (in percent). 30. 25. 20. Track and field athletics. 15. 10. 5. Sp or ts. Ju do ac ro ba O rie tics nt ee Fi rin el g d ho ck ey K ay ak in g Cy Tr c ac l i n k an Bo g d fie wli n ld at g hl et i H cs an db al V l ol le yb Sw all im m W in ei g gh tli fti n Sh g oo tin Fr g ee Ro sty w in le g w re stl in g Sa ili ng. 0. Figure 2. Quantitative distribution of the studied female athletes according to the type of sport. 78.
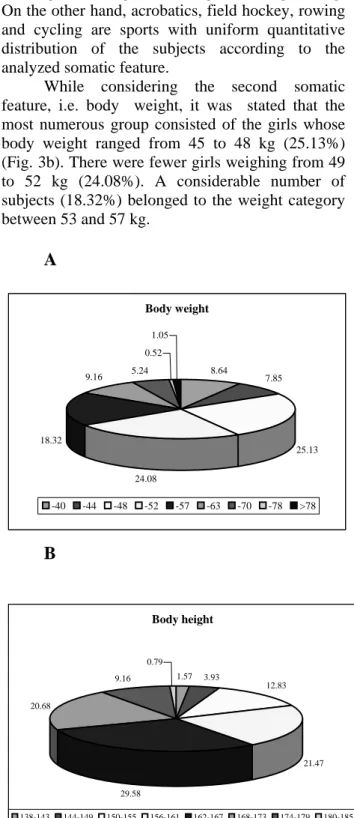
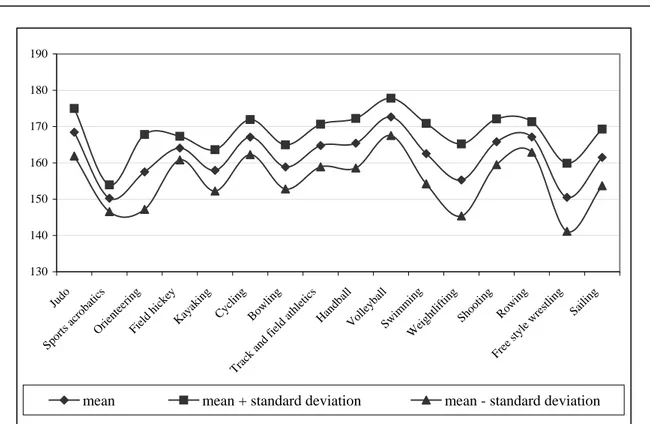
(3) Comparative analysis of fitness level of 13-15-year-old training girls from Poznań. related features. It consists of eight subsequent tests: 1. 50-meter dash; 2. standing long jump; 3. running races: 1. 600 m race – girls and boys under 11 years of age; 2. 800 m race – girls at the age of 12 and above; 3. 1000 m race – boys at the age of 12 and above; 4. hand grip strength test; 5. relative strength test: a) flexed-arm hang – girls from all age groups and boys at the age of 11 years and under; b) pulling up from the hanging down position on the horizontal bar – boys at the age of 12 and above; 6. shuttle run 4 x 10 meters; 7. sit-ups from a lying position preformed within 30 seconds; 8. standing forward bend. The advisable sequence of the tests is as follows: on the first day the fitness level in tests 1-3 should be assessed. On day two, the remaining tests should be performed. All tests can also be performed during one day, but in such a case test 3 (strength run) should be performed as the last one.. x display a relatively large dispersion of the values of the analyzed feature in the case of orienteering, bowling, wrestling, swimming and weightlifting. On the other hand, acrobatics, field hockey, rowing and cycling are sports with uniform quantitative distribution of the subjects according to the analyzed somatic feature. While considering the second somatic feature, i.e. body weight, it was stated that the most numerous group consisted of the girls whose body weight ranged from 45 to 48 kg (25.13%) (Fig. 3b). There were fewer girls weighing from 49 to 52 kg (24.08%). A considerable number of subjects (18.32%) belonged to the weight category between 53 and 57 kg.. A Body weight 1.05 0.52 8.64. 5.24. 9.16. 7.85. 18.32 25.13 24.08. -40. -44. -48. -52. -57. -63. -70. -78. >78. RESULTS In the studied sample the largest group was constituted by athletes whose body height fell between 162 and 167 centimeters (29.58%). The subsequent body height ranges were: 156–161 centimeters (21.47%) and 168–173 centimeters (20.68%). It can be concluded that in more than 70% of the studied middle-school girls their body height fell between 156 and 173 centimeters. The smallest were the groups of girls taller than 180 centimeters (0.79%) and shorter than 143 centimeters (1.57%) (Fig. 3a). The tallest female athletes practiced handball (2.5%), track and field (1.01%) and judo (14.29%). The shortest subjects were wrestlers (31.25%) and orienteers (10%). In the group of the studied sports the greatest quantitative differentiation due to body height was noticed in swimming, track and field, handball and bowling, which is presented in a profile diagram (Fig. 4) showing the degree of the symmetry of quantity distribution in particular sub-classes (sports). Profile lines x+s and x–s distant from line. B. Body height. 0.79 9.16. 1.57. 3.93 12.83. 20.68. 21.47 29.58 138-143. 144-149. 150-155. 156-161. 162-167. 168-173. 174-179. 180-185. Figure 3. Quantitative distribution of the examined middle-school girls in given body height (A) and body weight ranges (B). 79.
(4) Beata Pluta, Iwona Kiełbasiewicz-Drozdowska. 190 180 170 160 150 140. Sa ili ng. Sp or ts. Ju do ac ro ba tic O s rie nt ee rin Fi g el d hi ck ey K ay ak in g Cy c lin Tr g ac k B an ow d lin fie g ld at hl et ic s H an db al l V ol le yb al l Sw im m W in g ei gh tli fti ng Sh oo tin g Fr Ro ee w sty in le g w re stl in g. 130. mean. mean + standard deviation. mean - standard deviation. Figure 4. Profile diagram of the subjects’ body height. 75 70 65 60 55 50 45 40 35. Sa ili ng. Sp or ts. Ju do. ac ro ba tic O s rie nt ee rin Fi g el d hi ck ey K ay ak in g Cy cl Tr in g ac k B an ow d lin fie g ld at hl et ic s H an db al l V ol le yb al l Sw im m W in g ei gh tli fti ng Sh oo tin g Fr Ro ee w sty in le g w re stl in g. 30. mean. mean + standard deviation. mean - standard deviation. Figure 5. Profile diagram of the subjects’ body weight. Only a few girls were in the category from 71 to 78 kg (0.52%) and above 78 kg (1.05%). It can be stated then that most of the studied girls (nearly 70%) were in the body weight range between 45 and 57 kg.. 80. The lightest competitors (under 40 kg) practiced acrobatics (87.5%), wrestling (43.75%), bowling (17.65%) and sailing (12.5%) (Fig. 5). The subjects featuring the heaviest body weight (above 78 kg) practiced weightlifting (14.29%), shooting (6.67%) and rowing (6.25%). Acrobatics turned out.
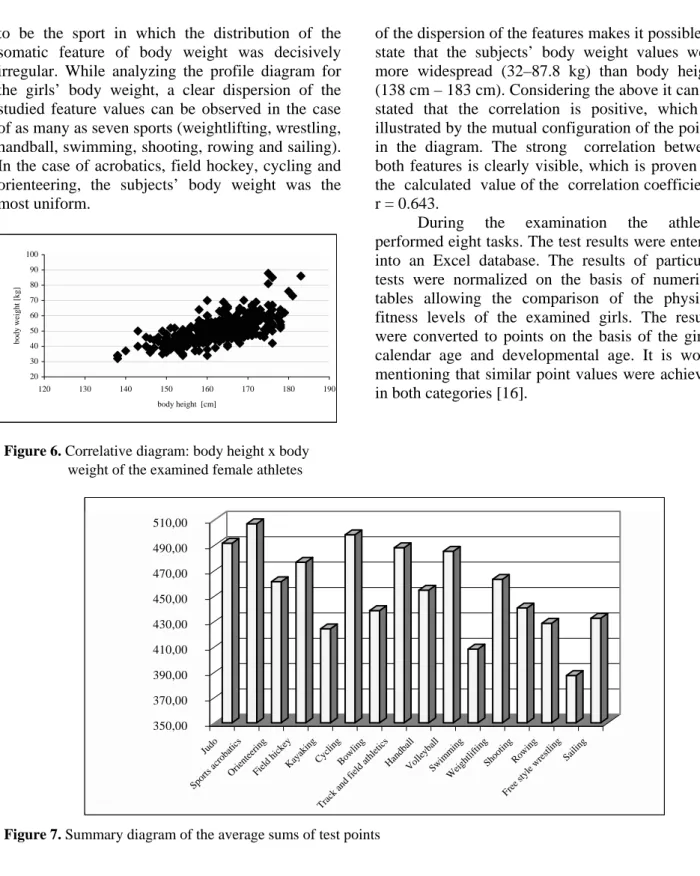
(5) Comparative analysis of fitness level of 13-15-year-old training girls from Poznań. to be the sport in which the distribution of the somatic feature of body weight was decisively irregular. While analyzing the profile diagram for the girls’ body weight, a clear dispersion of the studied feature values can be observed in the case of as many as seven sports (weightlifting, wrestling, handball, swimming, shooting, rowing and sailing). In the case of acrobatics, field hockey, cycling and orienteering, the subjects’ body weight was the most uniform. 100. body weight [kg]. 90 80 70 60 50 40 30 20 120. 130. 140. 150. 160. 170. 180. 190. body height [cm]. of the dispersion of the features makes it possible to state that the subjects’ body weight values were more widespread (32–87.8 kg) than body height (138 cm – 183 cm). Considering the above it can be stated that the correlation is positive, which is illustrated by the mutual configuration of the points in the diagram. The strong correlation between both features is clearly visible, which is proven by the calculated value of the correlation coefficient: r = 0.643. During the examination the athletes performed eight tasks. The test results were entered into an Excel database. The results of particular tests were normalized on the basis of numerical tables allowing the comparison of the physical fitness levels of the examined girls. The results were converted to points on the basis of the girls’ calendar age and developmental age. It is worth mentioning that similar point values were achieved in both categories [16].. Figure 6. Correlative diagram: body height x body weight of the examined female athletes. 510,00 490,00 470,00 450,00 430,00 410,00 390,00 370,00. Sp. or ts. ac r. Ju do ob a O rie tics nt e Fi erin el g d hi ck ey K ay ak in g Cy Tr cl ac in k an Bo g d fi e wl in ld g at hl et ic s H an db a V ll ol le y Sw ball im m W in ei g gh tli fti ng Sh oo tin Fr g ee Ro sty w in le g w re stl in g Sa ili ng. 350,00. Figure 7. Summary diagram of the average sums of test points. In order to estimate the correlations between the analyzed somatic features a correlation diagram was drawn. Figure 6 illustrates the tendency for the distribution of features around the area concentrated along the diagonal of the graph, which provides evidence for a strong correlation between the examined features. The length of the rectangle sides. The average sums of points achieved during the test ranged from 387.25 to 506.75. The best result was achieved by the acrobats. It should be noticed, however, that the middle-school girls practicing acrobatics actually approach the end of their careers. In their case the specialization takes place very early, and they start their careers much 81.
(6) Beata Pluta, Iwona Kiełbasiewicz-Drozdowska. earlier in comparison with athletes of other sports. The worst results were achieved by the wrestlers (Fig. 7, Table 1).. Table 1. Average sums of test points sports orienteering field hockey acrobatics points 491.43 506.75 461.20 476.47 sport handball volleyball swimming weightlifting points 454.43 485.10 408.08 463.00 track and sport kayaking cycling bowling field points 424.03 498.11 438.35 487.93 free style sport shooting rowing sailing wrestling points 440.47 428.38 387.25 432.38 sport. judo. In order to assess the general fitness level of the examined girls, the so-called average state of overall physical fitness was calculated by dividing the amount of scored points by the number of performed tests. The results are presented in Table 2.. studied age range: wrestling (free style); swimming; kayaking; rowing; bowling; shooting; handball; orienteering race; weightlifting; field hockey; volleyball; track and field athletics; judo; cycling; acrobatics. The analysis of these results allows determining possible, statistically significant differences between the results, with regard to the practiced sport. The hypothesis was formulated that the type of sport practiced by the subjects did not influence their overall fitness level measured by the above mentioned test. To verify this hypothesis, a single factor variance analysis was applied. Following the calculation of F = 1. 95 > 1.76 (critical value from the tables), the hypothesis at the given level of significance of α = 0.05 should be rejected. It can be stated then that there are significant differences in the overall fitness level with regard to the type of sport practiced by the middle-school girls. Further research with the use of multiple comparisons method enabled the researchers to conclude that two of the examined sports, i.e. wrestling and acrobatics, were responsible for the rejection of the formulated hypothesis. Table 3. One-way analysis of variance. Table 2. Average state of overall physical fitness sport points sport points sport points sport points. sports orienteering field hockey judo acrobatics 61.43 63.34 57.65 59.56 handball volleyball swimming weightlifting 56.80 60.64 51.01 57.88 kayaking cycling bowling track and field 53.00 62.26 54.79 60.99 free style sailing shooting rowing wrestling 55.06 53.55 48.41 54.05. On the basis of data from Table 2, an increasing sequence of mean percentage sums of points achieved in the International Physical Fitness Test by the subjects can be constructed: 48.41; 51.01; 53.00; 53.55; 54.05; 54.79; 55.06; 56.80; 57.65; 57.88; 59.56; 60.64; 60.99; 61.43; 62.26; 63.34. It is also possible to construct a hierarchical classification of sports according to their influence on the physical fitness level of athletes in the 82. Source of variance Between groups Within groups Total. SS 2234.63 8545.78 10780.4. df. MS. F. 15 148.98 1.95 112 76.30 127. Value - p Test F 0.025. 1.76. DISCUSSION The study examined the condition of physical fitness development among training middle-school girls from Poznan. The fitness examination was composed by the measurements of two somatic features indicating the process of growth and the results of a locomotor test, showing the physical level of the girls under examination. The calculated parameters of somatic and motor development have been commonly accepted and regarded as health measures for the young generation [1, 3, 21, 29]. Research into this subject has had a long tradition in Poland dating back to the 19th century (Dudrewicz, Suligowski, Kosmowski, ĆwirkoGodycki, Wolański) [11]. Such a long history of.
(7) Comparative analysis of fitness level of 13-15-year-old training girls from Poznań. research into children’s and adolescents’ physical development is indicative of the permanent need for its further conduct, perpetual analysis and searching for ways of efficient creation of the optimal model profile of a young human being. The assessment of the physical fitness of Polish youth from different social environments has been systematically carried out by researchers in order to diagnose the adaptability changes occurring at the young age [10, 12, 16, 22, 23, 24, 25, 26, 28]. The results of the present study show that the level of physical fitness of Polish children, measured by means of basic somatic features and signs of pubescence corresponds to the results from other European countries. The mentioned authors have been supporters of diverse concepts of physical fitness, mainly motor, mechanical-biological, and physiological-medical. The comparison of the results of the evaluation of the physical fitness level of young Poles from different social environments requires application of a number of diversified measurements and methods. The tests utilized for the needs of the evaluation of motor achievements are commonly used for comparative analysis of youth fitness and for monitoring of the secular trends in different countries [14]. Also the results of the research concerning the youth declaring physical activity within the area of professional sport can be helpful. The comparison of the results of the present study with the results of nationwide studies enables us to see the regional and environmental diversifications of the physical fitness level of middle-school students [6, 11, 18, 30]. Moreover, the comparison of the results achieved by training middle-school girls from Poznań with their nontraining peers with the aid of an analysis of mean values of the diagnostic and classification features, allows presentation of the differences in measurable (quantitative) values and estimating the degree of the influence of sports activity on the level of motor development. This is possible because the population of Polish adolescents can be regarded as genetically homogeneous, much more than in other European countries [9, 18]. In order to conduct the comparative analysis of chosen somatic features of the examined athletes, a system of cross-classification was used: Di (X), Di (Y), i = 1, 2, 3..., 16, where: D – sport type, X – body height, Y – body weight. In this classification, variants (levels) for each considered feature were given, gaining as many possible combinations as is the total number of levels of all. the features. The results are graphically presented in the form of profile, pie charts, and a correlative diagrams (Fig. 6) for features X and Y. It can be stated that the quantitative distribution of the examined girls with regard to their body height and body weight was heterogeneous; the kind of practiced sport determined the value of diagnostic features, and already in female athletes aged 13-15 years the diversification was clearly visible. Sports characterized by uniformity with regard to the two examined somatic features were acrobatics, field hockey and cycling; whereas wrestling and weightlifting were sports featuring the highest differentiation. The results achieved by the subjects in particular tests allowed a hierarchical classification of the analyzed sports, taking into consideration their influence on the development of the general fitness level of girls in the studied age range. The present study is a pilot study. The authors realize there is a need to carry out further research on a larger population of young athletes practicing different sports in different social environments and regions of the country.. REFERENCES [1] Bielicki T., Secular trends in growth; human biologists’ contribution to the understanding of social change, (in:) F.E. Johnson, B. Zemel, P.B. Eveleth, eds., Smith-Gordon, Chapter 26, London 1999. [2] Brewer J., Ramsbottom R., Williams C., Multistage fitness test, Loughborough University, 1988. [3] Cackowski Z., Cztery warstwy ciała ludzkiego (Four layers of a human body), (in:) J. Kopczyński, A. Siciński, eds., Człowiek – Środowisko – Zdrowie (Man – Environment – Health), Ossolineum, Warszawa 1990. [4] Clark H.H., Application of Health Assessment in Physical Education, (in:) J. Drabik Sprawność fizyczna i jej testowanie u młodzieży szkolnej (Physical fitness and its testing in school youth), AWF Gdańsk 1992. [5] Denisiuk L., Milicerowa H., Rozwój sprawności motorycznej dzieci i młodzieży w wieku szkolnym (Motor fitness development of children and adolescents at the school age), PZWS, Warszawa 1969. [6] Denisiuk L., Tabele punktacji sprawności fizycznej (Score tables of physical fitness), Wydawnictwa Szkolne i Pedagogiczne, Warszawa 1995.. 83.
(8) Beata Pluta, Iwona Kiełbasiewicz-Drozdowska. [7] Fardy P., Physical activity and teenage health program, Hillcrest High School, Path Program, New York 1988. [8] Grabowski H., Szopa J., Eurofit. Europejski test sprawności fizycznej (Eurofit. European Physical Fitness Test), AWF Kraków 1991. [9] Gronkiewicz L., Różnice społeczne w cechach biologicznych ludności Polski (Social differences in biological features of Polish population), Monografie Zakładu Antropologii PAN no. 14, Wrocław 1996. [10] Malina R.M., Bouchard C., Growth, maturation and physical activity, Human Kinetics Books, Champaign, Il. 1991. [11] Mydlarski J., Sprawność fizyczna młodzieży w Polsce (Physical fitness of youth in Poland), Przegląd Fizjologii Ruchu (Physiology of Movement Review), Warszawa 1934. [12] Osiński W., Zmiany niektórych parametrów morfologicznych i zdolności motorycznych u dzieci poznańskich na przestrzeni lat (Changes of some morphological parameters and motor skills at Poznan children over the years), Roczniki Naukowe AWF Poznań, 1989, 38: 9-30. [13] Osiński W., Wachowski E., Test sprawności fizycznej dzieci i młodzieży YMCA (Physical Fitness Test of YMCA children and youth), AWF Poznań 1994. [14] Osiński W., Antropomotoryka, AWF Poznań 2003. [15] Pilicz S., Pomiar ogólnej sprawności motorycznej (Measurement of general physical fitness), Monografie AWF Warszawa 1997. [16] Pilicz S., ed., Punktacja sprawności fizycznej młodzieży polskiej – wg Międzynarodowego Testu Sprawności Fizycznej (Physical Fitness Score Tables of Polish Youth), Studia i monografie no. 94, AWF Warszawa 2005. [17] Przewęda R., Trześniowski R., Sprawność fizyczna polskiej młodzieży w świetle badań z 1989 (Physical fitness of Polish youth on the basis of 1989 studies), Studia i monografie, AWF Warszawa 1996. [18] Przewęda R., Dobosz J., Kondycja fizyczna polskiej młodzieży (Physical state of Polish youth), Studia i monografie AWF Warszawa, 19, 2003. [19] Raczek J., Młynarski W., Koordynacyjne zdolności motoryczne dzieci i młodzieży. Struktura wewnętrzna i zmienność osobnicza (Coordinative motor skills of children and adolescents. Internal structure and individual changeability), AWF Katowice 1998.. 84. [20] Starosta W., Znaczenie aktywności w zachowaniu i polepszaniu zdrowia człowieka (Significance of activity in the behavior and improvement of human health), Lider, Warszawa 1997. [21] Strzelczyk R., Uwarunkowania rozwoju ruchowego dzieci wiejskich (Conditions for motor development of rural children), Monografia no. 324, AWF Poznań 1995. [22] Strzelczyk R., Rozwój fizyczny i sprawność fizyczna dzieci wiejskich na tle rówieśników z miasta. Przegląd badań (Physical development and physical fitness of rural children as compared with their urban peers. Research review), Monografia no. 184, AWF Poznań 1990. [23] Stupnicki R., Milde K., Przewęda R., Constricting growth reference curves, Papers of Anthropology, 2001, 10: 268-279. [24] Szopa J., Żak S., Zmiany sprawności fizycznej dzieci i młodzieży Krakowa w latach 1974–1983 na tle trendu sekularnego wysokości ciała (Changes in physical fitness of Krakow children and youth in the years 1974–1983 on the background of secular trend of body height), Wychowanie Fizyczne i Sport, 1986, 1: 39-53. [25] Trzcińska D., Rozwój i sprawność fizyczna dzieci i młodzieży z regionów o różnym stopniu skażenia środowiska (Development and physical fitness of children and youth from the regions with different degrees of environmental pollution), doctoral thesis, AWF Warszawa 2002. [26] Trześniowski R., Rozwój fizyczny i sprawność fizyczna młodzieży szkolne w Polsce (Physical development and physical fitness of school youth in Poland), AWF Warszawa 1999. [27] Winiarski R.W., Aktywność sportowa młodzieży. Geneza – struktura – uwarunkowania (Sports activity of the youth. Origin – structure – conditions), Monografia no. 66, AWF Kraków 1995. [28] Woynarowska B., Metody oceny wydolności fizycznej ogólnej u dzieci i młodzieży (Assessment methods of general fitness efficiency of children and adolescents), Ministerstwo Oświaty i Wychowania, Warszawa 1980. [29] Zagórski J., Skład A., Uwarunkowania rozwoju dzieci i młodzieży wiejskiej (Conditions for development of rural children and adolescents), Instytut Medycyny Wsi, Lublin 2003. [30] Zuchora K., Indeks Sprawności Fizycznej (Physical Fitness Index), ZG SZS, Warszawa 1985..
(9)
Obraz
Powiązane dokumenty
Por these mixes flow stability tests at 70°C and a slope of 1.85 to 1 have also been carried out, which Indicate that there is only a very little flow after several days for
The results of the sensitivity analysis of the partial equilibrium model of the Polish power system confirmed that the model correctly responds to enforced changes in initially
‘measured’ values of curvatures conventionally assigned the mid–points of two neighboring segments with the curvatures values forecasted in the points by use of
In MATLAB, was created programs for 4 points, multiple points and differential lock-in method, which were used to process data from the numerical simulation.. These
The opposite positive direction of horizontal coor- dinate of Aiming Point graph (from top to bottom) with regard to corresponding numeric coordinate in a text file and to the scene
Aan de plaats van de vitrines in de ruimte te zien lag de verzamelprioriteit van Watson bij de bouwstenen en niet bij de decoratieve stenen: de vitrines voor de marmers en
Starting with the process of forming the boundaries of that territory and its functional transformations in time, from the city’s foundation to the beginning of the period
Following the present interpretation, phase I and II of Poznan may be related to the 1st bottom forest period by W.Szafer which 'bears the character of forest where
