THE SUPPORT OF ANALYSIS OF LEVEL FOR
CUS-TOMER SERVICE BY NETWORK VISUALIZATION
Łukasz Brzeziński*, Marta C. Kliber** and Magdalena K. Wyrwicka***
* doctoral student at the Faculty of Engineering Management, Poznan University of Technology, Poznan 60-965, Poland, Email: lbrzezinski@o2.pl ** doctoral student at the Faculty of Engineering Management, Poznan University
of Technology, Poznan 60-965, Poland, Email: martakliber@interia.pl *** Faculty of Engineering Management, Poznan University of Technology, Poznan
60-965, Poland, Email: magdalena.wyrwicka@put.poznan.pl
Abstract The concept of network in economic sciences is generally referenced to companies connecting into a network (and related to the effects of this phenomenon) than to the relationship between the elements in organizations, which are shaping such a network (and the result of such approach). Occurring today dynamic and unexpected market changes enforce a special data presentation, so that based on them decision-making in the company will be resulted on their absorption or appropriate deformation of management system. The aim of the article is to use the visualization network to analyze the level of customer service and improve achieved indicator values of service in the selected company of the pharmaceutical industry. The tool for analysis and visualization was program Pajek by Vladimir Batagejl and Andrei Mrvar. For the most important results of the study should be included a positive opinion on the suitability of network visualizations (and their characteristics as the value of belonging and vector) for solving these types of problems.
Paper type: Research Paper Published online: 29 January 2016
Vol. 6, No. 1, pp. 25-38 ISSN 2083-4942 (Print) ISSN 2083-4950 (Online)
© 2016 Poznan University of Technology. All rights reserved.
1. INTRODUCTION
Importance of customer service was seen in 1980. Has been observed that in the era of general access to high-quality goods and services at similar prices, but only well-organized customer service is able to pay the customer's attention for a prod-uct in a clear and durable way.
Client is an individual person or legal entity making the purchase of a product in-tended for a sale and after the payment acquiring the title of his property. It can be said that the most important customer is the end user of a physical good, that is entity to whom the product is finally intended previously produced, stored and moved as load. From a logistical point of view the end-user suggests destination of the char-ge, specifies delivery dates and takes title to the goods (Cyplik, Głowacka & Fertsch, 2008, pp. 10-23).
Customer service is the picture of the functioning of the whole logistics system in the enterprise and is the result of actions undertaken in the areas of marketing, fi-nance, warehousing, transportation, demand forecasting and orders (Walasek, 2014, pp. 281-282). Through the customer service should be understood as implementation of mutually coordinated logistics activities or services affecting on the customer sat-isfaction when is the product is purchased, which is the last act of the process that generally starts with ordering and ends with delivery of the product to the customer (Kempny, 2001, p. 15). J.J. Coyle determines customer service as a fuel, by which the motor of the logistics chain is driven (Coyle, Bardi & Langley, 1996, pp. 102). On the other hand D.M. Lambert, customer service management classifies among the eight most important management processes of the integrated logistics chain (Rutkowski, 2005, s.111). Additionally customer service is the main concept of modern logistics (Halicka & Święcka 2012, p. 212).
In recent years, in the one of the biggest bestsellers in the field of management "In Search of Excellence", the authors drew the attention of managers (and not only) that sales are growing thanks to the buyers, and companies which achieve the greatest success are those which have the most clients and which can maintain them with them. In a situation when is increasingly difficult to maintain a competi-tive advantage through the product, it is the customer service represents a distin-guishing feature of the company's offer against competitors offer (Barcik, 2012, p. 1). The dominance of supply on the market means that the strength of trade-marks is reducing, as the technologies used for production are undergoing to the unification. By this for the average purchaser is increasingly difficult to capture the significant differences between them. Therefore, if the client has to do with two products of a similar appearance and application, that the determining factors for his election may be the price or perceived image of the company. Thus, both the products market and the services, increasingly success is dependent on what level of service is offered by the company (Rosa & Sondej, 1999).
Customer support is a broad term that can be considered as an important carrier values through: a concept of shaping the relationships with the customer, the sys-tem of direct and indirect contacts with the client, a set of specific functions and activities in the enterprise, a set of decisions designating the usefulness of the time and place of the product, the flow system of streams of goods, information and capital to the client, part of the distribution system, integrated marketing processes and logistic (Dembińska-Cyran, Hołub-Iwan & Perenc, 2004, pp. 36-37).
In practice, customer service is about understanding who the client is, what he thinks and feels ,what irritates him or annoys, and what satisfies, what are his expectations and needs, and on finding the best way to satisfy them. That means that the modern understanding of customer service, also includes the entire process of building relationships with the client, leading to long-term relationship and part-nership (Sobczak-Matysiak, 1997, p. 7).
The comprehensive customer service program should include three groups of elements: pre-trade – aimed at preparation of the organization for customer sup-port, transactional – for direct contact between the customer and the company and smooth running of the transactions in accordance with his requirements and the post-trade – which allows the organization for the further contact with the client (Halicka & Święcka, 2012, p. 213).
Therefore, the customer service includes all of three phases of the process of modern commercial exchange. The elements of the first phase – before the trans-action - includes company policy in a range of preparation for the start of the cus-tomer service process, which are not directly connected with logistics. This is specif-ically specified policy of service, which is known to customers and adapted to estab-lishment of policies and ensuring the flexibility of the system – organizational struc-ture. Elements of the second phase – transactional – refers to forms of activity of the company with the direct involvement in the implementation of physical distribu-tion, and thus the availability of goods which client requests, time and accuracy of delivery, ensure the quick and efficient communication. Grouped elements in the third phase – post-trade – activities which supports the product during its use (re-pair, post-warranty service, delivery of consumables and spare parts, complaints procedures, etc.) (Kozerska, 2010, p. 1555).
The high level of quality conducive to achieving the objectives which are: re-duction of inventory costs and reducing the additional costs of transport and stor-age related to handling of returns. That is the basis for the development of long-term cooperation, during which it is possible organizational and technical integra-tion of logistics systems of partners. Besides, related to the improving the quality of the products, increase their value conducive to achieving the objectives of im-proving customer logistics service (Kozerska, 2010, p. 1555).
Customer service is too important and too costly to be left to chance. Effective customer service requires thought and consistently applied approach (Christopher, 2000, p. 51).
Proper realization of these elements of customer service affect on the long-term and positive relationships with the customer (Brzeziński, Kliber & Wyrwicka, 2013, pp. 120-124). That is why the authors analyzed the level of customer service in Customer Service Department in the selected company of the pharmaceutical industry, which has been detaily described in the next section
2. ANALYSIS OF THE LEVEL OF CUSTOMER SERVICE
IN CHOSEN COMPANY
2.1. Indicators of customer service in the selected enterprise
Nowadays, more and more companies maintains contact with customers by using hotline, and therefore customer orders are handled by customer service departments mostly by phone with the support of ICT systems.
One of the companies from the pharmaceutical industry in Poland has in its struc-ture Customer Service Department, where employees, in particular, are serving the contractors by telephone. The main tasks of the so-called telephone operators or consultants in Customer Service Department can be divided into two main areas:
• handling of incoming calls from customers - is 60% of the work time, • handling outgoing calls to the clients - is 20% of the work time. Incoming calls are related to the following activities, performed by operators:
• providing information to customers, about. prices, order status, delivery hours, etc.,
• receiving orders from customers, • receiving complaints.
On the other hand, outgoing calls, emanating from the Customer Service Depart-ment employee are associated with:
• market research and marketing studies, • maintaining relationships with customers, • sale by phone,
• clarification of the reported complaints.
In all departments of customer service managed the quality and are conducting analysis about efficiency of telephone consultants. In order to ensure the highest quality in the process of customer service, it should use the indicators which al-lows, in fast way to validate the actions. Therefore, in the Customer Service De-partment at the selected pharmaceutical enterprise are cyclically monitored follow-ing indicators:
• Availability for customers – the percentage of the amount of calls answered by operators in relation to all incoming calls (the expected value minimum 90%);
• Customer waiting for connection – them percentage of customers who have been connected with the operator within 15 seconds in relation to all clients connecting to the hotline (the expected value minimum 80%); • Complaints – the percentage of erroneous orders in relation to all orders
reveived by operators (the expected value maximum 1%);
• Customer registration time – the time of account creation process in a sys-tem in order to possibility of submitting and order processing (the expected value maximum 4 days).
In table 1 have been presented values of above-defined indicators of customer service in the Customer Service Department at the selected enterprise in the period from January 2014 until May 2015.
Table 1 Indicators and their average values in the period from January 2014 to May 2015
Indicator Value
Availability for customers 93%
Availability for customers – min. expected value 90%
Customer waiting for connection 78%
Customer waiting for connection – min. expected value 80%
Complaints 0,68%
Complaints – max. expected value 1,00%
Customer registration time [days] 4,2 days
Customer registration time [days] – max. expected value 4 days
Two indicators in the analyzed period reached an average value below the ex-pected: a customer waiting for connection – the actual value 78%, expected – 80%, customer registration time – the actual value 4,2 days, while the expected 4 days. Therefore, in case of indicator – customer waiting for connection, its value was too low, and in relation to customer registration time, it was too long.
Due to the fact that in terms of selected indicators of customer service, the ex-pected values does not in all cases have been achieved, attempt was made to devel-op of the conception of improving the level of customer service.
2.2. Identification of determinants of customer service indicators
in the chosen company
This article is part of experimental studies concerning the use of the program – Pajek as an auxiliary tool in creating the concept of solutions to specific problems in the enterprise, based on relational connections between the staff and other re-sources available in the organization (Brzeziński & Wyrwicka, 2015).
In order to identify factors affecting on the level of customer service in the se-lected enterprise, authors considered it is reasonable to use network visualization as a support for analysis aimed at improving the achieved values selected indica-tors: availability for the customer, the customer waiting for connection, complaints and customer registration time. For analysis and visualization was used program – Pajek, developed by Vladimir Batagejl and Andrei Mrvar (Program, 2015), through which it is possible to reflection of the relationship and interaction between de-partments, employees, their activities, processes, resources, tangible and intangible, and environment organizations, etc.
The survey was conducted in Customer Service Department in the selected enterprise in the pharmaceutical industry. The research sample represented 5 people
(everyone employed in one of the Teams). Method for obtaining of the research
material was a diagnostic survey, interview by using the form where respondents were asked about factors that may affect on the achieved values of indicators of customer service. Additionally was determined the strength of these relationships on a scale of 1-10 (where 1 – very low, and 10 – very high).
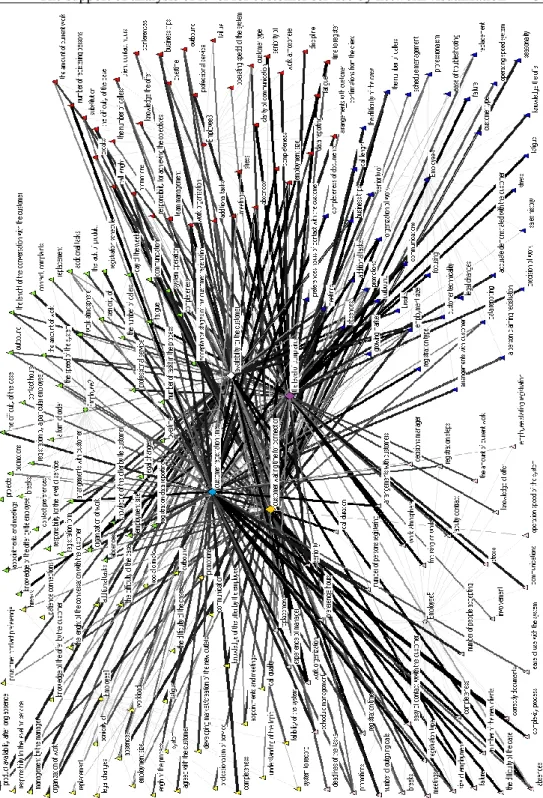
As a result of the conducted research of staff from Customer Service Department were determined factors that may affect on the level of customer service and network of their connections has been illustrated on Fig. 1.
Designations to Fig. 1.: Employee 1 – yellow circle – his response as yellow triangles; Employee 2 – green circle – his response as green triangles; Employee 3 – red circle – his answers as red triangles; Employee 4 – blue circle – his answers as blue triangles and Employee 5 – pink circle – his answers as pink triangles. Indicators are located in the center of the network: the level of complaints (purple diamond), the availability for the customer (white diamond), customer waiting for connection (orange diamond) and customer registration time (blue diamond).
The thickness of the lines between the different elements of the network determines the strength of the relationship and the thicker, the stronger influence. The aim of selecting of factors which are important for the final value of customer service indicators, the authors have chosen to analyze two parameters: the value of the mediation and the value of the vector, which the determination enables to program Pajek. The value of the mediation indicates the probability with which a each given factor is crucial for the formation – in this case – a measure of customer service (calculated on the basis of all connections in the network, and values sum up to unity). If higher the value of mediation, then can point for the increasing importance of a given factor. Whereas the value of vector defines the impact of the factor on the indicator in this study is in the range of 1-10. If higher value of the vector, then his impact on the indicator is higher.
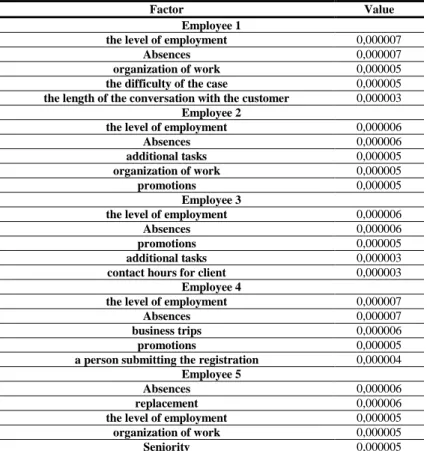
Factors with the highest value of mediation are presented in Table 2. Injunctions of Employee 1 of the highest mediation value is the amount of emp-loyment (0,000007), absences (0,000007), work organization (0,000005) the diffi-culty of the case (0,000005) and the length of the conversation with the customer (0,000003). Then, in terms of the Employee 2, of the highest value of mediation also was characterized by employment size (0,0000006), absences (0,000006), additional tasks (0,000005), work organization (0,000005) and promotions (0,000005).
Table 2 The highest values of mediation for factors
Factor Value
Employee 1
the level of employment 0,000007
Absences 0,000007
organization of work 0,000005
the difficulty of the case 0,000005
the length of the conversation with the customer 0,000003
Employee 2
the level of employment 0,000006
Absences 0,000006
additional tasks 0,000005
organization of work 0,000005
promotions 0,000005
Employee 3
the level of employment 0,000006
Absences 0,000006
promotions 0,000005
additional tasks 0,000003
contact hours for client 0,000003
Employee 4
the level of employment 0,000007
Absences 0,000007
business trips 0,000006
promotions 0,000005
a person submitting the registration 0,000004
Employee 5
Absences 0,000006
replacement 0,000006
the level of employment 0,000005
organization of work 0,000005
Seniority 0,000005
In the replies of employee 3 the highest values of mediation were: the size of employment (0.000006), absences (0.000006), promotions (0.000005), additional tasks (0,000003), and customer contact hours (0,000003). Replies of the Employee 4 with the highest of mediation level were: the size of the employment (0,000007), absences (0,000007), business trips (0,000006), promotions (0,000005) and a person submitting the registration (0,000004).
With regard to the response of the last respondent – Employee 5, the highest values of the mediation were: absences (0,000006), substitution (0,000006), employment
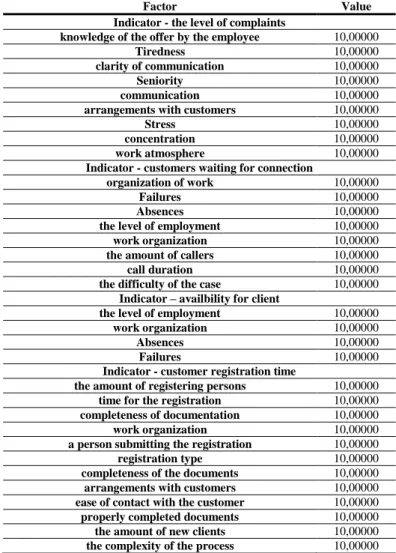
(0,000005), work organization (0,000005) and seniority (0,000005). Three factors were repeated in the indications of the respondents, therefore, they can be summed up. The cumulated mediation value for the number of employees is 0,000031 and 0,000032 for absences, work organization 0,000015. These three factors can be defined as crucial. Next aspect of the connection network analysis is to determine the vectors of the factors with regard to customer service indicators. Summary of factors with the highest value of vector presents Table 3.
Table 3 The highest values of vectors of factors
Factor Value
Indicator - the level of complaints
knowledge of the offer by the employee 10,00000
Tiredness 10,00000
clarity of communication 10,00000
Seniority 10,00000
communication 10,00000
arrangements with customers 10,00000
Stress 10,00000
concentration 10,00000
work atmosphere 10,00000
Indicator - customers waiting for connection
organization of work 10,00000
Failures 10,00000
Absences 10,00000
the level of employment 10,00000
work organization 10,00000
the amount of callers 10,00000
call duration 10,00000
the difficulty of the case 10,00000
Indicator – availbility for client
the level of employment 10,00000
work organization 10,00000
Absences 10,00000
Failures 10,00000
Indicator - customer registration time
the amount of registering persons 10,00000
time for the registration 10,00000
completeness of documentation 10,00000
work organization 10,00000
a person submitting the registration 10,00000
registration type 10,00000
completeness of the documents 10,00000
arrangements with customers 10,00000
ease of contact with the customer 10,00000
properly completed documents 10,00000
the amount of new clients 10,00000
the complexity of the process 10,00000
Referring to the indicators, whose level was below the minimum expected value that in terms of index of customer waiting for connection (actual value 78%, and the expected minimum 80%) to the factors with the highest value of vector (10,00000)
were included failures, organization of work, absences, employment, number of cal-lers, call duration and difficulty of the case. However, in case of indicator for the customer registration time (the actual value 4,2 days, and the expected value maximum 4 days) factors with the highest value of vector are: the complexity of the process, the amount of new clients, properly completed documents, the ease of con-tact with the customer, arrangements with the customer, the type of registration, completeness of the documents, a person submitting the registration, work orga-nization, the number of registrants and time for registration.
2.3. The concept of improving the level of customer service in a selected
enterprise
Based on analysis of the level for customer service in Customer Service Department in the selected enterprise, from the pharmaceutical industry, authors concluded a problem associated with the lack of values realization of two indicators: the customer waiting for connection and the customer registration time.
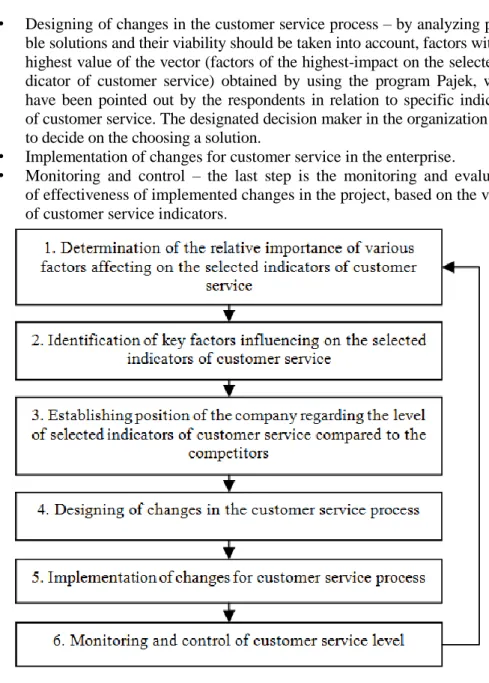
Development of optimal customer service solutions requires an analysis according to the scheme presented on Fig. 2:
• Determination of the relative importance of various factors affecting on the selected indicators of customer service – identified factors with the highest level of mediation (significantly deviating from the other network elements). These are absences (value 0,000032), next – employment size (0,000031) and organization of work (0,000015).
• Identification of key factors influencing on the selected indicators of custo-mer service – based on research has been distinguished three factors: absen-ces, employment and work organization. It is recommended to carry out in-depth interviews with employees and identify the causes of absences. This phenomenon follows mainly from the stress, experienced by employees (Bodzioch, 2015). Therefore, it is reasonable that managers in the company supported the subordinates in dealing with the pressure of of office by or-ganizing training, establishing regular breaks for employees, optimized work organization and building positive relationships in the team. The importance is in that case also strengthen the motivation. Instead of punishing the for the absence, should be implemented rewards for attendance. They don't al-ways have to be of a financial nature, it is important that the employee have to feel appreciated. The next two factors as employment and work organiza-tion are connected. Employment of another employee is the cost, but in that case should be carried out additional analysis of appropriateness of creating a new workplace.
• Establishing position of the company regarding the level of selected indicators of customer service compared to competitors.
• Designing of changes in the customer service process – by analyzing possi-ble solutions and their viability should be taken into account, factors with the highest value of the vector (factors of the highest-impact on the selected in-dicator of customer service) obtained by using the program Pajek, which have been pointed out by the respondents in relation to specific indicators of customer service. The designated decision maker in the organization must to decide on the choosing a solution.
• Implementation of changes for customer service in the enterprise.
• Monitoring and control – the last step is the monitoring and evaluation of effectiveness of implemented changes in the project, based on the values of customer service indicators.
Fig. 2 The Improving loop of customer service level
• A similar analysis worth to carried out every quarter, especially in case of not reaching by the Customer Service Department of expected values of selected indicators, with the criteria of empirical research as: formulation of the research problem, define the variables, formulation of research hypothesis, the selection of people to the research and the study area, preparation of research procedure,
conducting proper research, statistical description of the obtained results, the testing research hypothesis and the introduction of final results of the study (Brzeziński, Kliber & Wyrwicka, 2015, pp. 163-179).
3. CONCLUSION
The considerations contained in this article were aimed at the possibility of us-ing network visualization, as support to analysis of the reasons of not reachus-ing the expected values of indicators of customer service in Customer Service Depart-ment in the selected company of pharmaceutical industry.
It should be noted that the network visualizations contributed to the identifica-tion the causes of the problem, which is the first stage of the concept of level im-provement of customer service (Fig. 2).
In the opinion of the authors network visualizations can be used for solving this kind of problems in the organization. Particularly useful are the characteristics: membership and the vector strength. The first describes the probability that a particu-lar factor can be crucial for the formation of values of the index, while the vector indicates the strength of interaction. Based on this can be selected the elements which in the first step have to be modified. The disadvantage of this approach is more time-consuming, which is related to the development of the dependence network.
Dependence network analysis has allowed not only describe the facts, but also to identify the factors on which, in particular, should influence in order to ensure the highest level of customer service. With this knowledge, the company will be able to ensure customer satisfaction with the service which will contribute to con-tracted long-term and positive relationships with him.
REFERENCES
Barcik R., (2012), Znaczenie obsługi klienta w logistyce, Logistyka No. 4, pp. 1. Beier F.J. & Rutkowski K., (2001), Logistyka, Wyd. SGH, Warszawa.
Bodzioch K., (2015), Zarządzanie absencją pracowników, available at: http://hrstandard .pl/2011/09/29/zarzadzanie-absencja-pracownikow/ (accessed 30 july 2015). Bozarth C., & Handfield R.B., (2007), Wprowadzenie do zarządzania operacjami i
łańcichem dostaw, Helion, Gliwice.
Brzeziński Ł., Kliber M.C. & Wyrwicka M.K., (2013), Zarządzanie klimatem społecznym w przedsiębiorstwie z branży logistycznej, Gospodarka Magazynowa i Logistyka No. 11, pp. 120-124.
Brzeziński Ł., Kliber M.C. & Wyrwicka M.K., (2015), Social climate management in enterprises, Research in Logistics & Production, No. 2, pp. 163-179.
Brzeziński Ł. & Wyrwicka M.K., (2015), Wykorzystanie wizualizacji sieciowej do stymulacji wzrostu przedsiębiorstwa, Kiełtyka L., Niedbał R. (Eds.), Wybrane
zastosowania technologii informacyjnych wspomagających zarządzanie w organi-zacjach, Wydawnictwo Politechniki Częstochowskiej, Częstochowa.
Christopher M., (2000), Logistyka i zarządzania łańcuchem dostaw, Polskie Centrium Doradztwa Logistycznego, Warszawa.
Christopher M. & Peck H., (2005), Logistyka marketingowa, Wyd. PWE, Warszawa. Coyle J.J., Bardi E.J. & Langley Jr. C. J., (1996), The management of Bussiness Logistics,
Wyd. West Publishing Company, New York.
Cyplik P., Głowacka D. & Fertsch M., (2008), Logistyka przedsiębiorstw dystrybucyjnych, Wyższa Szkoła Logistyki, Poznań.
Dembińska-Cyran I., Hołub-Iwan J. & Perenc J., (2004), Zarządzania relacjami z klientem, Difin, Warszawa.
Fechner I., (2007), Zarządzanie łańcuchem dostaw, Wyd. Wyższej Szkoły Logistyki, Poznań. Fertsch M., (2006), Słownik terminologii logistycznej, Biblioteka Logistyka, Poznań. Halicka K.. & Święcka S., (2012), Economy and Management, Logistyczna obsługa klienta
na przykładzie wybranych firm, No. 3, pp. 212-225.
Kempny D., (2001), Logistyczna obsługa klienta, PWE, Warszawa.
Kempny D., (2009), Obsługa klienta jako podstawa konkurencyjności firm w łańcuchach dostaw, Kisperska-Moroń D., Krzyżaniak S. (Eds.), Logistyka, Biblioteka Logisty-ka, Poznań.
Kozerska M., (2010), Logistyka, Logistyczna obsługa klienta jako imperatyw działania w łańcuchu dostaw (Cz. I), No. 3, pp. 1553-1564.
Program for Large Network Analysis, (2015), available at: http://vlado.fmf.uni-lj.si/pub/networks/pajek/ (accessed 7 july 2015).
Rosa G. & Sondej T., (1999), Zarządzanie łańcuchem dostaw, materiały konferencyjne Logistic, tom. II.
Sobczak-Matysiak J., (1997), Psycholgia kontaktu z klientem, Wyd. Wyższej Szkoły Bankowej, Poznań.
Walasek J., (2014), Logistyczna obsługa klienta na przykładzie operatora logistycznego, Zeszyty Naukowe Politechniki Śląskiej seria Transport, Vol. 82, No. 1903, pp. 282-290.
BIOGRAPHICAL NOTES
Magdalena Krystyna Wyrwicka, PhD, DSc is an associate professor and a dean at the Faculty of Engineering Management at Poznan University of Technology in Poland. As a PhD in technical sciences (her work applied to implementation of automation), she has studied the issues of human resource management and small and medium size enterprises’ management at the Witschaftsuniversität in Vienna which constituted the basis for her postdoctoral degree in the scope of management science and it centred on a range of problems connected with organizing an enterprise’s development. She is a licensed teacher of German REFA (Verband fϋr Arbeits-gestaltung, Betriebsorganisation und Unternehmensentwicklung) in the elementary scope and production planning and control. She is in contact with economic practice. She is an author and a co-author of more than 180 publications. Her scientific research concentrates on premises concerning the development of a company and companies’ networks. Since October she has been managing a project called “Foresight
‘Wielkopolska’s Economic Networks’ – scenarios of knowledge transformations supporting an innovative economy” in the scope of an Operational Programme of an Innovative Economy. A project’s realisation is scheduled till the end of 2011. Marta Cypriana Kliber, M.Sc., is a doctoral student at the Faculty of Engineering Management of Poznan University of Technology. A graduate of the Management and Marketing course (specializing in Business Management) at the Poznan Univer-sity of Technology, Faculty of Informatics and Management. Engineering Diploma work concerned the development of admission procedures for new employees, which were implemented in the studied company. Master's Diploma thesis was the analysis of social climate in the selected enterprise and its impact on comfort and satisfaction of employees. Her research are related to the phenomenon of the social climate. She is author and co-author of several publications related to issues of human resource management, organizational culture and social climate. She keeps close relationships with business practice.
Łukasz Brzeziński, M.Sc., is doctoral student in Faculty of Engineering Manage-ment in Poznan University of Technology. Graduate of postgraduate studies also Fa-culty of Engineering Management in Poznan University of Technology. He concerns such research areas as: enterprises development, outsourcing of sales forces and logistics. He is professionally connected with problematic aspects of management in sale department and sales network development of business market in corporation.