METHODOLOGY FOR DETERMINING MACHINE
QUALITY POINTS. CASE STUDY
Adrian Wojciechowski
Faculty of Engineering Management, Poznan University of Technology, Strzelecka 11, 60-965, Poznan, Poland, E-mail: adrian.r.wojciechowski@doctorate.put.poznan.pl
Abstract: The article addresses issues related to quality assurance in manufacturing companies based on the guidelines of quality maintenance pillar under the Total Productive Maintenance concept. The first part of the article presents the methodological steps for determining machine quality points. The second part contains a case study on the implementation of methodology in the manufacturing plant in the lighting industry. The article shows a positive influence of the methodology on the reduction of quality defects in the examined plant.
Paper type: Research Paper Published online: 25 July 2018
Vol. 8, No. 3, pp. 263–274
DOI: 10.21008/j.2083-4950.2018.8.3.6 ISSN 2083-4942 (Print)
ISSN 2083-4950 (Online)
© 2018 Poznan University of Technology. All rights reserved.
Keywords: machine quality points, Total Productive Maintenance, quality assurance,
1. INTRODUCTION
Quality assurance is the fundamental process that determines the company’s position on the market and that influences its competitiveness. Production plants in their operating practice use a wide range of quality assurance techniques, which are very well described in the literature of the subject. These include methods, such as: quality function development (QFD), failure mode and effects analysis (FMEA), designing of experiments (DOE), statistical process control (SPC) and many others. One of the quality maintenance tools, which is described in the literature of the subject at a very slight level, includes the machine quality points, in particular the methodology of their designation. There are also few examples presenting the implementation of machine quality points by manufacturing companies. The topic also seems little known in the operating practice of manufacturing factories. Therefore, the problem of determining machine quality points is worth presenting. The article is addressed primarily to practitioners dealing with quality assurance in manufacturing companies and to the researchers analysing the subject of quality.
The aim of the article is to present the methodology for defining machine quality points based on the Total Productive Maintenance (TPM) concept. It also includes a case study on the implementation of quality points in a manufacturing company. The first part of the article shows the author’s motivation, purpose and structure of the work. The second chapter contains the literature overview on the subject matter of determining machine quality points, based on the Total Productive Maintenance concept. Part three shows the appropriate steps of the methodology for determining machine quality points. The fourth part is the case study of the implementation of quality points to the factory manufacturing components in the lighting industry. The last chapter includes the summary and conclusions, showing the positive effect of the implementation of machine quality points on the level of defects in the examined enterprise. It also presents suggestions for future directions of research related to this topic.
2. LITERATURE REVIEW
The methodology for determining machine quality points derives from the Total Productive Maintenance concept. At the root of TPM philosophy lies the premise of striving for zero quality losses, zero breakdowns, zero accidents (Nakajima, 1988, p. 15). One of the pillars of the TPM concept is the pillar of quality maintenance. Japan Institute of Plant Maintenance defines the objectives of the quality mainte-nance pillar as the creation of conditions that prevent the occurrence of defects in the production system and the control of these conditions in order to reduce defects (TPM Encyclopaedia, 2007, p. 147). In this sense, machine quality points can be
defined as inspection points that have the greatest impact on the quality of manufacturing in the production process.
The literature on the relationship and mutual relations between quality assurance and the Total Productive Maintenance concept distinguishes two notions. The first one are the items that describe the meaning, purpose and impact on the quality assurance of the TPM concept in general in terms of maintaining the machinery park. These are usually academic textbooks and items that comprehensively address quality issues (Bhote & Bhote, 2000, pp. 32–34; Hamrol, 2007, p. 89; Hamrol, 2015, pp. 257–259, Krishnamoorthi & Ram Krishnamoorthi, 2011, pp. 499–500; Pająk, 2013, pp. 175–191). The second notion are items, usually in the literature of Japanese authors, that accurately describe the assumptions and functioning of the Total Productive Maintenance approach taking into account the quality maintenance pillar. Suzuki illustrates the importance and examples of using the QA quality assurance matrix in relation to process inputs in the form of 4M (man, machine, method, material) and machine components (Suzuki, 1994, pp. 244–257). Another tool that has roots in the TPM concept is the QM quality maintenance matrix, which defines the requirements in the context of maintaining machines in relation with appropriate manufacturing process steps and quality defects (Yoshida et al., 1990, pp. 169–186; May & Schimek, 2014, pp. 70–72).
This paper will present the methodology for defining machine quality points, adapted to the needs of the examined company, resulting from its production practices and based on the main postulates of the quality maintenance pillar of the TPM concept.
3. METHODOLOGY FOR DETERMINING QUALITY POINTS
3.1. QA matrix
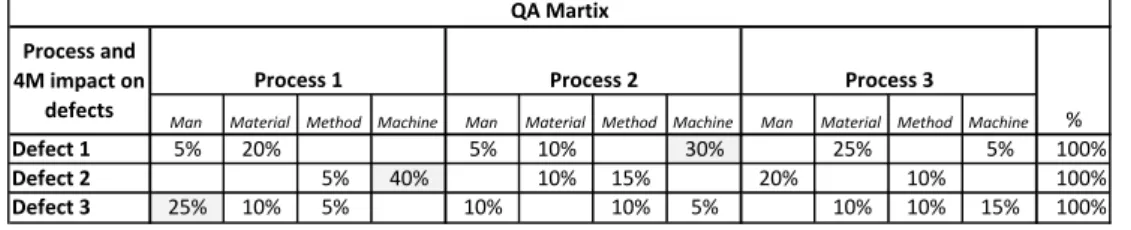
The starting point in the method for determining machine quality points is the formation of the QA matrix. The main goal of the QA matrix is to show the relationship between the dominant types of quality defects and the steps of produ-ction process with the division into process inputs in the form of 4M (man, material, machine, method). An example of the QA matrix based on the theoretical production process was presented in Figure 1. In the QA matrix, we assign appropriate quality defects to their creation sources in the division into individual steps of the production process including the process inputs, which have major effects on them. Then, the magnitude of the impact of 4M factors on the defects is estimated. As a rule, the impact assessment is carried out by an expert team, composed of specialists, who have the best knowledge of the production process. It is essential that the expert team is composed of representatives of the various functions of the company, such as:
production, quality, maintenance, development, shopping, etc. Such composition of the team minimises the possibility of subjectivism and making errors. In the QA matrix on Figure 1, the largest impact on the formation of defect 1 comes from the machine factor in process no. 2. Its impact was set at 30%. On the other hand, for defect 2 and 3 these are, respectively, the machine factor in process no. 1 (40%) and the human factor in process no. 1 (25%). The purpose of the decomposition of the factors that affect the formation of defects is not the precise determination of their impact, but the identification of the most important factors, under the Pareto principle. This, in turn, influences the narrowing of the area of future improve-ments and favours the efficient disposal of the company’s resources.
Man Material Method Machine Man Material Method Machine Man Material Method Machine
Defect 1 5% 20% 5% 10% 30% 25% 5% 100%
Defect 2 5% 40% 10% 15% 20% 10% 100%
Defect 3 25% 10% 5% 10% 10% 5% 10% 10% 15% 100%
Process 1 Process 2 Process 3
Process and 4M impact on
defects
QA Martix
%
Fig. 1. An example of the QA matrix; own study
The impact of individual inputs to the process on the defects may be expressed in the monetary form based on the cost losses incurred by the company as a result of the manufacturing of nonconforming quality products. The results of the QA matrix can also be presented as a Pareto graph. The result of the QA matrix in the context of determining quality points, is the identification of dominant quality defects, which formation sources are associated with the machine factor in the particular production process. This will constitute the entrance to the next step of methodology, that is the preparation of the QX matrix.
3.2. QX matrix
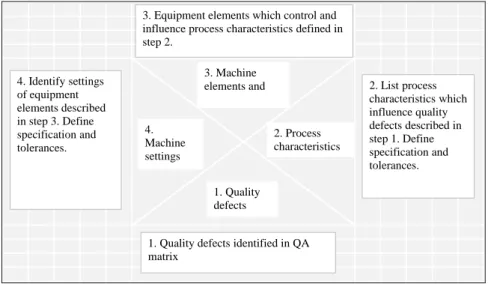
The next step of the methodology for determining quality points is the formation of the QX matrix. This is an extremely important step of the method-logy, as the correctness of its creation affects the performance of quality points. Just like in the first step, it is largely based on the expertise of the team members. The input to the process of determining the QX matrix is the result of the first step of methodology in the form of the type of the dominant quality defect, which creation sources can be attributed to the machine functioning. Then, the relations between the defect and the process characteristics which affect the defects are defined. In this step it is worth emphasising the specification, or tolerance range for the given characteristics of the process. Next step is to show the relationship between the specific process characteristics and the components or elements of the machine, which affect the given process. The last step is to determine the
depen-dencies between the machine components and their specific settings. As a rule, this step ends with the identification of the settings along with providing the tolerance ranges. An example of the QX matrix with the individual steps of its creation was presented in Figure 2. 4. Identify settings of equipment elements described in step 3. Define specification and tolerances.
1. Quality defects identified in QA matrix 2. List process characteristics which influence quality defects described in step 1. Define specification and tolerances. 3. Equipment elements which control and
influence process characteristics defined in step 2. 1. Quality defects 3. Machine elements and 4. Machine settings 2. Process characteristics
Fig. 2. Steps for creating a QX matrix; own study based on the materials of the
analysed company
Creation of the QX matrix is a difficult and time-consuming task. In some cases, proving the influence between defects, process characteristics, machine parts and its settings may require the performance of appropriate experiments and productions tests.
3.3. QM matrix
The third step in the methodology of determining machine quality points is the creation of the QM matrix. It is a specific counterpart of the process control plan entirely directed at controlling machine factors in the process. The machine factor mentioned are the results of the QX matrix in the form of determined settings of particular components and parts of the machine for specific characteristics of the process affecting the specific quality defect. They are the input to the QM matrix. The next step in the QM matrix is the determination of the impact of the process characteristics for the given component of the machine with the settings to create the given quality defect. The impact assessment is usually given in the three-point scale (for example: 2 – low impact, 5 – moderate impact, 8 – high impact). Factors with the highest rating receive the status of machine quality points. This means that the given machine factor has the highest impact on generating quality defects.
Then, the control elements of the given machine factor are defined. They contain the control method, frequency, responsible person. As a rule, the control is reduced to inspection of the relevant machine components and is included in the maintenance schedules of the relevant maintenance services. It can be done by production employees, after appropriate training, within the scope of autonomous maintenance. An example of the QM matrix will be presented in the next chapter of the paper.
3.4. Visualisation of quality points
The last step in the methodology for defining machine quality points is the visualisation of quality points. The essence of visualisation is consciousness and work discipline building among the crew, because the behavioural aspects are the common cause of quality defects. As a rule, machine quality points take the form of small plates, which contain information about: problem description, method of control, records, visualisation based on the contrast of the proper and improper state of the given machine component. Visualisation of quality points should not be limited only to displaying plates in quality sensitive machine parts. It should be preceded by crew training, which includes the aspects on the impact and consequences of the given machine component on the quality of products, way of controlling, making appropriate records. An example of the quality point will be presented in the next chapter of this case study.
4. CASE STUDY
The case study on the implementation of the methodology for defining machine quality points will be presented based on research conducted in a lighting industry company that is a leader in its industry and that operates globally. The selected example refers to one of the manufacturing facilities producing lighting components. The leading processes are the processes of extrusion, cutting and sintering, and the quality of the produced components at each stage is crucial to the quality of the finished product.
4.1. QA matrix
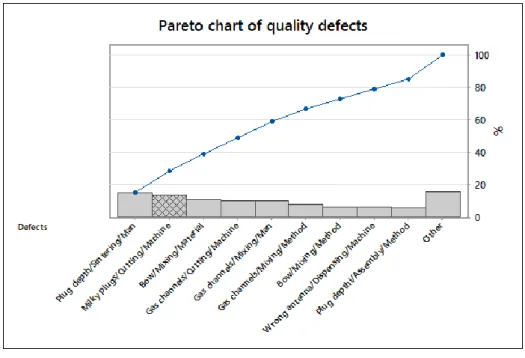
The results of the QA matrix for the analysed company were presented in the form of a Pareto graph in Figure 3. The presented data shows that the biggest quality problem included the following defects: depth of the plug in the sintering process and milky plugs in the cutting process. All defects were quantified in monetary terms based on the cost losses. The human factor was determined as the
causal factor in the manufacturing process for the first defect, while the machine factor for the defect in the form of milky plugs. Consequently, facilitating activities aimed at waste reduction in the case of the first defect should focus on the human component (training, work standards, procedures, etc.). In the case of the second defect, where the machine is the causal factor, the actions based on the methodology for determining machine quality points were taken.
Fig. 3. Results of the QA matrix in the form of a Pareto graph; own study based on the
materials of the examined company
The share of milky plugs waste in total losses in the analysed period was about 13% of total cost losses.
4.2. QX matrix
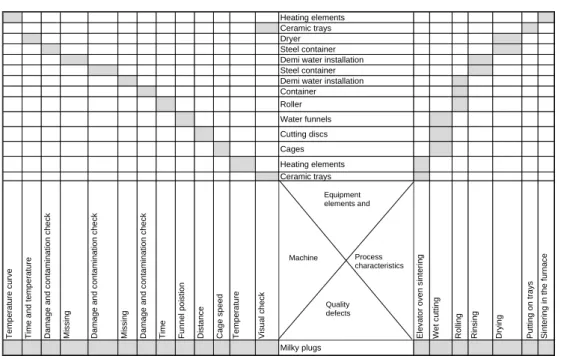
Milky plugs in the cutting process were defined as the QX matrix input. The next step in creating the matrix is to precisely define the process characteristics that influence the generation of defects in the form of milky plugs in a defined process. For the cutting process, there were referred to as: sintering in the elevator furnace, wet cutting, rolling, rinsing, drying, putting on trays, sintering in the furnace. The next step of creating the QX matrix is the determination of the relationship between the process characteristics and machine components. These relations were presen-ted in the QX matrix in Figure 4.
Demi water installation Steel container Demi water installation Container Roller Water funnels Heating elements Ceramic trays Dryer Steel container Cutting discs Cages Heating elements Ceramic trays Te mpe rature cu rve Time and t emp erature Visu al ch ec k Elev ator ove n sin tering Da mag e an d co ntamin ation c he ck Miss ing Da mag e an d co ntamin ation c he ck Miss ing Da mag e an d co ntamin ation c he ck Time Sintering in t he f urna ce Wet cu tt ing Ro lling Rins ing Dryin g Putting on t rays Fu nn el pois tion Dis tanc e Ca ge spe ed Te mpe rature Milky plugs Equipment elements and Process characteristics Quality defects Machine
Fig. 4. QX matrix; Source: own study based on the materials of the analysed company
Most relationships with the cutting machine were attributed to the wet cutting sub-process. In the team’s interpretation, machine components in the form of: cages, cutting discs and water funnels can have a significant impact on the quality of plugs. Similarly for the rolling sub-process, a relation was shown with the roller, container and demineralised water installation. The next step in creating the QX matrix is to associate appropriate components and machine parts with the correct settings. For example, the distance of the discs was determined as settings for the cutting discs that affect the formation of the defect. Also, the lack of control points was noticed for the demineralised water installation.
4.3. QM matrix
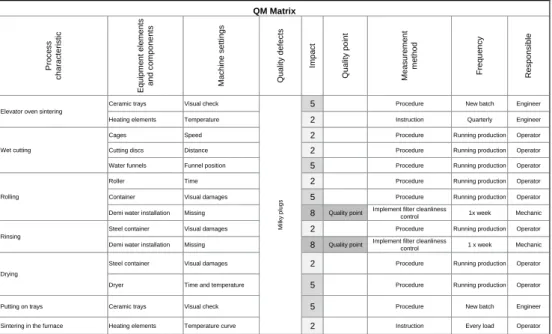
The elements of the QX matrix in the form of process characteristics, machine components, settings are the input to the QM matrix. The next columns of the matrix contain the type of defect, in this case these are milky plugs, and the impact assessment. A simplified example of the QM matrix is shown in Figure 5.
According to the team, the greatest impact on the formation of the milky plugs defects was attributed to the sub-processes of: rolling in connection with the installation of the demineralised water and the sub-process of rinsing in relation with the installation of the demineralised water. For both combinations, the highest score was awarded and it was found that specific settings and control points of
water purity were missing. During the analysis it was found that the demineralised water filter is the critical component and the status of the machine quality point was given to it. In the course of the next work, the purity standard of the water filter was determined, the frequency of its replacement and the responsible person. Similar control elements for other factors were included in the subsequent columns of the QM matrix.
Ceramic trays Visual check 5 Procedure New batch Engineer Heating elements Temperature 2 Instruction Quarterly Engineer Cages Speed 2 Procedure Running production Operator Cutting discs Distance 2 Procedure Running production Operator Water funnels Funnel position 5 Procedure Running production Operator Roller Time 2 Procedure Running production Operator Container Visual damages 5 Procedure Running production Operator Demi water installation Missing 8 Quality point Implement filter cleanliness control 1x week Mechanic Steel container Visual damages 2 Procedure Running production Operator Demi water installation Missing 8 Quality point Implement filter cleanliness
control 1 x week Mechanic Steel container Visual damages 2 Procedure Running production Operator
Dryer Time and temperature 5 Procedure Running production Operator
Putting on trays Ceramic trays Visual check 5 Procedure New batch Engineer
Sintering in the furnace Heating elements Temperature curve 2 Instruction Every load Operator
Process characteristic Eq uip ment ele ments and com pon ents Machine sett in gs QM Matrix Measurement met hod Quali ty defects Im pact Quali ty poi nt
Elevator oven sintering
Wet cutting Frequen cy Re spon sib le Drying Mil ky plu gs Rolling Rinsing
Fig. 5. A simplified version of the QM matrix for the cutting machine; own study based on
the materials of the analysed company
4.3. Visualisation
The last step in the methodology of defining the machine quality points is the visualisation and construction of awareness among employees for the sustained quality assurance. During the team’s work, while creating the QA, QX and QM matrices, two quality points were defined that had the critical impact on the generation of a defect in the form of milky plugs, which accounted for approx. 13% of the total loss of the company from the production waste. Both points concerned the demineralised water supply installation to the plug cutting machine during two sub-processes: rolling and rinsing. When creating the QX matrix it was found that in the case of the demineralised water installation there are no specific settings and no control points. As a result, the control standard was created at the stage of creating the QM matrix, which consists of controlling the purity of the deminera-lised water filter with its cyclical replacement. At the last stage of the
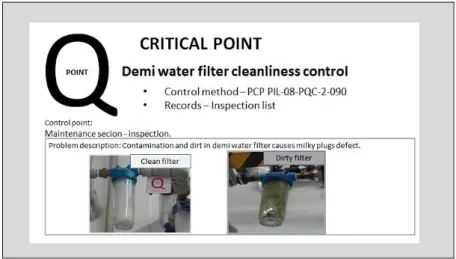
methodolo-gy, the determined quality points are visualised and placed on the given machine sub-component, to which they relate. An example of visualisation of the quality points concerning the impact of the demineralised water filter on the formation of the defect of milky plugs is shown in Figure 6.
Fig. 6. Quality point; materials of the analysed company
Figure 6 shows a clear piece of information about the effect of a contaminated demineralised water filter on the formation of the defect of milky plugs. The plate also includes visual standards presenting the appearance of a clean and contamina-ted water filter. There are also references to the method of control and place of records, execution of the inspections. This way of visualisation is very easy and accessible for the production personnel and mechanics performing inspections. It also greatly facilitates the supervision of the plant management, which can easily diagnose the compliance of the quality point on the machine with the applicable standard as part of the cyclical walks on the production hall.
5. CONCLUSION
This paper presents the methodology for determining machine quality points based on the TPM concept. The main steps of the methodology include the creation of the QA, QX and QM matrices. The last step is the visualisation of critical quality points. The described methodology is based to a great extent on expert knowledge, which reflects on the effectiveness of the method. An important methodological proposal is therefore to provide an appropriate group of experts representing various aspects of knowledge and reflecting the cross-section of
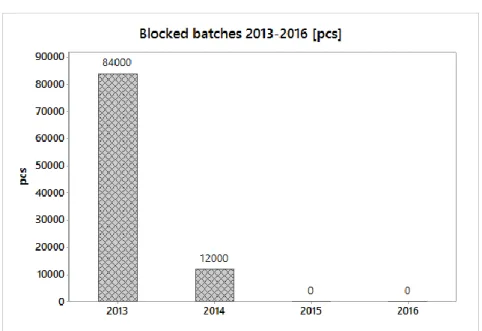
different functions of the company. The presented case study showed an example of the use of methodology for determining quality points for the formation of a defect in the form of milky plugs in lighting components, which accounted for 13% of the total loss due to quality defects in the analysed plant. As a result of the methodology used, the critical quality point was defined, meaning the installation of the demineralised water of the cutting machine in the rolling and rinsing process of the plugs. The standard of inspection and replacement of the demineralised water filter was determined as part of the QM matrix. It was then visualised and placed in the right place on the machine. This is where the question about the effectiveness of the defined quality points arises. The answer to this question is given in Figure 7, which presents the number of blocked plug batches in the production process due to the defect of milky plugs.
Fig. 7. The number of blocked batches for the “milky plugs” defect; own study based on
the materials of the analysed company
The presented data shows that after the implementation in mid-2014 of the critical quality points, and the proper control and replacement of the demineralised water filter, the number of blocked batches dropped to zero. It is also important that in the following years there is no quality problem recorded in this regard. The illustrated example depicts the effectiveness of the methodology for determi-ning the machine quality points and its convergence with one of the basic objectives of the TPM concept, namely striving for zero defects. Bearing in mind the above, it can be stated that the presented methodology can be a valuable
contribution to a wide range of quality assurance tools for many manufacturing companies.
According to the author of the article, further research should deepen the studies on enriching the methodology for determining the machine quality points with expert methods for assessing the impact of the given factors on the formation of quality defects.
ACKNOWLEDGEMENTS
The author of the article would like to thank the project team working on the designation of the machine quality points and all employees of the analysed company, whose daily efforts are an invaluable contribution to quality assurance.
REFERENCES
Bhote K.R. & Bhote A.K. (2000) World Class Quality, AMACOM, New York.
Hamrol A (2015) Strategie i praktyki sprawnego działania, Lean, Six Sigma i inne, PWN, Warszawa.
Hamrol A. (2007) Zarządzanie jakością z przykładami, PWN, Warszawa.
Krishnamoorthi K.S. & Ram Krishnamoorthi V. (2011) A First Course in Quality Engineering. Integrating Statistical and Management Methods of Quality, CRC Press, Boca Raton.
May C. & Schimek P. (2014) Total Productive Maintenance. Fundamentals and Introduction to TPM – or how to achieve Operational Excellence, CETPM Publi-shing, Ansbach.
Nakajima S. (1988), Introduction to TPM. Total Productive Maintenance, Productivity Press, Portland.
Pająk E. (2013) Zasady i metody oszczędnego wytwarzania, Wydawnictwo Państwowej Wyższej Szkoły Zawodowej w Koninie, Konin.
Suzuki T. (1994) TPM in process industries, Productivity Press, New York.
TPM Encyclopedia (2007) Keyword Book, Japan Institute of Plant Maintenance, Tokyo. Yoshida K. et al. (1990) Training for TPM. A manufacturing success story, Productivity
Press, Portland.
BIOGRAPHICAL NOTES
Adrian Wojciechowski is a business practitioner with more than 16 years of work
experience in the industry and the author of several research papers. His scientific interests include systems of continuous improvement, including the Total Productive Maintenance and Six Sigma, and issues related to quality assurance and productivity.