THE ART OF MANAGING PRODUCTION DISRUPTIONS
IN PUMP INDUSTRY
Johannes Bekane Mapokgole* and Thomas Bobga Tengen*
* Department Industrial Engineering & Operations Management, Vaal University of Technology, Vanderbijlpark, 1900, Gauteng, South Africa,
Email: j.mapokgole@weirminerals.com Email: thomas@vut.ac.za
Abstract The current business environment in pump manufacturing companies is characterized by
markets facing fierce competition. Customer expectations as a result are becoming increasingly higher in terms of quality, cost and delivery dates. These expectations are even worse due to rapid development of new information and communication technologies which provide direct connections between companies and their clients. Therefore, companies must have powerful “planning and controlling” mechanisms at their disposal. To achieve this, companies rely on a number of functions including production scheduling. Production scheduling strategies and disruptions management in pump industry are investigated, followed by a new-fangled concept suitable for addressing problems considered herein. Slot allocation process which starts by assigning slot number and/or confirmed order and ends when it is accepted into the queue by operations planning is presented. We further examine and relate market needs with manufacturing capacity available and supplier capacity by employing basic theory of work measurements, e.g., TAKT time, etc.
Paper type: Research Paper Published online: 30 April 2013 Vol. 3, No. 2, pp. 123-136 ISSN 2083-4942 (Print) ISSN 2083-4950 (Online)
© 2013 Poznan University of Technology. All rights reserved.
Keywords: Production Scheduling, Disruptions Management, Slot Allocation, Heijunka, TAKT Time, Quick Response Manufacturing
1. INTRODUCTION
Most companies adopted just-in-time (JIT) manufacturing techniques following its proven successes in the past decades. The strategy based on this Japanese meth-od is described and popularized under the name of “Lean Manufacturing” (Wom-ack & Jones, 1996); (Womack, Jones & Ross, 1990). Industrial corporations rec-orded impressive results following the use of this technique. JIT/Lean Manufactur-ing were developed and perfected by Toyota over 40 years ago. How can we ex-pect to stay ahead of the game while adopting 40 year old technique? Recently, few companies challenged their competition via a powerful strategy called “Quick Re-sponse Manufacturing (QRM)” (Rajan, 2002). Lead time reduction in all aspects of company’s operations is at the very heart of this strategy. All wasteful aspects on the production processes are fore-highlighted and addressed.
QRM is double-sided, where manufacturers view it as a lead time reduction tool that results in improved quality, lower costs, and most importantly quick response time which results in improved on-time delivery. Whereas, as perceived by cus-tomers; QRM means responding to their demand timeously and rapidly. It is a pra-ctical strategy, as it embodies mindset of pursuing lead time reduction along with manufacturing methods. Companies that implemented QRM realized the following benefits “lead time reduction of 80 - 95%, product cost reduced by 15 - 30%, on-time delivery (OTD) performance improved by 60 - 99%, and reduction in scrap and rework by 80%” (Tubino & Suri, 2000). Random disruptions are expensive, and often built up in product price. With smooth production flow (i.e., uninterrupt-ed), manufacturers spend less to produce goods, hence cheaper products. Lead time reduction has a long term impact on every aspect of business operations. It deter-mines how manufacturers price their product.
How companies know if they practice QRM technique? This statement can be used as a determining factor for companies to ascertain if they are QRM reliant or not. All stakeholders must work harder, faster and longer hours, in order to get the job done in less time? Most executives are likely to say “Of course we all know that to be false, our company is working smarter and not harder”. But then ask yourself, “Does the company frequently use overtime? Does it take a lot of expedit-ing to get jobs out of the door? Does company often work on weekends?” If the an-swer to any of these questions is “yes”, then it is apparent that executives of the com-pany believe this main question to be true. Thus, QRM is a necessity. Often compa-nies use technology as a constraining factor for their not achieving set targets. With QRM the constraining factor is not technology but perceived to be mindset. Thus, companies must engage on low cost or no cost lead times reductions, leaving ex-pensive technological solutions for a later stage. The key is the company’s ability to identify probable constraints and address them on time before system get upset.
Lean manufacturing technique is employed where industrial corporations works on the rhythm provided by customers (i.e., customer demand determines
manufac-turers drum beats), where TAKT time, Cycle times coupled with Heijunka and simple visual management tools are employed. The starting point is to present techniques employed herein and their respective relation to production scheduling:
1.1. Cycle Time – The Production Rate
In this paper, cycle time is employed to refer to the total elapsed time between when a customer places an order and when order is received. It tells production personnel how often they can produce the product with current resources and staff-ing levels, i.e., an accurate representation of how the line is currently set up to run. It can also be referred to as “production rate” in value stream mapping. Cycle time calculation takes into account the entire production quantities. When multiple lines are producing same product, then the composite cycle time is less than the actual elapsed time of any individual line.
1.2. TAKT Time – The Demand Rate of Production
TAKT time sets the pace of industrial manufacturing line, originally developed to refer to the beat of music and its practical elements such as the musical rhythm (Mierzejewska, 2002). It aims to match the pace of production with customer de-mand. The TAKT time is the total time available to produce a batch of products divided by the total number of units which must be produced to meet the contractu-al date (Rother & Harris, 2002). Theoreticcontractu-ally it seems simple, but in practice it may slightly be complicated as it may need to take into account varying staffing levels, if there are any shifts or staggered breaking times, or subjugated to random disruptions. It varies with different product mixes.
TAKT time calculation can be expressed mathematically as follows:
d a T T T
Where: T is the TAKT time, e.g., (minutes of work/unit produced); Ta is the net available time to work (minutes of work per day, net available time is the amount of work to be done. This excludes break times and any expected stoppage time, e.g., for example planned maintenance, team briefings, etc.); Td is the time demand (required units per day).
Constituencies of ‘available time’ - is the total shift times subtract breaks, meet-ings and other administrative non-working times. It can be expressed mathemati-cally as per below:
D T Ta t
Where: Tt is the total time available; D is any form of disruption (planned or unplanned).
(1)
TAKT time is an expression of customer demand normalized and leveled over the total production time. It is not, and never has been, a pure customer demand signal since customers do not order same quantities every time they place orders. Customers place orders continuously based on their demand, and not by availability of suppliers’ machines (i.e., they do not stop placing orders during breaks, or when machines are unavailable). TAKT time make customer demand appear level across working day.
1.3. Heijunka – Production Leveling
The manufacturing industry uses many systems to help with production. Heijunka is one such system. Rother and Harris (2002) define Heijunka as “a pro-cess of leveling out actual production flow”. It allows scheduling of the manufac-turing process to concentrate on smaller, more manageable amounts in order to en-sure all the products from the production line are the same. The idea behind this con-cept is that it is better to make products in smaller amounts that they are all of the same quality, rather than mass producing them and having the chance of flaws to appear within the items being made.
2. MOTIVATION
The purpose of this study is to ensure that the slot allocation process for the pump production is implemented in a standard and controlled manner. This proposed methodology starts with assigning slot number and/or slot date to a confirmed pump contract by sales and marketing, and ends when the pump is accepted into the queue by sales and operations planning. It is also to ensure that Planning department does not overload Operations by using employing expression (2) discussed above.
Benefits of the proposed system are:
• Quality non-conforming products volume reduction due to adjustments made on the production line, resulting in higher profit margins.
• Fair strain on the manufacturing equipments and company executives, since the production lines would run a lot smoother with fewer problems. • High return on investments and improved on-time delivery.
• Quick response to random production disruptions and effective manage-ment thereof.
3. METHODOLOGY
In this section, rationale or concept behind pump slotting and management is discussed.
3.1. Number of slots
Background information to identify available slots is as follows: available pro-duction capacity (is expressed in hours per day) – actual time available for produc-tion is identified. Overtime is discounted when determining available capacity cal-culations. Exception: overtime is considered when adding slots in case when cus-tomers’ requirements go beyond normal available slots (infrequent basis), i.e., re-sponding to variations caused by delay, non-conformances, quality non-confor-mances, etc.
• TAKT time (expressed in number of pumps per day) – total number of pumps in the order book per year divided by the number of available pro-duction days.
• Look at TAKT time and compare to average cycle time to complete a pump. • Check that X (TAKT time x Average Cycle Time) < Y (Capacity available
per day). If X is greater than Y, then TAKT time may not be met consistently. Assigning number of slots can be accomplished in different ways:
• If the variability of cycle time to complete pumps is small, or average cycle time is not too far from minimum and maximum cycle time:
Number of slots becomes available capacity per day divided by average build time per pump. The slots of types of pumps need to balance to not overfill ca-pacity with assembly load; this method has a fixed number per day that is rela-tively stable, but need to watch to not overbook capacity with too many pump slots as some pumps maybe over the average due to size.
• If the variability of cycle time to complete pumps is medium, or the aver-age cycle time for one type of pump differs by too much from others: Identify small, medium and large pumps categories and assign a number of slots for each category per day (e.g., one day may comprise of 3 small slots, 2 medium slots and one large slot), several small and/or large slots can be substituted by one large if a need arises and vice versa.
• If the variability of cycle time to complete pumps is high, and there are not categories that can be easily formed:
Define the number of slots by filling slots in a production day by consum-ing actual capacity with actual build time, this will not make the number of slots per day equal because the number of slots will vary with build time, but there is less risk of over-booking capacity.
3.2. Job Cards
Job cards represent a manufactured item (i.e., pump). Job cards comprises of pump serial number, product specification, customer names, planner responsible, order date, planned completion date, bill-of-material (only if no allocations - if allocated, part number fall off the job card), etc., an example of a job card is illus-trated below in Fig. 1:
Fig. 1 Example of a Pump Job Card
Slotting room (sometimes called War Room) process is managed by almost all stakeholders from Sales to Logistics. All key players attend this meeting which is scheduled for early hours of every day. All key players have a photo printed for tasks allocation purposes. Order book is discussed thoroughly from blue colored job cards (pumps with minimal or no allocations) which comprises of all parts shortages to pumps complete waiting dispatch. Procurement affix anticipated delivery date for pump components on pumps with minimal or no allocations. All surprises are high-lighted and tasks are assigned to persons responsible by putting a photo on the job card with an action, expected date for problem solving if applicable is committed upon.
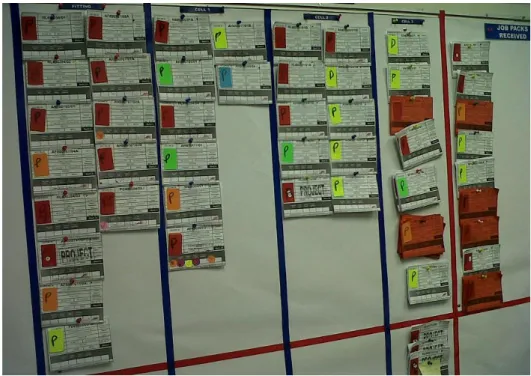
Job card represent one pump. Process consists of the following operations or workstations: Planning Slotting (new order default status, order is outside tion window – parts still being procured), Slotting Room (order falls within alloca-tion window, parts gets “allocated” to the order), Picking (only 100% allocated pumps are sent for picking: parts are physically pulled off the warehouse), Produc-tion (comprises of 4 cells: it is then slotted based on the pump size; e.g., Fig. 2),
bare-shaft pumps are send to Inspection (for internal release) after production, and pumps with drives (i.e., motor and ancillaries) go through Fitment, and thereafter Inspection. The slotting wall consists of all these workstations: i.e., it is an actual reflection of what is/has happened on the shop floor. If Cell 1 shows 12 pumps pending pro-cessing or being processed, the wall also reflect same. The wall is real time; it is updated every passing second of the day. From picking operation to the last opera-tion, all operations has what is called “sick bay or quarantine”: this is built-in to cater for unforeseen disruptions that hinder the job from proceeding to the next workstation for various reasons (e.g., surprise shortages, manufacturing problems, engineering or quality related problems, etc.). All orders under this section are discussed thoroughly in detail and actions are assigned with relevant individuals (photos and expected date due are pinned on the job card with action to be taken). Progress is discussed daily, and any deviation if any is highlighted before system is unbearably upset.
3.3. Slot Number
Upon tender receipt, the following information is used by Planning department to calculate and/or determine slot number. There is one slot per pump order. Allo-cated slots are tracked on a calendar (paper or electronic). Sales order change by Sales is weighed and if need be, new slot number is given to that order based on the degree of the change.
• Quotation of motor delivery from procurement,
• Sufficient information for configuration group to complete pump bill of mate-rial (BOM) in time to meet lead time required for all components parts, • Confirmed completion dates for engineering changes,
• Parts with longest lead time essentially determines the expected pump start date and ultimately completion date,
• Given different lead time per parts, MRP is planned to place orders contin-uously based on start date,
• All special requirements are highlighted prior to slotting, and lead time in-corporated in the pump lead time, e.g., gear boxes, mechanical seals, parts with special or far-fetch material, etc.
Standard pump lead times are calculated based on the standard lead times for individual components that make up bill of materials or required for the production of a pump. These standard lead times are readily available (through companies’ order processing workflow) and committed to by the preferred supplier. In case of special components, quotations detailing anticipated delivery dates are received from supplier prior to committing or setting the delivery date. Upon receipt of this information, Planning department calculate slot and advice Sales to advice the cus-tomer with the feasible committed dates. Slots are determined by evaluating the longest lead-time items on the bill of material and then looking for the next
availa-ble slot on the calendar. The long lead time analysis may be automated through the use of “Available To Promise” (ATP) functions within ERP.
Fig. 2 Job Cards for Pumps slotted and in Production
3.4. Slot Number Management
Planning foresee this function once configuration has completed the input. Fro-zen Period: the slot assigned in the system will have to be cleared off all TBA (to be advised) or modification within a fixed number of weeks before scheduled build date. If for whatever reason (internal or customer delay), TBA items are not speci-fied within the beginning of the frozen period, Sales only have one week to justify why the pump should retain the slot, and if the reason is not accepted, then the pump is moved out of the slot and will have to start the process all over again (or from scratch) depending on what information is missing or short.
Changes to a particular pump order within a frozen period can only be made if all parties or stakeholders agreed on the modifications and will be allowed only if there will be no disruptions to other pumps. Pumps follow FIFO method and customer required delivery dates determined as outlined above. The length of the frozen period is division dependent given different process cycle and backlogs.
3.5. Lead Times Management
Long lead time items – all long lead time items are considered in pump lead time calculations, Special motor – quotation must be received from Sales prior to lead time calculations. Changes beyond the frozen period will need only the agreement from relevant party, e.g., Operations (for in-house manufactured components) and Procurement (for purchased parts). A diagrammatic view of the process is shown in Fig. 5:
Fig. 3 Pump Slotting Process Overview
Fig. 4 Blue & Green Job Cards
3.6. Leel Scheduling
Heijunka - level scheduling of work centers, preferably using visual planning board. The maximum number of slots per day are determined and reviewed on a continuous basis. This review consists of market needs, internal capacity availa-bility and supplier capacity. The established number of slots will provide the TAKT measurement for assembly process. If there are operational capacity con-straints (e.g., limitations on the number of very large pumps that can be assembled
at one time), these constraints are factored into the slotting process to prevent over capacity and potentially late delivery.
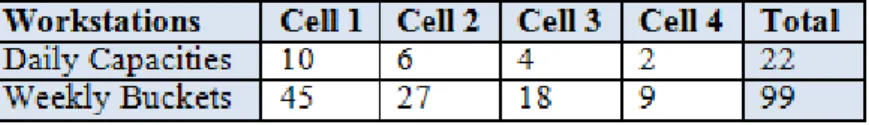
Microsoft Excel “query” or report is established to aid during order slotting. This report is conditional formatted, and linked to ERP system, highlight work-stations that are overloaded. That is when Heijunka principle is employed to assist in production leveling. It is grouped by cell numbers (e.g., Cell 1, Cell 2, Cell 3 and Cell 4). Cell 1 assembles horizontal small pumps, Cell 2 is for horizontal Medium to Large pumps, Cell 3 is for Vertical Spindle pumps, and Cell 4 is for dewatering pumps. Production capacities are as follows:
Table 1 Workstations Capacities
Weekly buckets are calculated as follows: daily capacities multiply by 4 days (Monday to Thursday) plus half daily production for Friday. Entire order book is decomposed into weeks per workstations, i.e., if Planning loaded more than 45 pumps in Cell 1 for Week 42, this will be highlighted to aid slotting personnel to level production. Yet, if weekly production is more than 99 pumps, equally lev-eling methodologies are employed.
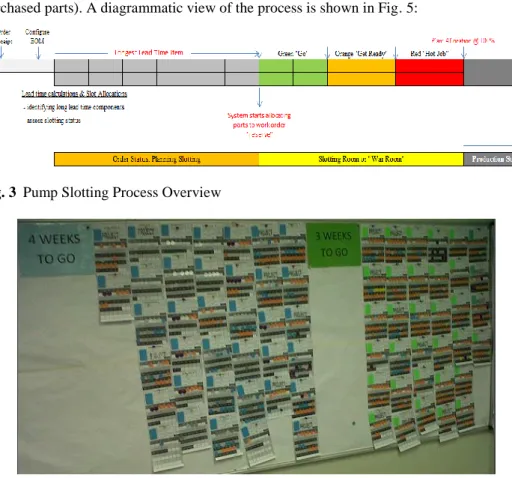
This system is supported by open communication between various departments from Sales to Logistics. To assist this communication, a manual visual tracking of pumps slots for the period of 4 weeks prior to assembly (War Room) is also pro-posed. Typically the departments identified as responsible meet up daily to confirm that parts to be kitted for assembly and go through War Room slots, identifying and taking steps to get missed components that are made visible on the War Room Wall.
3.7. Production with Heijunka
“….. there slower but consistent tortoise causes less waste and is much more desirable than the speedy hare that races ahead and then stops occasionally to doze, (Ohno, 1988)”. This tale is an illustration of the leveling principle in which the workload is leveled for the sake of continuity (consistency of tortoise’s pace) re-gardless to orders variations (the dashing of the hare) – refer to figure 6 below.
In reality, customer orders may be considered relative constant when looked upon a long period (averaging effect) or unpredictable if considered in a shorter period, i.e., production variations do occur due to process itself (planning, schedul-ing, breakdowns and stoppages, etc.,). However, efficient work supposes constant flow, rhythm (TAKT time) and standardized work (regular and invariant). In order
to produce with less waste (overtime, inventories, rework, stress) while satisfying market demand… precisely what is sought through production leveling.
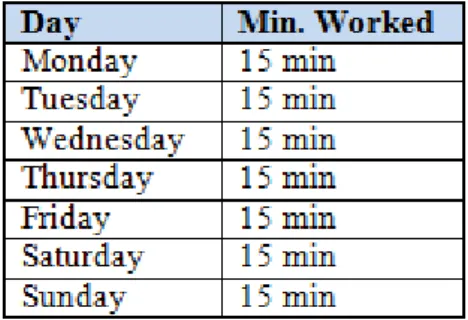
Practical application of Heijunka… “… fluctuations in performance increase waste. This is because resources and other required elements must always be pre-pared for peak production. Flexibility is costly in itself. If a later process varies its withdrawal of parts in terms of timing and quality, the range of these fluctuations will increase as they move up the line towards the earlier processes. Where demand is constant, production leveling is easy, but where customer demand fluctuates, demand and demand leveling are adopted.” As it applies to yard work: think of a lawn work schedule in a given week looking like this (let this referred to as sched-ule “A”):
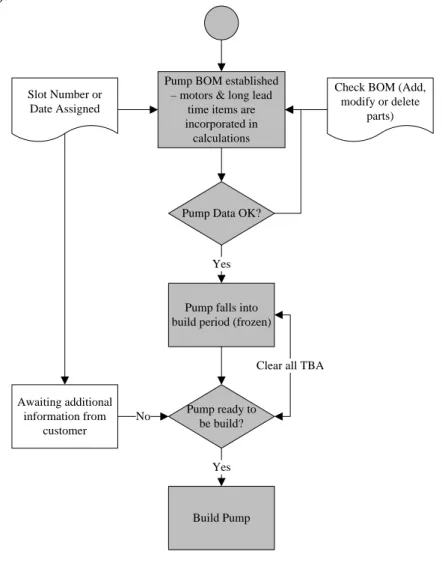
Slot Number or Date Assigned
Pump BOM established – motors & long lead
time items are incorporated in calculations
Check BOM (Add, modify or delete
parts)
Pump Data OK?
Pump falls into build period (frozen)
Pump ready to be build? Build Pump Awaiting additional information from customer Yes Yes No
Clear all TBA
Fig. 6 Steady & Unsteady Production Flow
Heijunka and the art of lawn work.
Table 2 Lawn Work Schedule
By applying Heijunka principle to level production time, schedule looks like this (let this referred to as schedule “B”):
The burden is now lighter and bearable, and as such, resources are not overloaded but perform averagely. This can be related to machines loading in which on the last two days of the week, machines overwork and thus, affecting negatively life cycle. Production leveling does not only benefits the customer, but also ensure fair share on resources, diminish unnecessary overtimes, and lessen inventory costs.
4. CONCLUSION
The notion of leveling by volume and mix produces benefits throughout the value stream; the problem of how to control production to ensure high degree of leveling is also entertained and consistently achieved. Production scheduling pro-cess stability in pump industry introduced by leveling makes it vastly easier to introduce lean techniques, such as QRM, Heijunka, etc. As the mura (unevenness in productivity) and muri (overburden of machines or workstations) introduced by traditional production control recede, muda (waste) declines as well. When every process is leveled by volume and mix, it is a different world of employees (who are no longer over-burned); for customers (who get better products on the promised contractual dates) and for manufacturers (who get to reclaim their well-deserved share off savings following deterioration of muda, muri and mura). Methodologies presented herein can also be employed universally in companies that manufacture or assemble products requiring a lot of components (bill-of-material). Specific outcomes are presented below:
• Potential unforeseen and/or random disruptions are identified and dealt with timeously with customer contractual dates in mind.
• Production is smoothly planned and operations carried out without inter-ruptions or disinter-ruptions.
• The system is in synchronization with customer requirement, thus, organi-zation works on the rhythm provided by customers.
• Workload is fairly leveled through Heijunka.
• No over production, production is triggered by customer order. • No rush hours in work.
• Inventory levels are reduced and problems in the system are revealed and effectively managed.
Results indicate that various random disruptions are highlighted and addressed before upsetting the system unbearably. Thus, making production planning and control well manageable, and records show on-time delivery improvements from early forty percent to eighty. The key to improve on-time delivery is on “to well manage the lead times, i.e., have all information necessary for calculations thereof prior to committing to customer”.
ACKNOWLEDGEMENTS
This material is based upon work supported financially by the South African National Research Foundation (NRF). Any opinion, findings and conclusions or recommendations expressed in this material are those of the author and therefore the National Research Foundation does not accept any liability in regard thereto.
REFERENCES
Mierzejewska A., (2002), Systematic Approach to TAKT Time Calculation in Achieving Required Manufacturing System Capacity, Cambridge.
Ohno T., (1988), Toyota Production System: Beyond Large-Scale Production, Productivity Press, Portland.
Rajan S., (2002), Quick Response Manufacturing: A Competitive Strategy for the 21st Century. University of Wisconsin-Madison.
Rother R & Harris M., (2002), Creating Continuous Flow: An Action Guide for Managers, Engineers and Production Associates, Lean Enterprise Institute.
Tubino F. & Suri R. ,(2000), What Kind of Numbers Can a Company Expect After Implementing QRM? “Proceedings of the Quick Response Manufacturing 2000 Conference”. Society of Manufacturing Engineers, Dearbon.
Womack J. & Jones D., (1996), Lean Thinking. Simon and Schuster, New York.
Womack J., Jones D. & Roos D., (1990), The Machine That Changed the World. Harper Perennial, New York.
BIOGRAPHICAL NOTES
Johannes Bekane Mapokgole is a researcher at the Vaal University of
Technology, South Africa. His research interests are production scheduling, random disruptions and stochastic theory. He authored more than six (6) peer-reviewed publications in South Africa & internationally.
Thomas Bobga Tengen is a senior Lecturer and an Analyst of Random