IS THE BLUE ECONOMY POSSIBLE IN POLAND?
ABSTRACT: Although the concept of the blue economy is relatively new, the European Union is already taking steps to make it a reality. Therefore, it is necessary to determine the scope of activities that should be carried out for the sustainable development of the blue economy in Poland. It was decided to analyze basic data and indicators to verify whether the Polish maritime and coastal economy meets the goals of the blue economy. During the research, it became apparent that inaccuracies in terminol- ogy affect the selection of indicators. Therefore, the definitions and classification of sectors related to the blue economy were verified. Based on the literature review and the available data, the Polish mari- time and coastal economy has considerable potential to be transformed into a blue economy. How- ever, major barriers have also been identified, the removal of which requires a systematic approach.
Furthermore, the benefits and costs associated with the transformation are highlighted.
KEYWORDS: blue economy, green economy, Polish maritime and coastal economy, sustainable development
Dorota Michalak (ORCID: 0000-0002-9456-2500) – University of Lodz
Paulina Szyja (ORCID: 0000-0002-9672-1341) – Pedagogical University of Cracow Correspondence address:
Podchorążych 2, 30-084 Kraków, Poland e-mail: paulina.szyja@up.krakow.pl
Dorota MICHALAK • Paulina SZYJA
Introduction
In addition to concepts such as a low-carbon economy, the green econ- omy, and the circular economy, another concept was created – the blue econ- omy (BE). This article defines the term blue economy, presents the idea behind it and the related sector and subsectors, and indicates its principles and indicators. It arranges concepts related to the blue economy and pre- sents the European Commission’s engagement in creating a “sustainable blue economy” in connection with the European Union’s (EU’s) transformation based on the European Green Deal (EC, 2022b). Since there is no clarification of the term and no in-depth analysis of the issue in the documents, the pur- pose of this study is analysis at basic data and indicators to verify whether the Polish maritime economy will meet the goals of the BE. We will examine the extent to which the BE has been implemented in Poland compared to other EU member states and the degree of development of economic activi- ties related to oceans, seas and coasts in Poland. We discuss whether the Pol- ish coastal economy is ready to introduce the BE concept. The analysis car- ried out was the starting point for attempts to formulate the scope of activi- ties that should be carried out for the sustainable development of the BE in Poland.
Definition of the blue economy
The genesis of the blue economy is related to the United Nations Con- ference on Sustainable Development held in Rio de Janeiro in 2012 (Smith-Godfrey, 2016).It was introduced to the international debate as a result of questions being raised about the applicability of the green econ- omy to coastal countries (UN, 2012). The blue economy was described widely in the UN’s “Blue Economy concept paper” by conceptualising oceans as “Development Spaces”, breaking the mould of the business as usual “brown” development model, incorporating ocean values and ser- vices into economic modelling and decision-making processes, all of whichconstitute a sustainable development framework for developing countries (UN, 2012).
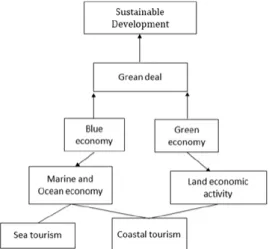
The concepts of the blue and green economy are part of the Green Deal, which aims to pursue sustainable development. The BE is aimed at sectors such as the ocean economy and the maritime economy. By comparison, the concept of the green economy is based on economic activity on land (Mickie- wicz, 2012, p. 171-179). Both concepts, while pursuing one common goal (i.e., achieving the goals of the Green Deal), complement each other, espe- cially in the coastal tourism sector (see Figure 1). Some authors use terms
like Oceans Economy (OE) or Marine Economy (ME) synonymously (Ki-Hoon et al., 2020). However, they should be separated because the maritime econ- omy is human activity related to the sea and its waters. It involves the pro- duction, processing and consumption of related goods and services.
Meanwhile, the ocean economy is about the oceans. Coastal tourism cov- ers beach tourism and recreation, including swimming and sunbathing, as well as other activities related to proximity to the sea. Sea tourism is mainly concerned with water-related activities such as sailing, water sports (often done in coastal waters), and cruises in regions that can be visited in one week (Dębski, 2015, p. 50-51). Others point out some additional terms, including Ocean Economy (rather than Oceans Economy), Maritime Economy (MAE), and Blue Growth (BG), indicating the similarities and differences between them (Martínez-Vázquez et al., 2021).
According to Martínez-Vázquez et al. (2021), “The most interesting find- ing arises in the intersections, with the common element for BE and BG being the economy and the protection of marine ecosystems to ensure sustainabil- ity, ME and OE share industry development and location, in BE and ME we find governance and sustainability, and finally, BG and OE cooperate in the growth of the ocean-based economy.” Regarding the differences, they are related to “aspects pointing to a social and complex system, a green and inclusive economy, as well as the existence of operational risks”.
Figure 1. The Blue Economy and Sustainable Development Source: authors’ work based on Eurostat 2022.
The literature mentions the “blue economy”, the “new blue economy”, and the “sustainable blue economy.” The new blue economy contrasts with the “old” ocean economy. “The ‘new blue economy’ is the term of art for iden-
F1
tifying those activities that improve the human relationship with the ocean and for aligning our systems of accounting and metrics to both define and enhance our ocean-positive economy. It also allows for us to account for
‘eco-system services’ (provisioning, regulating, supporting and cultural) pro- vided by the ocean to plants and animals (including humans)” (Spalding, 2016). The term sustainable blue economy is related to changes in the blue economy on the road to transformation under the UN’s Sustainable Develop- ment Goals and the European Green Deal.
There are also some who write about blue growth and blue degrowth.
According to the European Commission, blue growth means “the long term strategy to support sustainable growth in the marine and maritime sectors as a whole. Seas and oceans are drivers for the European economy and have great potential for innovation and growth. It is the maritime contribution to achieving the goals of the Europe 2020 strategy for smart, sustainable and inclusive growth” (Smart Specialization Platform, 2022).
The term was described by the European Commission as “five areas where additional effort at the EU level could stimulate long-term growth and jobs in the blue economy, in line with the objectives of the Europe 2020 strategy” (EC, 2012).
In contrast to blue growth, the literature also highlights the term blue degrowth. The term the degrowth emerged in the debate about economic growth and its factors, and it represents an attempt to move away from that paradigm: “The Blue Degrowth framework makes a quest for a com- mon participatory societal vision towards the seas, emphasising a rela- tionship that strives for the rights of coastal communities, small-scale production, local consumption, and fishing as well as consumer coopera- tives, and (participative) common management of marine areas, instead of a capitalist increase of exploitation, extraction, production, and con- sumption enabled by neoliberal (nationalist) marine policies” (Ertör &
Hadjimichael, 2020).
When analysing terminological and semantic issues, one cannot ignore the meaning of the BE promoted by Gunter Paulli, which “goes beyond the Globalized and the Green Economy”(Paulli, 2022). This con- cept is based on “nature’s evolutionary path” (ZERI, 2022) and using it as a reference for innovative design, use, and reuse of products while focus- ing on local communities and resources, encouraging “the young and the entrepreneurial minds”, developing clusters rather than large enterprises (Paulli, 2022). Paulli identified “five design principles” (Knowlton, 2008):
1. Whatever is a waste for one species is a nutrient or food for another spe- cies belonging to another kingdom;
2. What is a toxin for one organism is a nutrient or neutral for another belonging to another kingdom;
3. Whenever highly complex ecosystems operate, viruses will become inac- tive and even disappear without causing harm once passing through at least two other kingdoms;
4. The more local and the more diverse a system, the more productive and the more resilient it is; and
5. Whenever species of five different kingdoms live and interact in an auto- poietic system, they can integrate and separate all matter at ambient temperature and pressure.
Therefore, Paulli’s considerations relate to the business model rather than the economic sector.
To clarify the term, it is useful to refer to various sources. In a World Bank Group report, the BE is defined as “comprising the range of economic sectors and related policies that together determine whether the use of oceanic resources is sustainable” (WBG, 2017, p. vi). In the report from the Directo- rate-General for Maritime Affairs and Fisheries with the Joint Research Center (European Commission), the issue is framed more concisely: “all those activities that are marine-based or marine-related” (EC, 2019b, p. 7).
These two definitions highlight two issues: the marine environment and the economic sectors linked to it. Further explanation of the term refers to the concept of sustainable development and its operationalisation through the green economy. As the UN points out: “The Blue Economy espouses the same desired outcome as the Rio+20 Green Economy initiative, namely:
‘improved human well-being and social equity, while significantly reducing environmental risks and ecological scarcities’” (UNEP, 2013). “It also endorses the same principles of low carbon, resource efficiency and social inclusion, but it is grounded in a developing world context and fashioned to reflect the circumstances and needs of countries whose future resource base is marine”
(UN, 2014, p. 3).
This approach makes it very clear which regions of the world should emphasise implementing the BE. According to the Sustainable Development Goals of the UN – Target 14.7: Sustainable use of marine resources: “By 2030, there should be an increase in the economic benefits to small island develop- ing States and least developed countries from the sustainable use of marine resources, including through sustainable management of fisheries, aquacul- ture and tourism” (UNCTAD, 2022). According to the UN, the general goal of the BE is: “the de-coupling of socioeconomic development from environmen- tal degradation”. And to “achieve this, the Blue Economy approach is founded upon the assessment and incorporation of the real value of the natural (blue) capital into all aspects of economic activity (conceptualisation, planning, infrastructure development, trade, travel, renewable resource exploitation, energy production/consumption). Efficiency and optimisation of resource
use are paramount whilst respecting environmental and ecological parame- ters” (UN, 2014, p. 3).
Achieving this goal will make it possible to increase social well-being while reducing pressure on the environment and ecosystems. However, there are some differences between the green and blue economies: “The Blue Economy may be the most sophisticated biologically inspired economic the- ory and at the same time the most practical. It is a paradigm considering that waste-free production can be more profitable than current industrial pro- duction. Contrary to the so-called Green Economy, it does not consider that the solving of pollution will inevitably impede growth, but rather that there is a paradigm shift to transcend the conflict of interest between growth and sustainable development” (Aberkane, 2017, p. 283). In this sense, the BE is related to the circular economy.
Within the BE, the blue bioeconomy stands out. It “relies on renewable, living aquatic resources such as algae, sponges, jellyfish or microorganisms to deliver a wide variety of products, processes and services” (EC, 2022a). It is also important to point out blue skills and blue jobs. Blue skills are diverse:
soft, technical, digital, social media, environmental, security, entrepreneurial, socio-economic, multi-disciplinary, languages, statistics, law, maritime spa- tial planning (Workshop on blue jobs and cross-cutting skills for young pro- fessionals and graduates of the Med Countries, 2022). Blue jobs are related to BE sectors like coastal tourism, aquaculture, ocean energy, and marine bio- technology (Blue Generation Project).
This study assumes that BE covers all those activities that are marine-re- lated, sectors like coastal tourism, aquaculture, ocean energy, and marine biotechnology, aiming at economic development, improving human well-be- ing and social equity while at the same time significantly reducing environ- mental risks and ecological scarcities.
An overview of the literature
The literature covers a range of BE issues, including how it is defined and what the BE space is. For example, the United Nations “conceptualises oceans as ‘Development Spaces’ where spatial planning integrates conservation, sustainable use, oil and mineral wealth extraction, bioprospecting, sustaina- ble energy production and marine transport” (UN, 2014, p. 3). Numerous publications take into account the various sectors of the BE. A World Bank Group report explicitly mentions the following sectors: fisheries; aquacul- ture; coastal and maritime tourism; marine biotechnology and bioprospect- ing; extractive industries (non-living resources); desalination (freshwater generation); renewable marine (off-shore) energy; naval transport; ports
and related services, e.g., shipping and shipbuilding, and waste disposal man- agement; supporting activities (ocean monitoring and surveillance, ecosys- tem-based management, activities that support carbon sequestration (blue carbon) and supportive financial mechanisms) (WBG, 2017, p. 12-28).
In turn, the European Commission distinguishes two categories of sec- tors in the blue economy. The first is named “established sectors”: marine living resources, non-living marine resources, marine renewable energy, port activities, shipbuilding and repair, maritime transport, and coastal tourism.
The most important of these in the EU are living resources (gross profits val- ued at €7.3 billion in 2018) and marine renewable energy (with an increase in employment by 15% in 2018, compared to 2017). The second is named
“emerging and innovative sectors”: marine renewable energy (e.g., ocean energy, floating solar power and off-shore hydrogen generation), blue bioec- onomy and biotechnology, marine minerals, desalination, maritime defence, security and surveillance, research and education, and infrastructure and marine works (e.g., submarine cables, robotics) (EU, 2021, p. VI).
Some scientific articles present issues related to developing the BE in dif- ferent sectors, e.g., sustainable fisheries, marine biotechnology, coastal water resources management, blue financing (Bears, 2021), and sustainable tour- ism (Cummings & Greenberg, 2021). There are also more detailed texts that take into account management and innovative products in the field of green business in the BE (Kraus et al., 2020). In addition, some articles deal with the creation of the BE on different continents (Mohanty & Dash, 2020), in different regions, such as the Bay of Bengal (Alam, 2021), in various coun- tries, including the Philippines (Satizábal et al., 2020), as well as BE govern- ance (Midlen, 2021).
Essential elements of the transformation into the BE include science, research (Outa et al., 2018), and innovation. The literature contains papers that investigate many areas, including policy-driven innovation system for the BE (Sousa et al., 2020); the creation and implementation of innovation, e.g., related to energy (WOI, 2020); the biological potential of the sea and its use for the needs of the pharmaceutical industry in the BE, e.g., the antioxi- dant and anti glycemic properties of macroalgae as a BE bioresource in India (Jagtap et al., 2021), and using technological potential (Vedachalam et al., 2019). What is vital for a successful BE is cooperation among scientists and industry, especially in realising blue carbon projects (Alongi, 2018).
The literature presents a wide selection of issues, from maritime security and the BE (Duarte, 2016), through the involvement of local communities to sustain the natural ecosystem (Okafor-Yarwood et al., 2020), the develop- ment of entrepreneurship for the BE (Senaratne et al., 2021) to social aspects, like gender and the inclusiveness of the BE (Shaleh et al., 2020). Particularly noteworthy are articles that present indicators of the BE (Smith-Godfrey,
2021) and that calculate its potential (Reinertsen & Asdal, 2019). Tools and data for indicators have been prepared by the European Commission and the OECD (Organisation for Economic Cooperation and Development). The selec- tion of indicators, based on the available data, was included in the research results.
The BE is a vital area for the EU because of its leadership in adopting the EU’s Sustainable Development Goals and the transformation to climate neu- trality, taking into account the principles of the European Green Deal (EC, 2019a). This issue can be found not only in dedicated reports commissioned by the European Commission that present figures but also in planning docu- ments. Therefore, it is worth looking at the most essential principles of the EU program in this area.
In May 2021, the Commission announced: “a new approach for a sustain- able blue economy in the EU Transforming the EU’s Blue Economy for a Sus- tainable Future” (EC, 2021). It emphasised that the EU’s blue economy should be put on a more sustainable path to “become a font of action and ideas cre- ating innovation, spurring fast and lasting recovery and protecting our planet.” That is why the Commission has presented an agenda of activities for the BE in areas like:
• decarbonising and depolluting energy production, maritime transport and ports;
• decreasing the main sources of pollution in seas and promoting recycling;
• preserving and restoring marine biodiversity;
• climate resilience for coastal areas;
• creating responsible food systems;
• developing conditions to deepen ocean knowledge needed for the transi- tion to a sustainable BE;
• research and innovation;
• investment;
• developing blue skills and blue jobs.
The transformation of the BE will be achieved with dedicated solutions and instruments: the BlueInvest platform, the BlueInvest Fund, and the EU-sponsored Sustainable Blue Economy Finance Initiative (EC, 2021). This Commission communication replaces an earlier one adopted in 2012 entitled
“Blue Growth opportunities for marine and maritime sustainable growth”
(EC, 2012) which identified factors to develop the BE:
• rapid technological progress in working off-shore in ever deeper waters;
• awareness that land and freshwater are finite resources;
• the need to reduce greenhouse gas emissions.
Activities undertaken by the European Commission are aimed at sup- porting the EU member states in developing not only the BE but a sustainable blue economy. Furthermore, the BE should contribute to achieving the goals
of the European Green Deal by (Sustainable Blue Economy – Questions and answers):
• a 90% reduction of greenhouse gas emissions from maritime transport;
• minimising the environmental impacts of fishing on marine habitats;
• making BE sectors more circular;
• expanding off-shore renewable energy;
• contributing to the transition towards a sustainable, low-carbon food system in line with the EU’s farm-to-fork strategy;
• developing nature-based solutions to adapt to rising sea levels, depollute areas, or fight eutrophication.
The proposed objectives seem overly ambitious given the relatively short time frame to address this issue at the EU level.
Polish government documents make no direct reference to the principles, goals, or actions in the field of the BE, neither those concerning climate and energy policies, nor the environmental policy, maritime policy, or, more broadly, the strategy of socio-economic development. They only indicate the issue of developing off-shore wind energy (MKiŚ, 2021) and building green ships. However, they highlight the environmental protection of the Baltic Sea.
In Polish studies, there are increasing references to the maritime economy and its branches. The EU approach lacks a conceptual framework to incorpo- rate elements of the circular economy and sustainability more broadly.
There is no direct reference to the BE in governmental or ministerial doc- uments, so it is worth referring to the strategies of provinces located in coastal areas. In Poland, there are three voivodeships in coastal areas, each with its development strategy. In the “Strategy of West Pomeranian Voivod- ship Development to 2030,” the issue of the BE is highlighted in the mission
“West Pomerania – a leader in blue and green growth with high quality of life”
(Urząd Marszałkowski Województwa Zachodniopomorskiego, 2019, p. 38).
The issue is specified within the framework of the second strategic objective called “The dynamic economy and specific objective – 2.2. strengthening the economy that uses the natural potential of the region.”
Pomerania’s strategy refers to the maritime economy, taking into account the ports and their importance in oceanic maritime services; the lack of qual- ified staff in this sector; the transformation of the economy through the development of “sectors related to adapting to climate change, thanks to which new jobs are created, services are developed that enable the popula- tion to benefit from the environment sustainably.” The “Resilient Economy”
Strategic Goal pointed out the need to shape conditions for the development of modern industries related to the economical use of marine resources and marine areas with respect for the environment (Sejmik Województwa Pomorskiego, 2021, p. 37, 42, 62, 126).
In the strategy for the Warmińsko-Mazurskie voivodship, the term “blue economy” was not mentioned; however, it highlights the issue of “developing modern technologies and innovations connected with sustainable use of environmental resources (e.g., Renewable Energy Sources, the green econ- omy, the circular economy)”; developing the tourism sector based on sustain- able tourism principles; “transition to a circular economy (waste manage- ment, eco-innovation, resource-efficient go-economy, green entrepreneur- ship, cleaner production, extending the life of products on the market, etc.)”
(Warmińsko-Mazurskie 2030, 2020, p. 38, 52). A review of the regions’ stra- tegic documents leaves no doubt that there is no explicit statement of the need for transformation towards a “new blue economy”. At the same time, it should be appreciated that the economic development of regions in the spirit of transforming into a circular economy using and cultivating regions’ natu- ral resources is vital.
Research methods
To determine the degree of implementation of the BE in Poland compared to other EU member states, an analysis of data related to the following sec- tors identified by the European Union was carried out: marine and coastal tourism, marine living resources, non-living marine resources, port activi- ties, primary production fish production, shipbuilding and repair, and mari- time transport (Eurostat, 2020). Due to the limited data availability, the pri- mary criterion for selecting the analysed indicators was availability. All avail- able data constituting an essential element of the blue economy development were analysed in the study (they are described in the analysis, in chapter results).
In the available databases, there are no data on coastal and maritime tourism by EU country (the available data refer to the whole sector). There- fore we used data on bathing sites with excellent water quality by locality.
The indicator measures the number and proportion of coastal and inland bathing sites with excellent water quality. The indicator assessment is based on microbiological parameters (intestinal enterococci and Escherichia coli).
The new Bathing Water Directive requires the Member States to identify and assess the quality of all inland and marine bathing waters and to classify these waters as ‘poor’, ‘sufficient’, ‘good’ or ‘excellent’.
Results
Emerging and innovative BE sectors include marine renewable energy (i.e., ocean energy, floating solar energy, and off-shore hydrogen generation), blue bioeconomy and biotechnology, marine minerals, desalination, mari- time defence, security and surveillance, research and education, and infra- structure and marine works (submarine cables, robotics). These sectors offer significant potential for economic growth, sustainability transition, as well as employment creation. The most recent analysis of these sectors in the EU Member States conducted by the European Commission and the European Statistical System shows that the established sectors of the EU’s BE directly employed close to 4.5 million people. It generated around €650 billion in turnover and €176 billion in gross value added. For the established sectors, two sectors are particularly noteworthy: living resources (turnover reached
€117.4 billion, 26% more than in 2009, while gross profits were valued at
€7.3 billion in 2018, a 43% rise on 2009 (€5.1 billion)) and marine renewa- ble energy (off-shore wind), which has also seen growth (employment increased by 15% in 2018 compared to 2017) (EU, 2021).
Emerging marine renewable energy will be essential if the EU is to meet its goals indicated in the European Green Deal and the newly published “Off- shore Renewable Energy Strategy”. The last option proposes an increase in off-shore wind capacity from 12 GW to 300 GW by 2050, complemented with 40 GW of ocean energy and other emerging technologies by 2050. The most notable area related to the blue bioeconomy is the algae sector. Although recent socio-economic data are available for only a limited number of Mem- ber States (France, Spain and Portugal), turnover for these countries amounted to €10.7 million. In terms of desalination, there are currently 2309 operational desalination plants in the EU, which produce about 9.2 million cubic meters per day. As climate change may lead to hotter and dryer sum- mers, certain countries must ensure water supply; hence, they have invested in desalination (EU, 2021).
In relation to research and education, developing the right skills in the off-shore renewable energy sector is critical. Currently, 17-32% of compa- nies are experiencing skills gaps, while in technical occupations, 9 to 30% are experiencing skills shortages. In the future, to attract young workers and re/
upskill workers to off-shore renewable energy jobs, Member States will need to provide more education and training schemes that target the off-shore renewable energy sector in line with their expected development targets.
Almost €500 billion worth of services is generated annually within a 10km coastal zone in the EU. However, rising sea levels, which will lead to increased coastal erosion, are projected to decrease this value by more than €15 billion
annually. Further, the loss of 1-1.3% of land and inland waters would result in a 4.3-5.4% decline in the value of their ecosystem services, i.e., from €360 to
€341–344 billion per year (EU, 2021).
As Figure 2 shows, the number of quality bathing sites in Poland is well below the EU average, which can directly translate into the number of tour- ists and, therefore, revenues for the industry. Unlike the EU average, the data for Poland showed an upward trend.
Figure 2. Bathing sites with excellent water quality in the EU and Poland [number]
Source: authors’ work based on Eurostat (2022).
Figure 3. The surface of marine sites designated under Natura 2000 Poland compared to UE [km2]
Source: authors’ work based on Eurostat (2022).
In order to compare the marine living resources and marine non-living resources sectors in Poland with the EU average, the analysis included data on the surface of marine sites designated under Natura 20001. The data in
1 The indicator measures the surface of marine sites designated under Natura 2000.
The Natura 2000 network comprises both marine and terrestrial protected areas
F2
0 100 200 300 400 500 600
2011 2012 2013 2014 2015 2016 2017 2018 2019 2020 Average EU Bathing Poland Bathing
F3
0 5000 10000 15000 20000
2013 2014 2015 2016 2017 2018 2019 2020
Average UE marine sites Poland marine sites
DOI: 10.34659/eis.2022.82.3.465
Figure 3 show performance below the EU average, with a constant trend line for Poland but increasing for the EU.
For Port activities, Shipbuilding and repair, and Maritime transport, the following data were analysed:
• Catches – major fishing areas (from 2000 onwards); Figure 4 shows that the results for Poland are below the EU average, with a decreasing trend line for the EU and an increasing trend line for Poland,
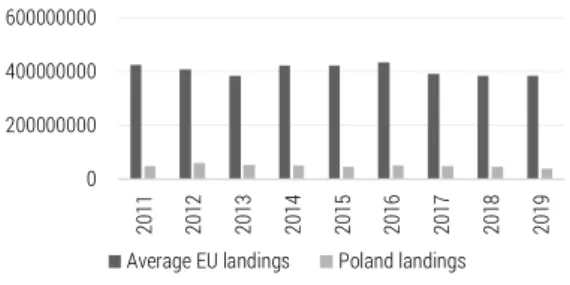
• Landings of fishery products – Figure 5 shows that the results for Poland are significantly below the EU average, with decreasing trend lines for both the EU and Poland,
• Fishing fleet by age, length and gross tonnage – Figure 6 shows that Poland is significantly below the EU average, with a decreasing trend line for the EU and Poland,
• Country-level – the gross weight of goods handled in all ports. Figure 7 shows that the results for Poland are significantly below the EU average, with an increasing trend line for the EU and Poland,
• The gross weight of seaborne goods handled in ports – Figure 8 shows that Poland is below the EU average, with a decreasing trend line for the EU but an increasing trend line for Poland.
designated under the EU Habitats and Birds Directives with the goal of maintaining or restoring a favourable conservation status for habitat types and species of EU inter- est. Each country must fill in a standard data form where sites designated under the Directives are reported in detail, including the size of the site in km2, the existing habitats and species, and their percentage cover of the site. A thorough typology has been developed to support precise reporting.
F 4-7
0 100000 200000 300000 400000
2011 2012 2013 2014 2015 2016 2017 2018 2019
Average EU Catches Poland Catches
0 200000000 400000000 600000000
2011 2012 2013 2014 2015 2016 2017 2018 2019
Average EU landings Poland landings
0 1000 2000 3000 4000
2011 2012 2013 2014 2015 2016 2017 2018 2019 2020
Average EU Fishing Poland Fishing
0 50000 100000 150000
2012 2013 2014 2015 2016 2017 2018 2019 2020 2021
Suma z Average UE Poland transport of goods
Figure 4. Catches – major fishing areas (from 2000 onwards) in Poland compared to the EU [tonnes live weight]
Source: authors’ work based on Eurostat (2022).
Figure 5. Landings of fishery products in Poland compared to the EU [number]
Source: author’s based on Eurostat (2022).
EKONOMIA I ŚRODOWISKO 3 (82) • 2022 Environmental policy and management
87
F 4-7
0 100000
2011 2012 2013 2014 2015 2016 2017 2018 2019
Average EU Catches Poland Catches
0 200000000
2011 2012 2013 2014 2015 2016 2017 2018 2019
Average EU landings Poland landings
0 1000 2000 3000 4000
2011 2012 2013 2014 2015 2016 2017 2018 2019 2020
Average EU Fishing Poland Fishing
0 50000 100000 150000
2012 2013 2014 2015 2016 2017 2018 2019 2020 2021
Suma z Average UE Poland transport of goods
Figure 6. Fishing fleet by age, length and gross tonnage in Poland compared to the EU [gross tonnage]
Source: author’s based on Eurostat (2022).
Figure 7. Country-level – the gross weight of goods handled in all ports in Poland compared to the EU [thousand tonnes]
Source: author’s based on Eurostat (2022).
Figure 8. The gross weight of seaborne goods handled in ports in Poland compared to the EU[thousand tonnes]
Source: author’s work based on Eurostat (2022).
F8
0 50000 100000 150000
2009 2010 2011 2012 2013 2014 2015 2016 2017 2018 2019 2020 Avrage EU seaborne goods Poland seaborne goods
In order to determine the degree of development of economic activities related to oceans, seas, and coasts in Poland, the following data were ana- lysed (Eurostat, 2022):
• Total maritime economy entities,
• Maritime economy entities in the field of research and development (R&D) and maritime education,
• Total maritime employees,
• R&D employees and maritime education,
• Cargo turnover in seaports [thousand tonnes],
•
• Capital expenditures, total current prices [PLN million]2,
• Ship production,
• Fishing for marine fish and invertebrates [tonnes],
• Catches of marine and freshwater fish in marine waters and inland waters [tonnes],
• Tourists, total (sea and coastal tourism)3,
• Accommodation facilities.
As shown in Figures 9 to 19, almost all variables recorded an increasing trend line from 2010 to 2020 and a percentage increase in 2020 relative to 2010 in Poland. The exception is the production of ships, where a significant decrease was recorded. Data analysis shows that:
• total maritime economy entities increased 58.6% by 2020 compared to 2010,
• maritime economy entities in the field of R&D and maritime education- increased by 43% by 2020 compared to 2010,
• total employees- increased 98% by 2020 compared to 2010,
• employees’ R&D and maritime education increased 6.3 % by 2020 com- pared to 2010,
• capital expenditures, total current prices increased 57.7% by 2020 com- pared to 2010,
• cargo turnover in seaports increased 32.7% by 2020 compared to 2010,
• ship production- decreased 66.6 % by 2020 compared to 2010,
• fishing for marine fish and invertebrates increased 10.8% by 2020 com- pared to 2010,
• catches of marine and freshwater fish in marine waters, in marine and inland waters- increased 12.6 % by 2020 compared to 2010,
• tourists- decreased 28.7% by 2020 compared to 2010,
• accommodation facilities- increased 10.4 % by 2020 compared to 2010.
Data on the number of tourists and the number of accommodation facili- ties between 2014 and 2019 (Figures 18 and 19; the analysis period was nar- rowed due to data availability) indicate a decreasing trend line and a decrease in the number of tourists in 2019 relative to 2014. The number of accommo-
2 Investment outlays are financial or tangible outlays to create new fixed assets or improve (rebuilding, enlargement, reconstruction or modernisation) existing capital asset items, as well as outlays on initial investments.
3 According to the Eurostat methodology adopted for tourism statistics, a coastal area is considered to consist of municipalities (in other countries, the corresponding administrative units) bordering the sea or located near it. Maritime areas are classi- fied according to the distance of the commune from the sea: if the commune borders the sea, it is, in principle, a maritime area; if the commune does not border the sea, but 50% of its area is within 10 km from the sea, it is also considered a maritime commune.
DOI: 10.34659/eis.2022.82.3.465
dation facilities is characterised by an increasing trend line, although there is a decrease after 2018. The subject of this study is not to explain trends but to indicate them. The explanation is an open question for further research.
F 9-14
0 5000 10000 15000 20000 25000 30000
2010 2011 2012 2013 2014 2015 2016 2017 2018 2019 2020 0
50 100 150 200
2010 2011 2012 2013 2014 2015 2016 2017 2018 2019 2020
0 50000 100000 150000 200000
2010 2011 2012 2013 2014 2015 2016 2017 2018 2019 2020
0 1000 2000 3000 4000 5000
2010 2011 2012 2013 2014 2015 2016 2017 2018 2019 2020
0 1000 2000 3000 4000
2010 2011 2012 2013 2014 2015 2016 2017 2018 2019 2020 0
20000 40000 60000 80000 100000
2010 2011 2012 2013 2014 2015 2016 2017 2018 2019 2020
Figure 9. Total maritime economy entities [number]
Source: author’s based on Eurostat (2022).
Figure 10. Maritime economy entities in the field of R&D and maritime education [number]
Source: author’s based on Eurostat (2022).
Figure 11. Total employees [number]
Source: author’s based on Eurostat (2022).
Figure 12. Employees, R&D and maritime education
Source: author’s based on Eurostat (2022).
EKONOMIA I ŚRODOWISKO 3 (82) • 2022 Environmental policy and management
90
DOI: 10.34659/eis.2022.82.3.465
F 9-14
0 5000 10000 15000 20000
2010 2011 2012 2013 2014 2015 2016 2017 2018 2019 2020 0
50 100
2010 2011 2012 2013 2014 2015 2016 2017 2018 2019 2020
0 50000 100000 150000 200000
2010 2011 2012 2013 2014 2015 2016 2017 2018 2019 2020
0 1000 2000 3000 4000 5000
2010 2011 2012 2013 2014 2015 2016 2017 2018 2019 2020
0 1000 2000 3000 4000
2010 2011 2012 2013 2014 2015 2016 2017 2018 2019 2020 0
20000 40000 60000 80000 100000
2010 2011 2012 2013 2014 2015 2016 2017 2018 2019 2020
Figure 13. Capital expenditures, total current prices [PLN million]
Source: author’s based on Eurostat (2022).
Figure 14. Cargo turnover in seaports [thou. tonne]
Source: author’s based on Eurostat (2022).
0 5 10 15 20 25 30
2010 2011 2012 2013 2014 2015 2016 2017 2018 2019 2020 0
50000 100000 150000 200000 250000
2010 2011 2012 2013 2014 2015 2016 2017 2018 2019 2020
190 200 210 220 230 240 250 260 270
2010 2011 2012 2013 2014 2015 2016 2017 2018 2019 2020
0 5000000 10000000 15000000 20000000 25000000 30000000 35000000 40000000
2014 2015 2016 2017 2018 2019
600000 650000 700000 750000 800000 850000
2014 2015 2016 2017 2018 2019
F 15-19
0 5 10 15 20 25 30
2010 2011 2012 2013 2014 2015 2016 2017 2018 2019 2020 0
50000 100000 150000 200000 250000
2010 2011 2012 2013 2014 2015 2016 2017 2018 2019 2020
190 200 210 220 230 240 250 260 270
2010 2011 2012 2013 2014 2015 2016 2017 2018 2019 2020
0 5000000 10000000 15000000 20000000 25000000 30000000 35000000 40000000
2014 2015 2016 2017 2018 2019
600000 650000 700000 750000 800000 850000
2014 2015 2016 2017 2018 2019
Figure 15. Ship production [number]
Source: author’s based on Eurostat (2022).
Figure 16. Fishing for marine fish and invertebrates [tonnes]
Source: author’s based on Eurostat (2022).
Figure 17. Catches of marine and freshwater fish in marine waters, in marine and inland waters [tonnes]
Source: author’s based on Eurostat (2022).
Figure 18. Tourists, total (sea and coastal tourism) Source: author’s based on Eurostat (2022).
EKONOMIA I ŚRODOWISKO 3 (82) • 2022 Environmental policy and management
91
F 15-19
0 5 10 15 20
2010 2011 2012 2013 2014 2015 2016 2017 2018 2019 2020 0
50000 100000 150000
2010 2011 2012 2013 2014 2015 2016 2017 2018 2019 2020
190 200 210 220 230 240 250 260 270
2010 2011 2012 2013 2014 2015 2016 2017 2018 2019 2020
0 5000000 10000000 15000000 20000000 25000000 30000000 35000000 40000000
2014 2015 2016 2017 2018 2019
600000 650000 700000 750000 800000 850000
2014 2015 2016 2017 2018 2019
Figure 17. Catches of marine and freshwater fish in marine waters, in marine and inland waters [tonnes]
Source: author’s based on Eurostat (2022).
Figure 18. Tourists, total (sea and coastal tourism) Source: author’s based on Eurostat (2022).
Figure 19. Accommodation facilities [number]
Source: author’s based on Eurostat (2022).
The data analysis indicates that Poland achieves values below the EU average for all BE sectors. However, the increasing trend line for almost all selected indicators indicates the correct direction of development, while the OECD report confirms the high potential of the Polish coastal economy (OECD, 2017, p. 35-53). Unfortunately, the detailed data analysis indicates that the recorded growth is low (indicators such as R&D employees and mar- itime education, fishing, accommodation facilities, and catches of marine and freshwater fish have an average growth of 10% over ten years). Adding to this the decline in indicators for the number of tourists and ship production, we conclude that the BE principles in Poland have been implemented at a low level and that it is necessary to formulate an action plan which will make it possible to utilise BE principles as an element of its potential and an essential factor for the development of the Polish coastal economy.
The Polish policy framework for the BE is fragmented. The governance structure is complex, involving several ministries and administration bodies, as each BE sector is addressed separately. This, in turn, undermines the implementation of spatial planning in maritime areas and inland waters, making it difficult to favour the co-development of economic activities such as tourism, off-shore wind energy, seabed resources extraction, aquaculture, or transport. It also makes it difficult to manage conflicts between various sectors and place the green economy at the heart of activities (OECD, 2017, p.
23-32).
Implementing the BE in Poland’s maritime and coastal economy benefits not only the tourist industry and recreational activities sectors but also new sectors such as blue biotechnology. Nevertheless, a number of obstacles undermine developments, such as the fragmented policy framework and decision-making process, conflicting interests over the use of space, lack of financing opportunities, and skills shortages, in particular, for technicians (OECD, 2017, p. 57-67).
Conclusions
The blue economy concept needs to be clarified due to the lack of a single clear definition, as well as the ambiguously defined scope, i.e., which sectors does it apply to? Only those related directly or indirectly to the oceans? Does it also apply to land, or only to the coastal environment and deep waters?
(Voyer, 2018). The authors of the study proposed their definition, which may be the subject of consideration in this area among Polish researchers
The introduction of the BE concept will facilitate the achievement of the European Green Deal objectives and complement other recent Commission initiatives on biodiversity, food, mobility, security, data, and more. The cited benefits of adopting the BE concept include:
• mitigating climate change through the development of marine renewable energy,
• decarbonising maritime transport and greening ports will make the economy more circular through renewed standards for fishing gear design, ship recycling, and the decommissioning of off-shore platforms, maintaining the balance of marine ecosystems,
• developing green infrastructure in coastal areas will help preserve biodi- versity and landscapes, benefiting tourism and the coastal economy.
Other benefits include contributing to food security, creating new jobs, eradicating poverty and ensuring the health, security, justice, and political stability (Sustainable Blue Economy).
The major challenges of the BE include rising sea levels, extreme weather events, excessive and inappropriate human exploitation of aquatic environ- ments, and lack of regulation (Failler et al., 2021).
With adequate resources at its disposal, Poland has great potential to support economic development and improve the quality of life while reduc- ing anthropogenic pressure on the environment through the introduction of solutions in the field of BE. The main limitations include:
• a lack of appropriate policy or institutional and organisational structure,
• a lack of data, information, and knowledge in the field of innovation and diversification of maritime products and services,
• a lack of marketing strategies, scientific research,
• a low qualified labour force and low social awareness of marine safety
• a lack of awareness of the need to care for the marine and coastal envi- ronment.
To achieve sustainable blue growth in Poland, a strategic planning and management framework is needed that should focus on potential sectors, research, and ocean management. Enhancing blue growth is an integral part of achieving the Sustainable Development Goals (SDGs).
Potential costs of transforming to the BE include:
• investments related to greening up traditional maritime and coastal sec- tors;
• retraining employees;
• necessary modifications of, e.g., port infrastructure.
Taking into account the potential opportunities and costs of transforming the Polish maritime and coastal economy into the Blue economy, there is a need for a systemic approach that involves all market economy subjects and a broad range of instruments, including planning, organisation, legal, and financial.
The contribution of the authors
Conception – D. Michalak (50%), P. Szyja (50%).
Literature review – D. Michalak (50%), P. Szyja (50%).
Acquisition of data – D. Michalak (50%), P. Szyja (50%).
Analysis and interpretation of data – D. Michalak (50%), P. Szyja (50%).
References
Aberkane, I. J. (2017). From Waste to Kwaste: On the Blue Economy in Terms of Knowledge Flow. In P. Bourgine, P. Collet, & P. Parrend (Eds.). First Complex Sys- tems Digital Campus World E-Conference 2015. Springer Proceedings in Com- plexity (pp. 283-290). Cham: Springer. https://doi.org/10.1007/978-3-319- 45901-1_31
Alam, A. (2021). Regional Marine Spatial Planning: A Tool for Greening Blue Economy in the Bay of Bengal. In A. Carpenter, T. M. Johansson, & J. A. Skinner (Eds.). Sus- tainability in the Maritime Domain. Strategies for Sustainability (pp. 61-80).
Cham: Springer. https://doi.org/10.1007/978-3-030-69325-1_3
Alongi, D. M. (2018). The Blue Economy: Mitigation and Adaptation. In Blue Carbon (pp. 59-84). Springer Briefs in Climate Studies. Cham: Springer. https://doi.
org/10.1007/978-3-319-91698-9_6
Bateman, I., & Turner, R. (1993). Valuation of the environment, methods and tech- niques: The contingent valuation method. In R. K. Turner (Ed.). Sustainable Envi- ronmental Economics and Management: Principles and Practice (pp. 120–191).
Belhaven Press.
Blue Generation Project. Career guide. Blue Economy Jobs for young people. https://
bluegeneration.careers/BlueGeneration_Blue%20Career%20Guide_en.pdf Brears, R. C. (2021). Sustainable Fisheries. In Developing the Blue Economy. Cham:
Palgrave Macmillan. https://doi.org/10.1007/978-3-030-84216-1_4
Burness, H. S., Cummings, R. G., Ganderton, P. T., & Harrison, G. W. (1991). Valuing Environmental Goods: A Critical Appraisal of the State of the Art. In A. Dinar & D.
Zilberman (Eds.), The Economics and Management of Water and Drainage in
Agriculture (pp. 431–445). Springer US. https://doi.org/10.1007/978-1-4615- 4028-1_22
Cummings, G., & Greenberg, Z. (2021). Sustainable Tourism in the Context of the Blue Economy. In W. Leal Filho, A. M. Azul, L. Brandli, A. Lange Salvia, & T. Wall (Eds).
Life Below Water. Encyclopedia of the UN Sustainable Development Goals. Cham:
Springer. https://doi.org/10.1007/978-3-319-71064-8_56-1
Dębski, M. (2015). Zarządzanie w regionie turystycznym. „Przedsiębiorczość i zarzą- dzanie”, 4.
Duarte, É. (2016). Brazil, the Blue Economy and the maritime security of the South Atlantic. Journal of the Indian Ocean Region, 12/1, 97-111. https://doi.org/10.1 080/19480881.2015.1067384
EC. (2012). Communication from the Commission to the European Parliament, the Council, the European Economic and Social Committee and the Committee of the Regions Blue Growth -opportunities for marine and maritime sustainable growth. Brussels, 13.9.2012. COM(2012) 494 final. https://eur-lex.europa.eu/
legal-content/EN/TXT/PDF/?uri=CELEX:52012DC0494&from=EN
EC. (2019a). Communication from the Commission. The European Green Deal. Brus- sels, 11.12.2019, COM(2019) 640 final. https://eur-lex.europa.eu/legal-content/
EN/TXT/?qid=1588580774040&uri=CELEX%3A52019DC0640
EC. (2019b). The Blue Economy Report. 2019. Directorate General for Maritime Affairs and Fisheries, and the Joint Research Centre.
EC. (2021). Communication from the Commission to the European Parliament, the Council, the European Economic and Social Committee and the Committee of the Regions Empty on a new approach for a sustainable blue economy in the EU.
Transforming the EU’s Blue Economy for a Sustainable Future. Brussels, 17.5.2021. COM(2021) 240 final. https://eur-lex.europa.eu/legal-content/EN/
TXT/?uri=COM:2021:240:FIN
EC. (2022a, May 12). Blue bioeconomy. What the blue bioeconomy is, and how research and innovation supports EU blue growth policy and the European Green Deal. https://research-and-innovation.ec.europa.eu/research-area/environ- ment/bioeconomy/blue-bioeconomy_en
EC. (2022b, May 12). European Green Deal: Developing a sustainable blue economy in the European Union. 17 May 2021. https://ec.europa.eu/commission/press- corner/detail/en/ip_21_2341.
Ertör, I., & Hadjimichael, M. (2020). Blue degrowth and the politics of the sea: rethink- ing the blue economy. Sustainability Science 15, 1–10. https://doi.org/10.1007/
s11625-019-00772-y
EU. (2021).The Eu Blue Economy Report 2021. Directorate General for Maritime Affairs and Fisheries, and the Joint Research Centre.
Eurostat (2022), https://ec.europa.eu/eurostat/data/database
Failler, P., Hussain, M. G., & Karim A. A. (2021) The future of the blue economy in Bangladesh. BMJ Bangladesh Maritime Journal, 15-29.
Paulli, G. (2022, May 12). 10 years. 100 innovations, 100 million jobs. https://www.
gunterpauli.com/the-blue-economy.html
Jagtap, A. S., Manohar, C. S., Ayyapankutty, & Meena, S. N. (2021). Antioxidant and Antiglycemic Properties of Macroalgae, an Underutilized Blue Economy Biore- source in India. Russ J Mar Biol 47, 489–497. https://doi.org/10.1134/
S1063074021060067
Knowlton, H. (2008). Zeri: A Philosophy and Methodology to Reinvent the World.
Friends Journal. October 1, 2008. https://www.friendsjournal.org/2008120/
Kraus, N., Kraus, K., & Osetskyi V. (2021). Green Business in Blue Economy: Quality Management and Development of Innovative Products. In S.K. Ghosh, K. Ghosh, S.
Das, P.K. Dan, & A. Kundu (Eds.) Advances in Thermal Engineering, Manufacturing, and Production Management. ICTEMA 2020. Lecture Notes in Mechanical Engi- neering (pp. 383-394). Singapore: Springer. https://doi.org/10.1007/978-981- 16-2347-9_33
Ki-Hoon, L., Noh J., & Khim J.S. (2020). The Blue Economy and the United Nations’
sustainable development goals: Challenges and opportunities. Environment international, 137, 105528. https://doi.org/10.1016/j.envint.2020.105528 Martínez-Vázquez, R.M., Milán-García, J., & de Pablo Valenciano, J. (2021). Challenges
of the Blue Economy: evidence and research trends. Environmental Sciences Europe, 33, 61. https://doi.org/10.1186/s12302-021-00502-1
Mickiewicz, M. (2012). Zasady i uwarunkowania zrównoważonego korzystania z zasobów rybackich, Olsztyn: Wydawnictwo Instytutu Rybactwa Śródlądowego.
Midlen, A. (2021). What is the Blue Economy? A spatialised governmentality perspec- tive. Maritime Studies 20, 423-448 https://doi.org/10.1007/s40152-021- 00240-3
MKiŚ (2021). Polityka energetyczna Polski do 2040 r. Warszawa.
Mohanty, S. K., & Dash, P. (2020). Economic Opportunities in Blue Economy in Africa.
In S. Chaturvedi, A. Prakash, & P. Dash (Eds.) Asia-Africa Growth Corridor (pp.
89-110). Singapore: Springer. https://doi.org/10.1007/978-981-15-5550-3_6 OECD (2017). Greening the Blue Economy in Pomorskie, Poland, OECD Green Growth
Studies. Paris OECD: Publishing. https://doi.org/10.1787/9789264281509-en.
Okafor-Yarwood, I., Kadagi, N. I., Miranda, N. A. F., Uku, J., Elegbede, I. O., Ibukun, J. &
Adewumi, I. J. (2020). The Blue Economy–Cultural Livelihood–Ecosystem Con- servation Triangle: The African Experience. Frontiers in Marine Science, 7:586.
https://doi.org/10.3389/fmars.2020.00586
Outa, G. O., Osano, P. M., Muchiri, M., Njiru, J., Kagwanja, P., Akech, N. O., Matiri-Maisori, B., Otieno, S., Omosa, J., Onkoba, J., Nabukwesi, S., & Allela, A. A. (2021). Science, Research and Innovation for Harnessing the Blue Economy. Nairobi: Government of Kenya & Stockholm Environment Institute – Africa Centre. https://mfa.go.ke/
storage/2021/11/Sustainable_Blue_Economy_Conf_Book.pdf
Reinertsen, H, & Asdal, K. (2019). Calculating the blue economy: producing trust in numbers with business tools and reflexive objectivity. Journal of Cultural Econ- omy, 12/6, 552-570. https://doi.org/10.1080/17530350.2019.1639066 Satizábal, P., Dressler, W. H., Fabinyi, M. et al. (2020). Blue economy discourses and
practices: reconfiguring ocean spaces in the Philippines. Maritime Studies 19, 207–221. https://doi.org/10.1007/s40152-020-00168-0
Sejmik Województwa Pomorskiego. (2021). Uchwała nr 376/XXXI/21 Sejmiku Województwa Pomorskiego z dnia 12 kwietnia 2021 roku. Strategia Rozwoju Województwa Pomorskiego 2030.
Senaratne, M., Zimbroff ,A., & Stevens, J.T. (2021). An instrument to assess Blue Econ- omy entrepreneurship ecosystems: a case study from the Seychelles. Journal of the Indian Ocean Region, 17/2, 205-223. https://doi.org/10.1080/19480881.20 21.1969516
Shaleh, S. R. M., Fui-Fui, C., & Mustafa, S. (2020). Gender Roles in Inclusive Blue Econ- omy. In W. Leal Filho, A. Azul, L. Brandli, A. Lange Salvia, & T. Wall (Eds.) Gender
![Figure 2. Bathing sites with excellent water quality in the EU and Poland [number]](https://thumb-eu.123doks.com/thumbv2/9liborg/19505613.0/12.722.95.578.279.467/figure-bathing-sites-excellent-water-quality-poland-number.webp)
![Figure 3. The surface of marine sites designated under Natura 2000 Poland compared to UE [km 2 ]](https://thumb-eu.123doks.com/thumbv2/9liborg/19505613.0/12.722.91.581.546.752/figure-surface-marine-sites-designated-natura-poland-compared.webp)
![Figure 4. Catches – major fishing areas (from 2000 onwards) in Poland compared to the EU [tonnes live weight]](https://thumb-eu.123doks.com/thumbv2/9liborg/19505613.0/13.722.90.369.528.663/figure-catches-fishing-onwards-poland-compared-tonnes-weight.webp)
![Figure 6. Fishing fleet by age, length and gross tonnage in Poland compared to the EU [gross tonnage]](https://thumb-eu.123doks.com/thumbv2/9liborg/19505613.0/14.722.401.675.111.249/figure-fishing-fleet-length-tonnage-poland-compared-tonnage.webp)
![Figure 8. The gross weight of seaborne goods handled in ports in Poland compared to the EU[thousand tonnes]](https://thumb-eu.123doks.com/thumbv2/9liborg/19505613.0/14.722.103.583.425.607/figure-weight-seaborne-handled-poland-compared-thousand-tonnes.webp)
![Figure 7. Country-level – the gross weight of goods handled in all ports in Poland compared to the EU [thousand tonnes]](https://thumb-eu.123doks.com/thumbv2/9liborg/19505613.0/14.722.89.372.110.252/figure-country-weight-handled-poland-compared-thousand-tonnes.webp)
![Figure 10. Maritime economy entities in the field of R&D and maritime education [number]](https://thumb-eu.123doks.com/thumbv2/9liborg/19505613.0/16.722.387.679.252.424/figure-maritime-economy-entities-field-maritime-education-number.webp)
![Figure 9. Total maritime economy entities [number]](https://thumb-eu.123doks.com/thumbv2/9liborg/19505613.0/16.722.88.362.251.426/figure-9-total-maritime-economy-entities-number.webp)
