BUSINESS PROCESS MATURITY OF
THE TRANSPORT-FORWARDING-LOGISTICS SECTOR
IN POLAND
Piotr Sawicki* and Paweł Jaworek**
Division of Transport Systems, Poznan University of Technology, 3 Piotrowo, 61-138 Poznań, Poland,
* Email: piotr.sawicki@put.poznan.pl ** Email: p.jaworekk@gmail.com
Abstract: The paper deals with the evaluation of business process management development of the Polish TFL (Transport-Forwarding-Logistics) sector. Up to date, several studies of this type have been conducted, but TFL sector is marginally analysed or even omitted. Therefore, the authors have conducted research filling this gap. They have compared the results with the previous studies and have identified key determinants of the process maturity level. In the paper a general structure of the process maturity level at TFL sector in Poland has been defined. In particular, the lowest frequently occurred process maturity is level 3 (defined), which is typical for 15% of companies. The grades of other levels are bi-polarised below and above level 3. The largest group at TFL sector has been classified at level 2 (managed, 25%) and level 1 (initial, 19%), and the remaining companies are classified at level 5 (optimizing, 23%), and level 4 (quantitatively managed, 18%).
Paper type: Research Paper Published online: 30 August 2017
Vol. 7, No. 4, pp. 337–350
DOI: 10.21008/j.2083-4950.2017.7.4.6 ISSN 2083-4942 (Print)
ISSN 2083-4950 (Online)
© 2017 Poznan University of Technology. All rights reserved.
1. INTRODUCTION
A high level of competition for a long time characterizes the Transport-Forwarding-Logistics (TFL) sector. All the companies operating on that market are still seeking opportunities to ensure the process reliability while improving their productivity. The concept of process is associated with a structured set of activities, performed using necessary resources and achieving the intended result. A process is also determined by internal relations (its logic), as well as all interactions with the environment, including internal relations (i.e. with other company’s processes), and external relations (i.e. with customers and market) (Sawicki, 2013).
Due to suggested process complexity, as well as the level of competition within TFL sector, it is necessary to apply a systematic approach to design, implementa-tion, monitoring and improvement of processes carried out. Such a life cycle of the business process management (BPM) is the basis to ensure the processes reliability in a long time period and to achieve higher performances. The status of business process management at the company level is referred to the process maturity.
The notion of maturity in the organizations was first proposed by Crosby (1979) as a part of more general concept of total quality management, which aims to long and consequent way to excellence. Maturity is also commonly defined as the state of being complete, perfect, or ready (OUP, 2008).
The primary objective of any process maturity model is to determine the stage of organizational development and the path to move there. Becker et al. (2009) and Tarhan et al. (2016) explain that maturity model is a conceptual model that consists of a sequence of discrete maturity levels for a class of processes in one or more business domains, and represents an anticipated, desired, or typical evolutionary path for these processes. Many different standards for explanation of different levels of maturity exist, according to the domain it is applied to. Several studies have been conducted recently (e.g. Tarhan et al., 2016; van Looy et al., 2011) to analyse and compare more than 20 maturity models investigated in the literature. In the paper authors have applied the capability maturity model integration – CMMI, originally designed by the Software Engineering Institute (CEI, 2010) in a domain of software production. There are 5 different maturity levels, starting from 1 (the lowest) and lasting by 5 (the highest), which are detailed described in Tab. 1.
The problem considered in the paper deals with the evaluation of business proc-ess management development of the Polish TFL sector. Up to date, several studies of this type have been conducted (Tartanus, 2010; Tartanus, 2013; Sliż, 2016), but TFL sector is marginally represented there or even omitted. Therefore, the authors have conducted their own research filling this gap. The authors have also compared their results with the previous studies, as well as identified key determinants of the specific level of process maturity, including both general business and process management characteristics.
Table 1. The structure of CMMI model (SEI, 2010)
Level Name State of processes Results
L1 Initial
Unpredictable and reactive
Work gets completed but it is often delayed and over budget
L2 Managed
Managed on the project level
Projects are planned, performed, measured and controlled
L3 Defined
Proactive, rather than reactive
Organization-wide standards provide guidance across projects, programs and portfolios
L4
Quantitatively managed
Measured and controlled
Organization is data-driven with quantitative
performance improvement objectives that are predictable and align to meet the needs of internal and external stakeholders
L5 Optimising Stable and flexible
Organization is focused on continuous improvement and is built to pivot and respond to opportunity and change. The organization’s stability provides a platform for agility and innovation.
2. PRINCIPLES OF THE RESEARCH METHODOLOGY
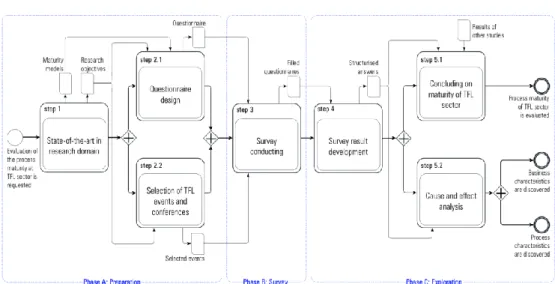
The research conducted by the authors is concentrated on evaluation of the process maturity of TFL sector in Poland. A scheme of the research methodology proposed in the paper is based on seven key steps (1, 2.1, …, 5.2), presented in Fig. 1. It is arranged around three phases, including preparation (A, steps: 1, 2.1 and 2.2), survey (B, step 3) and exploration (C, steps: 4, 5.1 and 5.2).Step 1 is called state-of-the-art in research domain, and is devoted to prepare all crucial research assumptions, including both, formulation of a precise research objectives and selection of the most appropriate maturity model to implement in the study. Based on these products, a questionnaire of the survey is designed during step 2.1. There are two key assumptions for the questionnaire design. First, the main purpose is to get an overall process maturity as well as discover general busi-ness and process management oriented characteristics typical for each level of process maturity. Secondly, to achieve comparability with previous study on proc-ess maturity, the same procproc-ess maturity model should be applied there. In the step 2.2 a selection of TFL professional events and conferences are selected for con-ducting a survey. It is assumed, that a direct survey should be performed to acquire more reliable answers. Based on the questionnaire and a list of selected events a survey is carried out in the step 3. During the survey a sample of expert’s opinions on process maturity in companies of TFL sector in Poland is collected. Each inter-view with expert is conducted with assistance of professional pollsters, equipped with questionnaires.
Fig. 1. The methodology of process maturity evaluation at TFL sector
All answers received from experts and professionals are then developed during step 4, and a structured results as a final product is processed during the last two steps. Based on that result a global evaluation of the TFL sector in Poland is con-cluded in step 5.1. Using results of other studies it is also possible to compare a process maturity of TFL with other sectors. The structured result achieved from step 4 is also applied to perform a cause-and-effect analysis in the step 5.2. Within this step a correlation-based analysis is performed to discover all the most impor-tant business and process oriented characteristics that are typical for each discrete level of process maturity (L1, …, L5).
3. RESULTS
3.1. Research remarks and assumptions
With respect to the suggested methodology (see previous section), following as-sumptions have been made:
• CMMI model (SEI, 2010) has been applied to the research,
• process maturity is defined by respondents (experts and professionals), during survey (subjective evaluation is applied).
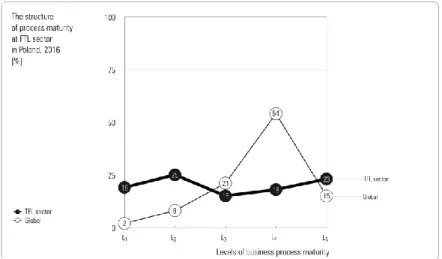
Based on the research conducted in 2016, the overall view of business process maturity at TFL sector in Poland has been formulated (Fig. 2). The lowest frequently occurring process maturity level at TFL sector is L3 (i.e. defined, see Tab. 1), typical for 15% of the companies. The grades of others are bipolarised
below and above L3. The largest group of TFL companies (a total of 44%) has been classified at L2 (managed) and L1 (initial), with 25% and 19% of companies, respectively. The remaining 41% of companies above L3 are classified as L5 (opti-mizing), and L4 (quantitatively managed), with 23% and 18% share, respectively.
Thus, two dominant levels of the process maturity (L2 and L5) show the discrep-ancies in the development of business processes management at TFL sector. The most frequent level L2 indicates that 25% of companies deal with the implementa-tion of the processes management at a very basic manner. On the other hand, only 23% of companies with the highest L5, are highly advanced with process continu-ous improvement and its optimization.
Comparing the results of process maturity at TFL sector with other studies, e.g. Tartanus (2016), (see Fig. 2) a higher number of TFL companies at L5 are ob-served. However, a substantial lower number of TFL companies are classified at the lowest levels, including L1 (approx. 9 times less) and L2 (approx. 4 times less). At the same time a slightly greater number of other companies is observed on
L3 and substantially higher at L5 (approx. 3 times more). This leads to the conclu-sion that companies at TFL sector are globally less advanced in evolution of proc-ess management than other sectors.
Fig. 2. The structure of process maturity at the TFL sector in Poland, 2016
3.2. Business determinants of process maturity
Taking into account a dependency between general business characteristics of the TFL companies (respondents) with the process maturity, four factors have been taken into consideration, including (1) location of the company’s headquarters, (2) portfolio diversification, (3) company size, and (4) ownership structure.
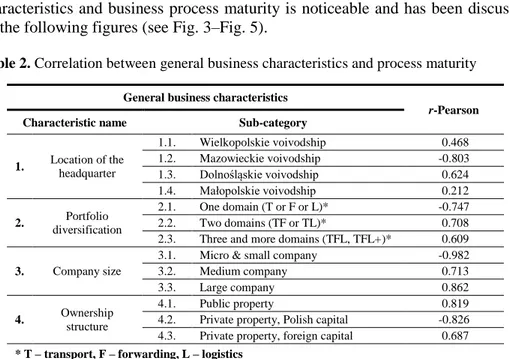
To assess the dependencies r-Pearson has been calculated, and its result is pre-sented in Tab. 2. There is any evident dependency between process maturity and the company's location. Value of r-Pearson in this case is significantly different, i.e. -0.802 vs. 0.212, and additionally, 2 out of 4 analysed relations are below the threshold of significance (0.212 and 0.468). The relationship between other three characteristics and business process maturity is noticeable and has been discussed on the following figures (see Fig. 3–Fig. 5).
Table 2. Correlation between general business characteristics and process maturity
General business characteristics
r-Pearson
Characteristic name Sub-category
1. Location of the headquarter
1.1. Wielkopolskie voivodship 0.468 1.2. Mazowieckie voivodship -0.803 1.3. Dolnośląskie voivodship 0.624 1.4. Małopolskie voivodship 0.212 2. Portfolio diversification 2.1. One domain (T or F or L)* -0.747 2.2. Two domains (TF or TL)* 0.708
2.3. Three and more domains (TFL, TFL+)* 0.609
3. Company size
3.1. Micro & small company -0.982
3.2. Medium company 0.713
3.3. Large company 0.862
4. Ownership
structure
4.1. Public property 0.819
4.2. Private property, Polish capital -0.826
4.3. Private property, foreign capital 0.687
* T – transport, F – forwarding, L – logistics
The analysis of those characteristics leads to the following conclusions. The de-gree of portfolio diversification is significantly associated with the process maturity (Fig. 3) for levels L1–L4, particularly. Within this range, there is a noticeable regu-larity that the lowest L1 of process maturity is related to offer one (73% of compa-nies), and in a few cases two (27% of companies) types of services. The level increases for those companies that offer a wider range of services (for the L4, the share of companies with only one type of service is 7%, two types 50% and three or more types is 43%).
The size of a company is significantly associated with the degree of the process development (Fig. 4). Lowest developed processes maturity is typical for micro and small companies (93% of companies at L1 and 50% at L5). The process
maturi-ty increases with the size of a company, i.e. the larger a company, the more likely a higher level of process maturity (for medium-sized companies from 7% at L1 to 22% at L5). Large companies at TFL sector are assigned to L4, at least.
Fig. 3. A structure of portfolio diversification with respect to process maturity of the TFL
sector, Poland, 2016
Fig. 4. A structure of the company size with respect to process maturity of the TFL sector,
Poland, 2016
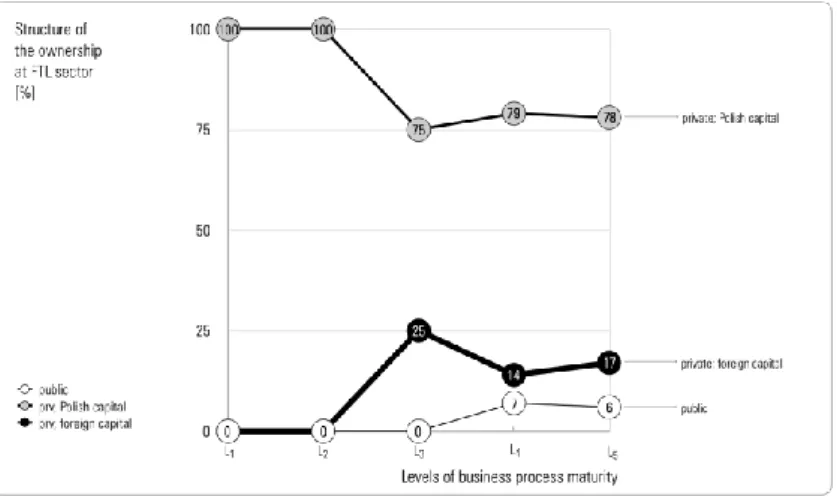
The ownership structure of companies at TFL sector has also typical relation-ship with the process maturity (Fig. 5). The dominant role at every level belongs to private companies with domestic capital (100% at the levels L1–L2), and it is de-creased with inde-creased level of maturity (up to 75–78% at L3–L4). Private companies with foreign capital are only represented at L3 or higher, and state-owned companies followed at levels L4–L5. This structure demonstrates the importance of market expe-rience and the amount of capital employed into the business.
Fig. 5. A structure of the ownership with respect to process maturity of the TFL sector,
Poland, 2016
3.3. Process management determinants of process maturity
While analysing a dependency between process management characteristics of the TFL companies and process maturity, six following factors have been taken into consideration: (1) process formalization, (2) process design structure, (3) proc-ess evaluation frequency, (4) procproc-ess development domain, (5) specialised IT sup-port, (6) process monitoring domain.
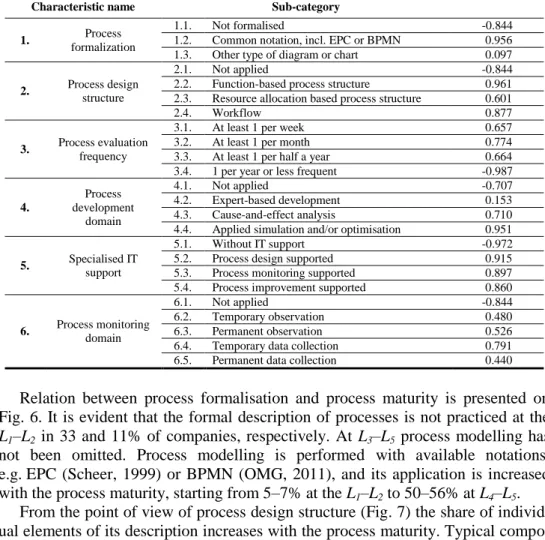
To assess the dependencies r-Pearson has been calculated, and the detailed list of result is presented in Tab. 3. The dependency between process maturity and se-lected process management practices is evident, since r-value is substantial high, including range (-0.707; -0.987) and (0.526; 0.956). However, in case of several characteristics there are some deviations from this rule. Within characteristic of process formalisation, the relation of other type of diagrams is below the threshold of significance with process maturity (0.097). Same result is observed within other characteristics i.e. process development domain (expert-based development: 0.153) and process monitoring domain (temporary observation: 0.480 and permanent data collection: 0.440).
The detailed analysis of relationship between characteristics of process man-agement practices and process maturity is presented in the following charts (Fig. 6–Fig. 11) and discussed accordingly. The lines on the charts are differenti-ated, and a dotted line represents those characteristics that its value has not signifi-cant dependency with process maturity (their names are also given in the brackets).
Table 3. Correlation between process management practice and process maturity of the
TFL sector, Poland, 2016
Process management characteristics
r-Pearson
Characteristic name Sub-category
1. formalization Process
1.1. Not formalised -0.844
1.2. Common notation, incl. EPC or BPMN 0.956
1.3. Other type of diagram or chart 0.097
2. Process design
structure
2.1. Not applied -0.844
2.2. Function-based process structure 0.961
2.3. Resource allocation based process structure 0.601
2.4. Workflow 0.877
3. Process evaluation
frequency
3.1. At least 1 per week 0.657
3.2. At least 1 per month 0.774
3.3. At least 1 per half a year 0.664
3.4. 1 per year or less frequent -0.987
4. Process development domain 4.1. Not applied -0.707 4.2. Expert-based development 0.153 4.3. Cause-and-effect analysis 0.710
4.4. Applied simulation and/or optimisation 0.951
5. Specialised IT
support
5.1. Without IT support -0.972
5.2. Process design supported 0.915
5.3. Process monitoring supported 0.897
5.4. Process improvement supported 0.860
6. Process monitoring domain
6.1. Not applied -0.844
6.2. Temporary observation 0.480
6.3. Permanent observation 0.526
6.4. Temporary data collection 0.791
6.5. Permanent data collection 0.440
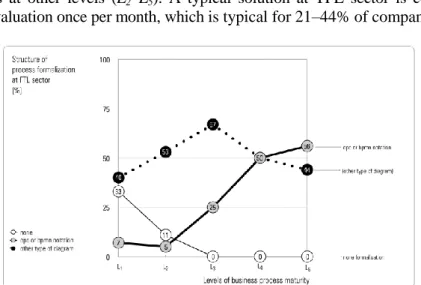
Relation between process formalisation and process maturity is presented on Fig. 6. It is evident that the formal description of processes is not practiced at the
L1–L2 in 33 and 11% of companies, respectively. At L3–L5 process modelling has not been omitted. Process modelling is performed with available notations, e.g. EPC (Scheer, 1999) or BPMN (OMG, 2011), and its application is increased with the process maturity, starting from 5–7% at the L1–L2 to 50–56% at L4–L5.
From the point of view of process design structure (Fig. 7) the share of individ-ual elements of its description increases with the process maturity. Typical compo-nents of process model at L1 are functions and workflow, applied in 40 and 27% of TFL companies, respectively. It is applied in nearly 80% of companies at L5. Mo-delling resource allocation is not significantly varied depending on the process maturity; it varies in the range of 7–16%.
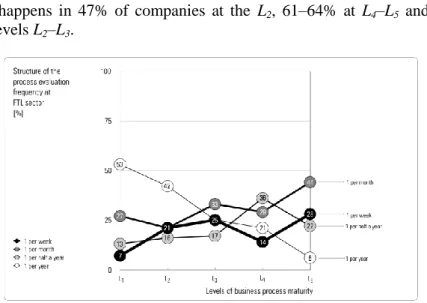
The frequency of process evaluation increases with the level of process maturity (Fig. 8). While more than 50% of TFL companies at L1 are conducting process evaluation at most once per year, it is almost unnoticeable at L5 (practiced by 6% of companies). On the other hand, a more intensive process evaluation frequency, i.e. at most once per week, is practiced at the L1 by 7% of companies, and 14–28% of the
companies at other levels (L2–L5). A typical solution at TFL sector is conducting process evaluation once per month, which is typical for 21–44% of companies.
Fig. 6. Process formalization with respect to process maturity of the TFL sector, Poland,
2016
Fig. 7. Process design structure with respect to process maturity of the TFL sector, Poland,
2016
Process improvement at the TFL sector is conducted at every level of process maturity (Fig. 9). The exception to this rule is 20% of companies located at L1. This type of companies do not practice advanced quantitative techniques (e.g. simula-tion and/or optimizasimula-tion). The share of those techniques is reaching 40% at L5, increasing progressively from L1. The most common solution for process deve-lopment at the TFL sector relays on the professionals’ experience and their
know-ledge. It happens in 47% of companies at the L2, 61–64% at L4–L5 and roughly 80% on levels L2–L3.
Fig. 8. Process evaluation frequency with respect to process maturity level of the TFL sector,
Poland, 2016
Fig. 9. Process development domain with respect to process maturity level of the TFL
sector, Poland, 2016
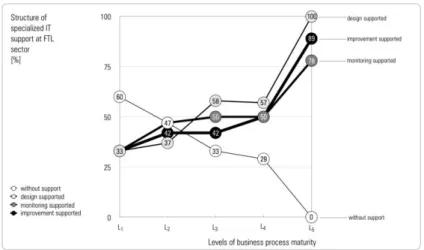
Business process management (BPM) life cycle is supported by specialised IT solutions, and its intensity is dependent on the level of process maturity (Fig. 10). While the lack of support at the L1 is recorded in almost 60% of TFL companies, at
L5 does not exist at all. On the other hand, a strong correlation between application of professional IT solutions for BPM life cycle (incl., design, monitoring and
im-provement) and process maturity is evident (see Tab. 3, r-value: 0.860–0.915, re-spectively).
Fig. 10. Specialised IT support with respect to process maturity level of the TFL sector,
Poland, 2016
Almost one-third companies at L1 are supported with specialised IT solutions at each BPM life cycle phases. Finally, at the highest level of process maturity 78–100% of companies are supported with such IT solutions.
As far as process monitoring practice is concerned (see Fig. 11), two key phe-nomena are noticeable. First, the lack of any formal mechanism of processes moni-toring concerns around 33% of TFL companies at L1 and 11% at L2. At higher levels
Fig. 11. Process monitoring domain with respect to process maturity of TFL sector, Poland,
of process maturity this phenomenon does not exist at all. Secondly, there are two specific process monitoring techniques applied at different process maturity levels, i.e. permanent process observation (it varies from 0% at L1 to 39% at L5) and tempo-rary data acquisition and its collection (from 13% of companies at L1 to 28% at L5).
4. CONCLUSIONS
The paper is devoted to the problem of process maturity evaluation performed with Transport-Forwarding-Logistics sector in Poland. Prior evaluation process several alternative process maturity models have been analysed. Finally, the au-thors have selected CMMI model, and the main arguments in favour of such a de-cision were both, precise definition of the different levels of process maturity, as well as the ability to perform a comparisons of the results of sever studies.
The evaluation of the process maturity at the TFL sector in Poland was based on the results of a survey executed in 78 companies. The evaluation of maturity di-rectly results from the allocation of each company to one of five groups defined by CMMI model. A result of the research indicates that there is no dominant level of process maturity at the TFL sector (it varies from 15 to 25%). The most frequently identified levels are L2 and L5, with 25 and 23% of companies, respectively, and the smallest number of companies is assigned to L3 (15% of them). The result of process maturity evaluation performed at the TFL sector against to other available studies for general market in Poland indicates that the TFL sector is relatively less developed.
The research performed by the authors has also investigated a set of characteris-tics that affect each level of process maturity. In this regard, two groups of charac-teristics on both, the business nature and process management practices have been analysed. Based on that, dominant TFL company’s profiles at different levels of process maturity have been determined (see Tab. 4a and Tab. 4b).
Table 4a. The dominant profile for each level of process maturity of the TFL sector,
Poland, 2016
Level
General business characteristics
Portfolio diversification Company size Ownership structure
L1 1 domain small private, Polish capital
L2 1 domain small private, Polish capital
L3 1 domain small private, Polish capital
L4 2 domains small private, Polish capital
Table 4b. The dominant profile for each level of process maturity at TFL sector, Poland,
2016
Process management characteristics Level Process design
structure Process evaluation frequency Process development domain Specialised IT support Process monitoring domain
L1 workflow 1 per year expert-based none none
L2 functions 1 per year expert-based
monitoring supported
temporary data collection
L3 functions 1 per month expert-based
design supported
temporary data collection
L4 workflow 1 per half a year expert-based
design supported
temporary data collection
L5 workflow 1 per month expert-based
design supported
temporary data collection
Further research should be focused on extension the list of considered characteris-tics, including general business and process management aspects. Objective versus subjective evaluation should also be applied and finally result should be compared
REFERENCES
Becker J., Knackstedt R. & Poeppelbuss J. (2009), Developing maturity models for IT ma-nagement, Business & Information Systems Engineering, 1 (3), pp. 213-222, doi:10.1007/s12599-009-0044-5.
Crosby P. (1979), Quality is Free, McGraw-Hill.
Object Management Group (2011), Business process model and notation (BPMN) – Version 2.0, January, http://www.omg.org/spec/BPMN/2.0.
Oxford University Publisher (2004), Oxford English Dictionary – The Definitive Record of the English Language, Oxford University Publisher.
Sawicki P. (2013), Wielokryterialna optymalizacja procesów w transporcie, ITE Radom. Scheer A.W. (1999), ARIS - Business Process Frameworks, Berlin, Springer-Verlag. Sliż P. (2016), Dojrzałość procesowa organizacji wyniki badań empirycznych, Prace
Naukowe Uniwersytetu Ekonomicznego we Wrocławiu, 421, pp. 530-542.
Software Engineering Institute (2010), CMMI for Development, Ver. 1.3, Technical Report, CMU/SEI-2010-TR-033, November, available from: http://www.sei.cmu.edu. Tarhan A., Turetken O. & Reijers H.A. (2016), Business process maturity models: A
syste-matic literature review, Information and Software Technology, 75, pp. 122-134, doi: 10.1016/j.infsof.2016.01.010.
Tartanus Ł. (2010), Dojrzałość procesowa polskich organizacji, available from: http://pro-cesowcy.pl/images/raport_dojrzalosc_procesowa_marzec_2010.pdf.
Tartanus Ł. (2016), Dojrzałość procesowa polskich organizacji, Available from: http://pro-cesowcy.pl/BadanieDojrzalosciProcesowej2016.pdf.
van Looy A., De Backer M. & Poels G. (2011), Defining business process maturity, A jour-ney towards excellence, Total Quality Management & Business Excellence, 22(11), pp. 1119-1137, doi:10.1080/14783363. 2011.624779.