USING SIMULATION TECHNOLOGY
IN COORDINATION OF SUPPLY CHAIN
Patrycja Hoffa* and Paweł Pawlewski**
* Faculty of Engineering Management, Poznan University of Technology, Poznan, Strzelecka 11, 60-965, Poland, Email: hoffa.patrycja@gmail.com
** Faculty of Engineering Management, Poznan University of Technology, Poznan, Strzelecka 11, 60-965, Poland, Email: pawel.pawlewski@put.poznan.pl
Abstract The article discusses issues related to planning of supply chains with use of simulation
technology. In the era of well developed information technology companies are constantly looking for new solutions to improve the organization of supply chains. It is interesting that by using the specialized computer software, such as simulation, it is possible to create a tool to support decision making in the field of supply chain organization. The paper presents a simulation model supporting the design of supply chains for the chosen variant of coordination of transport processes. The model, which shows the cooperation between enterprises, was created on the map of Poland. In order to create the best representation of reality, a number of random variables are reflected
inthe simulation, i.e. the speed of the transport, changing weather conditions (eg. hail, blizzards, torrential downpours), the probability of an accident or failure of the means of transport. Using thecreated simulation tool can show the financial benefits of the partnership for the defined routes.
Paper type: Research Paper Published online: 30 April 2014 Vol. 4, No. 2, pp. 167-177 ISSN 2083-4942 (Print) ISSN 2083-4950 (Online)
© 2014 Poznan University of Technology. All rights reserved.
1. INTRODUCTION
Designing supply chains, even within a specific group of companies is a difficult and complex process. Number of articles describes the complexity of sup-ply chain and management them (Caddy & Helou, 2007), (Hashemi, Butcher & Chetri, 2013). Supply chains are evaluated for their effectiveness, which consists of a number of ele-ments as described in (Lichocik & Sadowski, 2013). One of the solutions to improve the situation of the company is the configuration of the current supply chain, which a company participates in. Decisions made within the supply chain configuration are described in (Kawa, 2011). Another option is to coordinate the transport processes in the virtual supply chains using specialized computer software, such as simulation (Terzi & Cavalieri, 2004), (Arshinder, Kanda & Deshmukh, 2008).
By creating a simulation tool to support a supply chain for a specific group of com-panies, the benefits of the chosen forms of cooperation have been shown. The si-mulation model contains of a number of random variables in order to make the best representation of reality, such as the speed of the transport. The main pieces of infor-mation obtained using this model are: time to cover the various sections taking into consideration the different types of disturbances (e.g., traffic congestion, accidents), the fuel consumption depending on the speed the means of transport move at, and the amount of harmful products generated according to the defined emission class for the transport. The model includes the variability of the defined elements affecting the time and cost of the process.
2. MODELS OF COORDINATION OF TRANSPORT PROCESSES
The transport planning of either finished products or raw materials is usually aimed at cutting costs. Currently, frequent and small supplies are popular, yet they contribute to a continuous increase in the cost of transport. In addition, they cause the growth in the number of vehicles realizing supplies leading to the increase in traf-fic congestion and lengthening the delivery times (Hajdul, 2010). The use of informa-tion technology that enables a group of companies to communicate and consolidate freight transport is a solution the will make it possible to reduce the number of trans-ports by means of increasing the filling of vehicles. In fact, the increase in the fulfill-ment of the means of transport reduces the unit cost oftransport (known as economies of scale). The solution that makes it possible forcompanies to reduce the cost of trans-portation may be to create virtual supply chains. A group of companies analyzed based on several factors, including business location, directions of ongoing transports, fre-quency and volume of transport, could work together to combine freight transport. Of course, this is not a closed group - it can be extended with new companies interested in this service. A virtual supply chain would be monitored by a person, who would connect the corresponding transport freight by analyzing demands of thecompa-nies. The cooperation between companies in terms of transport would be deter-mined on the basis of a few pre-defined variants of transport process coordination. According K. Grzybowska, a coordination in the supply chain provides the follow-ing benefits: effective response to competition and customer demand, (2) reducfollow-ing the bull whip effect, (3) the integration of the three flows occurring in the supply chain (material, information and financial flows) (Grzybowska, 2011), (Grzybowska, 2013).
The possible options for the coordination of transport processes in the virtual supply chains are as follows: (1) Consolidation of the deliveries to common cities or on shared routes (Fig. 1), in order to increase the degree of load space and / or capacity of the means of transport. It should be defined what area belongs to a region, e.g. an area within 25 km radius, (2) elimination of the cycles of vehicles without any cargo, so called "empty miles" (Fig. 2)., It should be defined what area belongs to a region, e.g. an area within 25 km radius, (3) a combination of the two options above.
Fig. 1 Coordination of a supply chain; Source: own study based on the materials of ILiM
Fig. 2 Elimination of cycles of vehicles without cargo; Source: own study based on the materials of ILiM
Fig. 3 Chosen variant of supply chain coordination; Source: own study based on the materials of ILiM
For each of the coordination models several variants of cooperation can be defined. The simulation model was created for one of them – taking into account the consolidation of a supply chain including the join of transports, in case both companies (loading points) are in the defined region, e.g. an area within 25 km radius Also, the unloading points should be located within a certain distance (Fig. 3). Other models of coordination are presented in (Hoffa, 2013).
3. SIMULATION MODEL
3.1. The definition of the problem, assumptions
The simulation model was built for the chosen variant of coordination of transport processes in the virtual supply chains. In order to show the benefits of the cooperation between companies according to the selected option, a model of the common route and two individual routes was created. Therefore, it was possible to demonstrate the bene-fits of the cooperation (e.g. reducing costs through the shared participation and increas-ing the fillincreas-ing capacity of the vehicle). For the purposes of the work, three routes that are shown in Table 1 were created.
Table 1 The planned route of delivery
Type of route Loading point Zip code Unloading point
Zip code
Distance [km]
Individual route Komorniki 62-052 Łódź 93-001 209
Individual route Tarnowo Podgórne 62-080 Pabianice 95-200 253
Common route Tarnowo Podgórne,
Komorniki,
Łódź,
In order to best reflect the actual conditions of the analyzed process, it was de-cided to include a number of variables that affect the time and cost of covering the route. The time of the analyzed process is influenced by the following factors:
• the type of road – national road or highway, • traffic congestion,
• road traffic accidents (the so called “black spots”),
• weather conditions – sudden bad weather, such as hail, storm, snowstorm, • failure of the means of transport,
• the time of payment at toll booths – when using highways, toll booths should be considered as well as the amount of charges (which affects the costs involved).
Analyzing the planned supply chain draws attention to the cost aspect of covering a section of route. In case of the planned routes, the following factors should be taken into consideration:
• charges incurred for using the motorway A2, section (Komorniki - Konin) managed by Autostrada Wielkopolska (Autostrada Wielkopolska - pricelist, 2013)
• charges incurred for using the motorway A2, section (Konin - Emilia node) managed by GDDKiA (viaTOLL, 2013)
• fuel costs.
The simulation model takes into account the amount of emissions depending on the adopted Euro class (NGK Spark Plug Europe, 2013). The engine exhaust gas contains harmful products such as carbon monoxide (CO), hydrocarbons (HC) and nitrogen oxides (NOx).
When creating the simulation model, a number of variables were included in order to to best reflect the actual conditions of the analyzed process. These variables are defined using different probability distributions. The examples of defined variables are as follows:
• the speed of the means of transport, depending on the type of road, they are moving on (Table 2),
Table 2 The speed of the means of transport
Mean [kph] Stddev [kph] Min [kph] Max [kph] The speed of transport means - national road 70 3 60 70
The speed of transport means - highway 80 3 70 80
•
the probability of an accident at a specific point and stop time in the place of an accident (Table 3),Table 3 Road accidents
Place Probability of [%] Stop time
Mean [h] Stddev [h] Min [h] Max [h]
Łódź 10 1 0.5 0.25 10
•
a failure of the transport (in the simulation it is defined by determining the time between failures and the time needed to repair the damage (Table 4)). Table 4 A failure of the means of transportMean [h] Stddev [h] Min [h] Max [h]
The time between failures 40 10 10 100
Repair time 1 0.5 0.5 4
The simulation model was created in the FlexSim software. “FlexSim is the most powerful tool for modeling, analyzing, visualizing, and optimizing any imaginable process - from manufacturing to supply chains, abstract examples to real world sys-tems, and anything in between” (Flexsim, 2013). FlexSim Software Product was founded in 1993 by Bill Nordgren, Roger Hullinger and Cliff King. FlexSim is a modern tool that sets the standard in the forefront of software for discrete event simu-lation. FlexSim offers three types of software: the general version, in which every con-ceivable process can be modeled, version FlexSim CT, which can simulate and analyze operations in the container terminal and the version FlexSim Healthcare – a tool for modeling the complexities of healthcare management.
3.2. The simulation experiment
Simulation helps to understand the functioning of a given process and system, and it allows you to quickly define the optimal solutions with minimal risk of error (Beaverstock, Greenwood, Lavery & Nordgren, 2011). In order to obtain answers to the questions related to the course of supply chain planning process, a number of simulation experiments was made. In each of the experiments some parameters were changed, which allowed the demonstration of impact of individual factors on the course of the process. Information about individual simulation experiments is presented in Table 5.
After each simulation experiment, the obtained data was analyzed, including: • time to cover each section of the route and the total time of covering the route, • the cost of the route, depending on the speed of means of transport,
• emission values depending on the length of the route traveled, and the defi-ned emission class for the means of transport.
Table 5 Summary of information about each of the simulation experiments No simulation experiment Loading/ unloading time Type of
emission Other included variables
I variable Euro 5
Probability of an accident, Changing weather conditions,
Probability of congestion,
II variable Euro 4
Probability of an accident, Changing weather conditions,
Probability of congestion,
III variable Euro 3
Probability of an accident, Changing weather conditions,
Probability of congestion,
IV constant Euro 5
Probability of an accident, Changing weather conditions,
Probability of congestion,
V*
variable Euro 5
Probability of an accident, Changing weather conditions,
Probability of congestion,
VI**
variable Euro 5
Probability of an accident, Changing weather conditions,
Probability of congestion, *each route repeated 5 times
** each route repeated 100 times
The present article shows only the results achieved for the first experiment. Other results are described in the thesis (Hoffa, 2013).
Fig. 4 Experiment I – the total, Source: own study
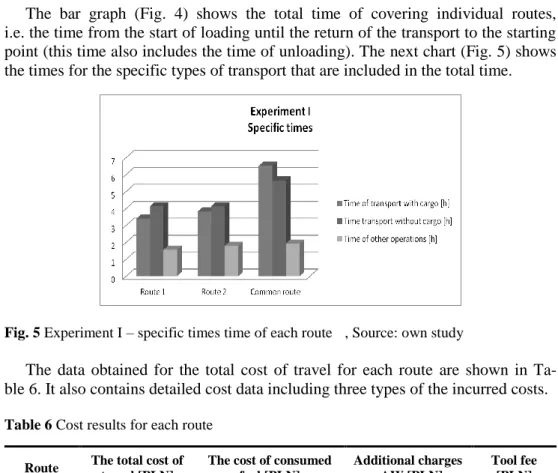
The bar graph (Fig. 4) shows the total time of covering individual routes, i.e. the time from the start of loading until the return of the transport to the starting point (this time also includes the time of unloading). The next chart (Fig. 5) shows the times for the specific types of transport that are included in the total time.
Fig. 5 Experiment I – specific times time of each route , Source: own study
The data obtained for the total cost of travel for each route are shown in Ta-ble 6. It also contains detailed cost data including three types of the incurred costs. Table 6 Cost results for each route
Route The total cost of travel [PLN]
The cost of consumed fuel [PLN] Additional charges - AW [PLN] Tool fee [PLN] Route 1 1012,51 737,24 252,00 23,27 Route 2 958,51 832,51 126,00 0,00 Common route 1182,44 906,25 252,00 24,19
Comparing the cost of travel for each individual route to the cost of covering the common route (split in half due to the two parties involved) indicates the savings resulting from the consolidation of supply (Table 7).
Table 7 Savings
Route Savings [%]
Route 1 41,61
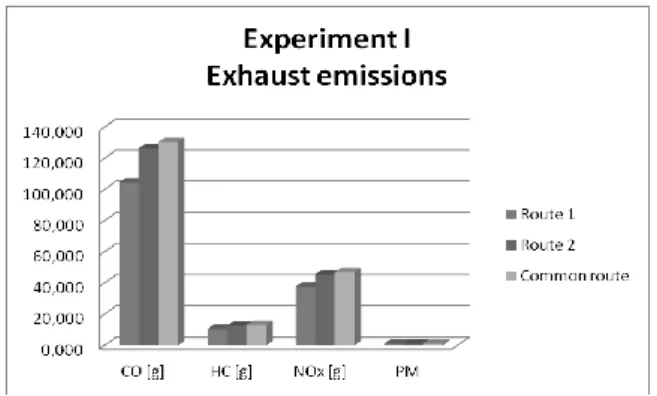
The generated volume of individual harmful products for each of the route is shown in the bar graph (Fig. 6). The defined emission class is Euro 5.
Fig. 6 Exhaust gas emission; Source: own study
4. CONCLUSION
The created simulation model can be applied as a decision support system in the field of supply chain planning for specific routes. The model enables the analysis of the effects of decisions without interfering with the actual system. This approach significantly reduces the risk related with making changes. With use of this model it is possible to obtain significant information, such as the time needed to cover particu-lar sections, taking into account different types of disturbances (e.g. traffic congestion, accidents), the fuel consumption, depending on the speed of means of transport and the amount of harmful products generated according to the accepted emission class for the means of transport. The model takes into account the variability of the defined elements affecting the time and cost of the whole process.
By expanding the model by another route and variants of cooperation between enterprises it is possible to obtain a good tool for the cost-benefit analysis for indi-vidual companies depending on the accepted form of cooperation.
ACKNOWLEDGEMENTS
Presented research are carried out under the LOGOS project (Model of coordina-tion of virtual supply chains meeting the requirements of corporate social respon-sibility) under grant agreement number PBS1/B9/17/2013.
REFERENCES
Arshinder, Kanda A. & Deshmukh S.G., (2008), “Supply chain coordination: Perspectives, empirical studies and research directions”, International Journal of Production Economics 115, pp. 316-355.
Beaverstock M., Greenwood A., Lavery E. & Nordgren W., (2011), Applied Simulation. Modeling and Analysis using Flexsim, Flexsim Software Products, Inc.
Caddy I.N. & Helou M.M., (2007), “Supply chains and their management: Application of general systems theory”, Journal of Retailing and Consumer Services 14, pp. 319-327. Grzybowska K., (2011), „Koordynacja w łańcuchu dostaw - przejaw zarządzania
logistycznego - ujęcie teoretyczne”, Witkowski J., Bąkowska-Morawska U. (eds.), Strategie i logistyka w sektorze usług. Strategie na rynku TSL. Prace Naukowe Uniwersytetu Ekonomicznego we Wrocławiu No 235, Wydawnictwo Uniwersytetu Ekonomicznego we Wrocławiu, Wrocław, pp. 259-268.
Grzybowska K., (2013), Koordynacja w łańcuchu dostaw – przejaw zarządzania logistycznego – wyniki badań, Gospodarka Materiałowa i Logistyka, No 11, pp. 20-22
Hajdul M., (2010), “Model of coordination of transport processes according to the concept of sustainable development”, LogForum 2010, Vol. 6, Issue 3, No 5, pp. 45-56. Hashemi A., Butcher T. & Chhetri P., (2013), “A modeling framework for the analysis of
supply chain complexity using product design and demand characteristics”, Inter-national Journal of Engineering, Science and Technology, Vol. 5, No 2, pp. 150-164. Hoffa P., (2013) Zastosowanie technologii symulacyjnych w projektowaniu łańcuchów
dostaw. Thesis work, Politechnika Poznańska.
Kawa A., (2011), „Metody konfigurowania łańcuchów dostaw w sieci przedsiębiorstw”, Ciesielski M. (ed.), Zarządzanie łańcuchem dostaw, Polskie Wydawnictwo Ekonomiczne, Warszawa.
Lichocik G. & Sadowski A., (2013), „Efficient of supply chain management. Strategic and operational approach”, LogForum 2013, Vol. 9, Issue 2, No 6, pp.119-125.
Terzi S., Cavalieri S., (2004), “Simulation in the supply chain context: a survey”, Computes in Industry 53, pp. 3-16.
Materials recieved from Instytut Logistyki i Magazynowania (ILiM) in Poznan. http://autostrada-a2.pl/pl/oplaty/cennik, (accessed 2013).
http://www.flexsim.com/, (accessed 2013). http://www.ngk.de/pl, (accessed 2013).
http://www.viatoll.pl/pl/pojazdy-ciezkie/stawki-oplat, (accessed 2013).
BIOGRAPHICAL NOTES
Patrycja Hoffa is a graduate with distinction of the Poznań University of Technology, she studied Logistics at the Faculty of Engineering Management. In the academic year 2012/2013 she received a scholarship from the Minister of Science and Higher Education for outstanding achievement. She participated in conferences. She is a co-author of articles. Since 2010 she has been a member of the SOCILAPP – Simulation and Optimization Center in Logistic and Production Processes.
Paweł Pawlewski is an assistant professor at the Faculty of Engineering Management at Poznan University of Technology. His research interests include organization of manufa-cturing systems, monitoring of operations management, reengineering and IT application for logistics, process modeling, simulation and optimization. He is author or co-author over 100 manuscripts including books, journals and conference proceedings. He is managing director of SOCILAPP Simulation and Optimization Center in Logistics and Production Processes.